
|
|||||
|
 | |
| |
| |
| |
| |
| |
|
Gene: AMBP |
Gene summary for AMBP |
| Gene information | Species | Human | Gene symbol | AMBP | Gene ID | 259 |
| Gene name | alpha-1-microglobulin/bikunin precursor | |
| Gene Alias | A1M | |
| Cytomap | 9q32 | |
| Gene Type | protein-coding | GO ID | GO:0000003 | UniProtAcc | P02760 |
Top |
Malignant transformation analysis |
| Identification of the aberrant gene expression in precancerous and cancerous lesions by comparing the gene expression of stem-like cells in diseased tissues with normal stem cells |
| Entrez ID | Symbol | Replicates | Species | Organ | Tissue | Adj P-value | Log2FC | Malignancy |
| 259 | AMBP | NAFLD1 | Human | Liver | NAFLD | 5.03e-04 | -4.31e-01 | -0.04 |
| 259 | AMBP | S43 | Human | Liver | Cirrhotic | 1.42e-21 | -3.41e-01 | -0.0187 |
| 259 | AMBP | HCC1_Meng | Human | Liver | HCC | 1.40e-15 | 4.01e-01 | 0.0246 |
| 259 | AMBP | HCC2_Meng | Human | Liver | HCC | 1.16e-68 | -1.44e+00 | 0.0107 |
| 259 | AMBP | cirrhotic1 | Human | Liver | Cirrhotic | 6.98e-06 | 3.83e-01 | 0.0202 |
| 259 | AMBP | cirrhotic2 | Human | Liver | Cirrhotic | 1.02e-04 | 3.41e-01 | 0.0201 |
| 259 | AMBP | HCC1 | Human | Liver | HCC | 8.17e-27 | 6.71e+00 | 0.5336 |
| 259 | AMBP | HCC2 | Human | Liver | HCC | 1.56e-31 | 7.53e+00 | 0.5341 |
| 259 | AMBP | HCC5 | Human | Liver | HCC | 5.04e-08 | 4.52e+00 | 0.4932 |
| 259 | AMBP | Pt13.a | Human | Liver | HCC | 7.52e-19 | 3.64e-01 | 0.021 |
| 259 | AMBP | Pt13.b | Human | Liver | HCC | 2.64e-31 | 1.47e-01 | 0.0251 |
| 259 | AMBP | Pt13.c | Human | Liver | HCC | 1.46e-08 | 4.87e-01 | 0.0076 |
| 259 | AMBP | Pt14.b | Human | Liver | HCC | 2.66e-05 | 2.77e-01 | 0.018 |
| 259 | AMBP | S014 | Human | Liver | HCC | 3.21e-27 | 3.61e+00 | 0.2254 |
| 259 | AMBP | S015 | Human | Liver | HCC | 1.62e-32 | 4.43e+00 | 0.2375 |
| 259 | AMBP | S016 | Human | Liver | HCC | 4.40e-23 | 3.79e+00 | 0.2243 |
| 259 | AMBP | S027 | Human | Liver | HCC | 8.75e-29 | 4.30e+00 | 0.2446 |
| 259 | AMBP | S028 | Human | Liver | HCC | 8.67e-39 | 4.26e+00 | 0.2503 |
| 259 | AMBP | S029 | Human | Liver | HCC | 5.67e-41 | 5.19e+00 | 0.2581 |
| Page: 1 |
| Tissue | Expression Dynamics | Abbreviation |
| Liver | 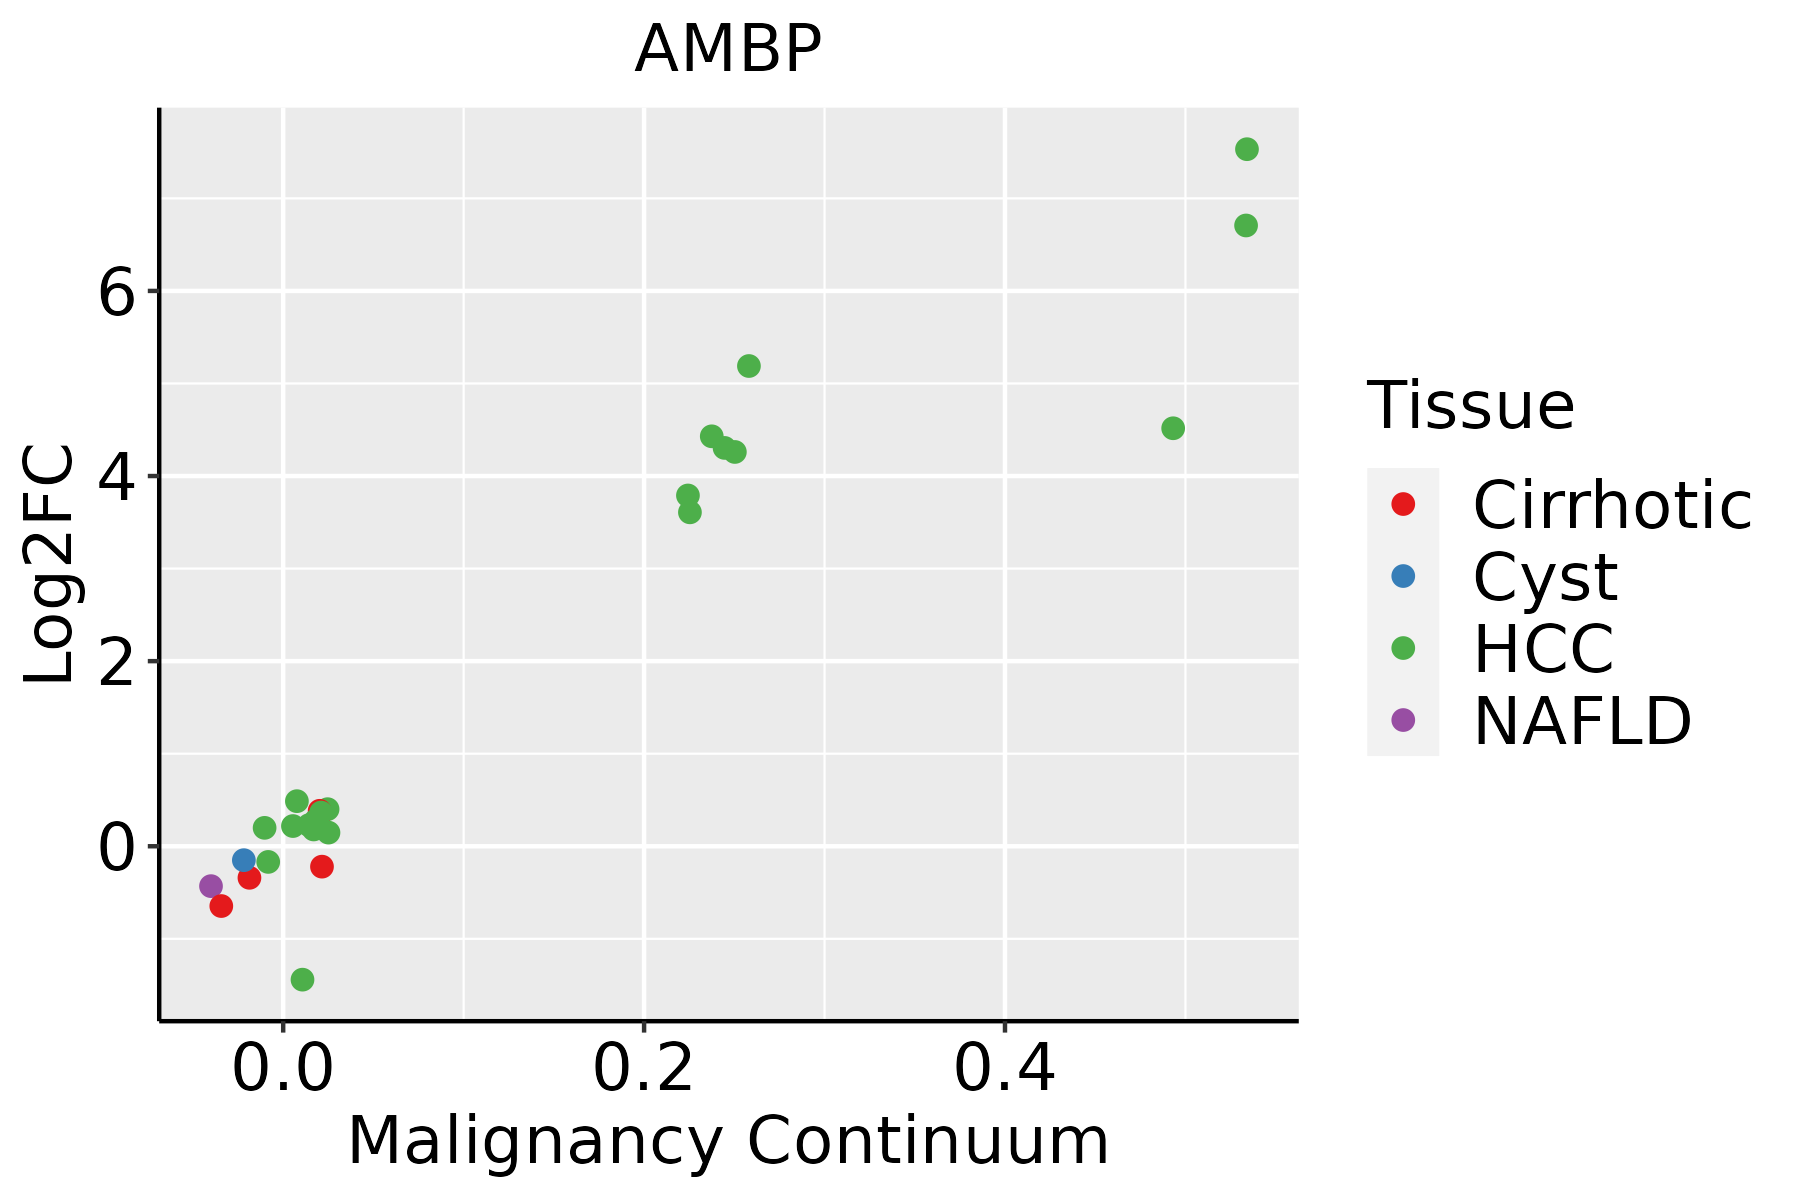 | HCC: Hepatocellular carcinoma |
| NAFLD: Non-alcoholic fatty liver disease |
| ∗log2FC in expression of this searched gene in stem-like cells from each diseased tissue sample relative to stem-like cells in normal samples in each tissue plotted against the malignancy continuum. Samples are colored based on if they are from different disease stage. |
Top |
Malignant transformation related pathway analysis |
| Find out the enriched GO biological processes and KEGG pathways involved in transition from healthy to precancer to cancer |
| Tissue | Disease Stage | Enriched GO biological Processes |
| Colorectum | AD |  |
| Colorectum | SER |  |
| Colorectum | MSS |  |
| Colorectum | MSI-H |  |
| Colorectum | FAP |  |
| ∗Top 15 enriched GO BP terms are showed in the bar plot of each disease state in each tissue. Each row represents a significant GO biological process which is colored according to the -log10(p.adjust). |
| Page: 1 2 3 4 5 6 7 8 9 |
| GO ID | Tissue | Disease Stage | Description | Gene Ratio | Bg Ratio | pvalue | p.adjust | Count |
| GO:003109822 | Liver | HCC | stress-activated protein kinase signaling cascade | 138/7958 | 247/18723 | 1.43e-05 | 1.57e-04 | 138 |
| GO:005140322 | Liver | HCC | stress-activated MAPK cascade | 134/7958 | 239/18723 | 1.50e-05 | 1.64e-04 | 134 |
| GO:000091011 | Liver | HCC | cytokinesis | 100/7958 | 173/18723 | 3.38e-05 | 3.39e-04 | 100 |
| GO:004586122 | Liver | HCC | negative regulation of proteolysis | 186/7958 | 351/18723 | 4.19e-05 | 4.11e-04 | 186 |
| GO:00706461 | Liver | HCC | protein modification by small protein removal | 91/7958 | 157/18723 | 6.50e-05 | 5.92e-04 | 91 |
| GO:0042168 | Liver | HCC | heme metabolic process | 30/7958 | 42/18723 | 1.40e-04 | 1.13e-03 | 30 |
| GO:00330131 | Liver | HCC | tetrapyrrole metabolic process | 39/7958 | 59/18723 | 2.14e-04 | 1.63e-03 | 39 |
| GO:005134622 | Liver | HCC | negative regulation of hydrolase activity | 195/7958 | 379/18723 | 2.44e-04 | 1.82e-03 | 195 |
| GO:006164011 | Liver | HCC | cytoskeleton-dependent cytokinesis | 60/7958 | 100/18723 | 3.09e-04 | 2.20e-03 | 60 |
| GO:00067781 | Liver | HCC | porphyrin-containing compound metabolic process | 33/7958 | 49/18723 | 3.86e-04 | 2.62e-03 | 33 |
| GO:0042440 | Liver | HCC | pigment metabolic process | 51/7958 | 84/18723 | 5.74e-04 | 3.65e-03 | 51 |
| GO:00434097 | Liver | HCC | negative regulation of MAPK cascade | 98/7958 | 180/18723 | 7.88e-04 | 4.74e-03 | 98 |
| GO:00165791 | Liver | HCC | protein deubiquitination | 78/7958 | 139/18723 | 8.13e-04 | 4.87e-03 | 78 |
| GO:007030222 | Liver | HCC | regulation of stress-activated protein kinase signaling cascade | 105/7958 | 195/18723 | 8.79e-04 | 5.20e-03 | 105 |
| GO:003287312 | Liver | HCC | negative regulation of stress-activated MAPK cascade | 33/7958 | 51/18723 | 1.13e-03 | 6.44e-03 | 33 |
| GO:007030312 | Liver | HCC | negative regulation of stress-activated protein kinase signaling cascade | 33/7958 | 51/18723 | 1.13e-03 | 6.44e-03 | 33 |
| GO:00705361 | Liver | HCC | protein K63-linked deubiquitination | 24/7958 | 35/18723 | 1.64e-03 | 8.61e-03 | 24 |
| GO:003287222 | Liver | HCC | regulation of stress-activated MAPK cascade | 102/7958 | 192/18723 | 1.86e-03 | 9.49e-03 | 102 |
| GO:004657811 | Liver | HCC | regulation of Ras protein signal transduction | 100/7958 | 189/18723 | 2.42e-03 | 1.18e-02 | 100 |
| GO:000725412 | Liver | HCC | JNK cascade | 89/7958 | 167/18723 | 3.09e-03 | 1.44e-02 | 89 |
| Page: 1 2 3 4 5 6 |
| Pathway ID | Tissue | Disease Stage | Description | Gene Ratio | Bg Ratio | pvalue | p.adjust | qvalue | Count |
| Page: 1 |
Top |
Cell-cell communication analysis |
| Identification of potential cell-cell interactions between two cell types and their ligand-receptor pairs for different disease states |
| Ligand | Receptor | LRpair | Pathway | Tissue | Disease Stage |
| Page: 1 |
Top |
Single-cell gene regulatory network inference analysis |
| Find out the significant the regulons (TFs) and the target genes of each regulon across cell types for different disease states |
| TF | Cell Type | Tissue | Disease Stage | Target Gene | RSS | Regulon Activity |
| ∗The dot plots of a searched regulon are shown for all cell subpopulations in each disease state of each tissue based on the regulon specific score inferred using pySCENIC and by calculating the average expression. |
| Page: 1 |
Top |
Somatic mutation of malignant transformation related genes |
| Annotation of somatic variants for genes involved in malignant transformation |
| Hugo Symbol | Variant Class | Variant Classification | dbSNP RS | HGVSc | HGVSp | HGVSp Short | SWISSPROT | BIOTYPE | SIFT | PolyPhen | Tumor Sample Barcode | Tissue | Histology | Sex | Age | Stage | Therapy Types | Drugs | Outcome |
| AMBP | SNV | Missense_Mutation | c.629A>T | p.Gln210Leu | p.Q210L | P02760 | protein_coding | tolerated(0.38) | benign(0) | TCGA-AR-A1AH-01 | Breast | breast invasive carcinoma | Female | <65 | I/II | Unspecific | PD | ||
| AMBP | SNV | Missense_Mutation | c.76N>G | p.Pro26Ala | p.P26A | P02760 | protein_coding | tolerated(0.15) | benign(0.024) | TCGA-D8-A13Y-01 | Breast | breast invasive carcinoma | Female | <65 | I/II | Chemotherapy | doxorubicin | SD | |
| AMBP | SNV | Missense_Mutation | c.477N>C | p.Glu159Asp | p.E159D | P02760 | protein_coding | tolerated(0.8) | benign(0.015) | TCGA-AA-3510-01 | Colorectum | colon adenocarcinoma | Male | >=65 | I/II | Unknown | Unknown | SD | |
| AMBP | SNV | Missense_Mutation | rs369822351 | c.610C>T | p.Arg204Trp | p.R204W | P02760 | protein_coding | deleterious(0) | possibly_damaging(0.877) | TCGA-AD-5900-01 | Colorectum | colon adenocarcinoma | Male | >=65 | I/II | Unknown | Unknown | SD |
| AMBP | SNV | Missense_Mutation | c.438N>G | p.Ile146Met | p.I146M | P02760 | protein_coding | tolerated(0.09) | possibly_damaging(0.564) | TCGA-AZ-4681-01 | Colorectum | colon adenocarcinoma | Female | >=65 | I/II | Unknown | Unknown | SD | |
| AMBP | SNV | Missense_Mutation | novel | c.973A>G | p.Asn325Asp | p.N325D | P02760 | protein_coding | deleterious(0) | possibly_damaging(0.788) | TCGA-A5-A0GW-01 | Endometrium | uterine corpus endometrioid carcinoma | Female | <65 | I/II | Unknown | Unknown | SD |
| AMBP | SNV | Missense_Mutation | novel | c.828N>T | p.Glu276Asp | p.E276D | P02760 | protein_coding | tolerated(0.15) | benign(0.01) | TCGA-A5-A1OF-01 | Endometrium | uterine corpus endometrioid carcinoma | Female | <65 | I/II | Unknown | Unknown | SD |
| AMBP | SNV | Missense_Mutation | c.782A>G | p.Tyr261Cys | p.Y261C | P02760 | protein_coding | deleterious(0) | probably_damaging(1) | TCGA-AP-A056-01 | Endometrium | uterine corpus endometrioid carcinoma | Female | <65 | I/II | Unknown | Unknown | SD | |
| AMBP | SNV | Missense_Mutation | c.205N>A | p.Val69Met | p.V69M | P02760 | protein_coding | deleterious(0.03) | benign(0.357) | TCGA-AP-A059-01 | Endometrium | uterine corpus endometrioid carcinoma | Female | >=65 | I/II | Unknown | Unknown | SD | |
| AMBP | SNV | Missense_Mutation | rs748722080 | c.281N>T | p.Thr94Met | p.T94M | P02760 | protein_coding | tolerated(0.28) | benign(0.017) | TCGA-AX-A06F-01 | Endometrium | uterine corpus endometrioid carcinoma | Female | <65 | III/IV | Chemotherapy | carboplatin | SD |
| Page: 1 2 3 4 |
Top |
Related drugs of malignant transformation related genes |
| Identification of chemicals and drugs interact with genes involved in malignant transfromation |
| (DGIdb 4.0) |
| Entrez ID | Symbol | Category | Interaction Types | Drug Claim Name | Drug Name | PMIDs |
| Page: 1 |

Copyright 2023-Present -The University of Texas Health Science Center at Houston |