
|
|||||
|
 | |
| |
| |
| |
| |
| |
|
Gene: ALDH6A1 |
Gene summary for ALDH6A1 |
| Gene information | Species | Human | Gene symbol | ALDH6A1 | Gene ID | 4329 |
| Gene name | aldehyde dehydrogenase 6 family member A1 | |
| Gene Alias | MMSADHA | |
| Cytomap | 14q24.3 | |
| Gene Type | protein-coding | GO ID | GO:0006082 | UniProtAcc | Q02252 |
Top |
Malignant transformation analysis |
| Identification of the aberrant gene expression in precancerous and cancerous lesions by comparing the gene expression of stem-like cells in diseased tissues with normal stem cells |
| Entrez ID | Symbol | Replicates | Species | Organ | Tissue | Adj P-value | Log2FC | Malignancy |
| 4329 | ALDH6A1 | HTA11_3410_2000001011 | Human | Colorectum | AD | 1.37e-04 | 1.74e-01 | 0.0155 |
| 4329 | ALDH6A1 | HTA11_2487_2000001011 | Human | Colorectum | SER | 3.76e-03 | 2.06e-01 | -0.1808 |
| 4329 | ALDH6A1 | HTA11_1938_2000001011 | Human | Colorectum | AD | 2.26e-07 | 3.38e-01 | -0.0811 |
| 4329 | ALDH6A1 | HTA11_78_2000001011 | Human | Colorectum | AD | 3.33e-09 | 3.35e-01 | -0.1088 |
| 4329 | ALDH6A1 | HTA11_347_2000001011 | Human | Colorectum | AD | 1.05e-31 | 6.59e-01 | -0.1954 |
| 4329 | ALDH6A1 | HTA11_411_2000001011 | Human | Colorectum | SER | 3.50e-03 | 4.28e-01 | -0.2602 |
| 4329 | ALDH6A1 | HTA11_83_2000001011 | Human | Colorectum | SER | 3.95e-02 | 2.78e-01 | -0.1526 |
| 4329 | ALDH6A1 | HTA11_696_2000001011 | Human | Colorectum | AD | 2.46e-06 | 2.68e-01 | -0.1464 |
| 4329 | ALDH6A1 | HTA11_866_2000001011 | Human | Colorectum | AD | 1.60e-06 | 2.31e-01 | -0.1001 |
| 4329 | ALDH6A1 | HTA11_1391_2000001011 | Human | Colorectum | AD | 1.20e-12 | 4.03e-01 | -0.059 |
| 4329 | ALDH6A1 | HTA11_5216_2000001011 | Human | Colorectum | SER | 1.03e-02 | 3.45e-01 | -0.1462 |
| 4329 | ALDH6A1 | HTA11_546_2000001011 | Human | Colorectum | AD | 3.14e-02 | 2.75e-01 | -0.0842 |
| 4329 | ALDH6A1 | HTA11_866_3004761011 | Human | Colorectum | AD | 7.27e-06 | 1.95e-01 | 0.096 |
| 4329 | ALDH6A1 | HTA11_8622_2000001021 | Human | Colorectum | SER | 1.35e-02 | 3.02e-01 | 0.0528 |
| 4329 | ALDH6A1 | HTA11_10711_2000001011 | Human | Colorectum | AD | 1.25e-02 | 2.14e-01 | 0.0338 |
| 4329 | ALDH6A1 | HTA11_7696_3000711011 | Human | Colorectum | AD | 2.02e-08 | 3.17e-01 | 0.0674 |
| 4329 | ALDH6A1 | HTA11_99999970781_79442 | Human | Colorectum | MSS | 1.06e-09 | 3.29e-01 | 0.294 |
| 4329 | ALDH6A1 | HTA11_99999965104_69814 | Human | Colorectum | MSS | 2.48e-12 | 5.02e-01 | 0.281 |
| 4329 | ALDH6A1 | LZE4T | Human | Esophagus | ESCC | 3.38e-06 | 1.19e-01 | 0.0811 |
| 4329 | ALDH6A1 | LZE20T | Human | Esophagus | ESCC | 3.79e-03 | 6.23e-02 | 0.0662 |
| Page: 1 2 3 4 5 |
| Tissue | Expression Dynamics | Abbreviation |
| Colorectum (GSE201348) |  | FAP: Familial adenomatous polyposis |
| CRC: Colorectal cancer | ||
| Colorectum (HTA11) |  | AD: Adenomas |
| SER: Sessile serrated lesions | ||
| MSI-H: Microsatellite-high colorectal cancer | ||
| MSS: Microsatellite stable colorectal cancer | ||
| Esophagus |  | ESCC: Esophageal squamous cell carcinoma |
| HGIN: High-grade intraepithelial neoplasias | ||
| LGIN: Low-grade intraepithelial neoplasias | ||
| Liver |  | HCC: Hepatocellular carcinoma |
| NAFLD: Non-alcoholic fatty liver disease | ||
| Prostate | 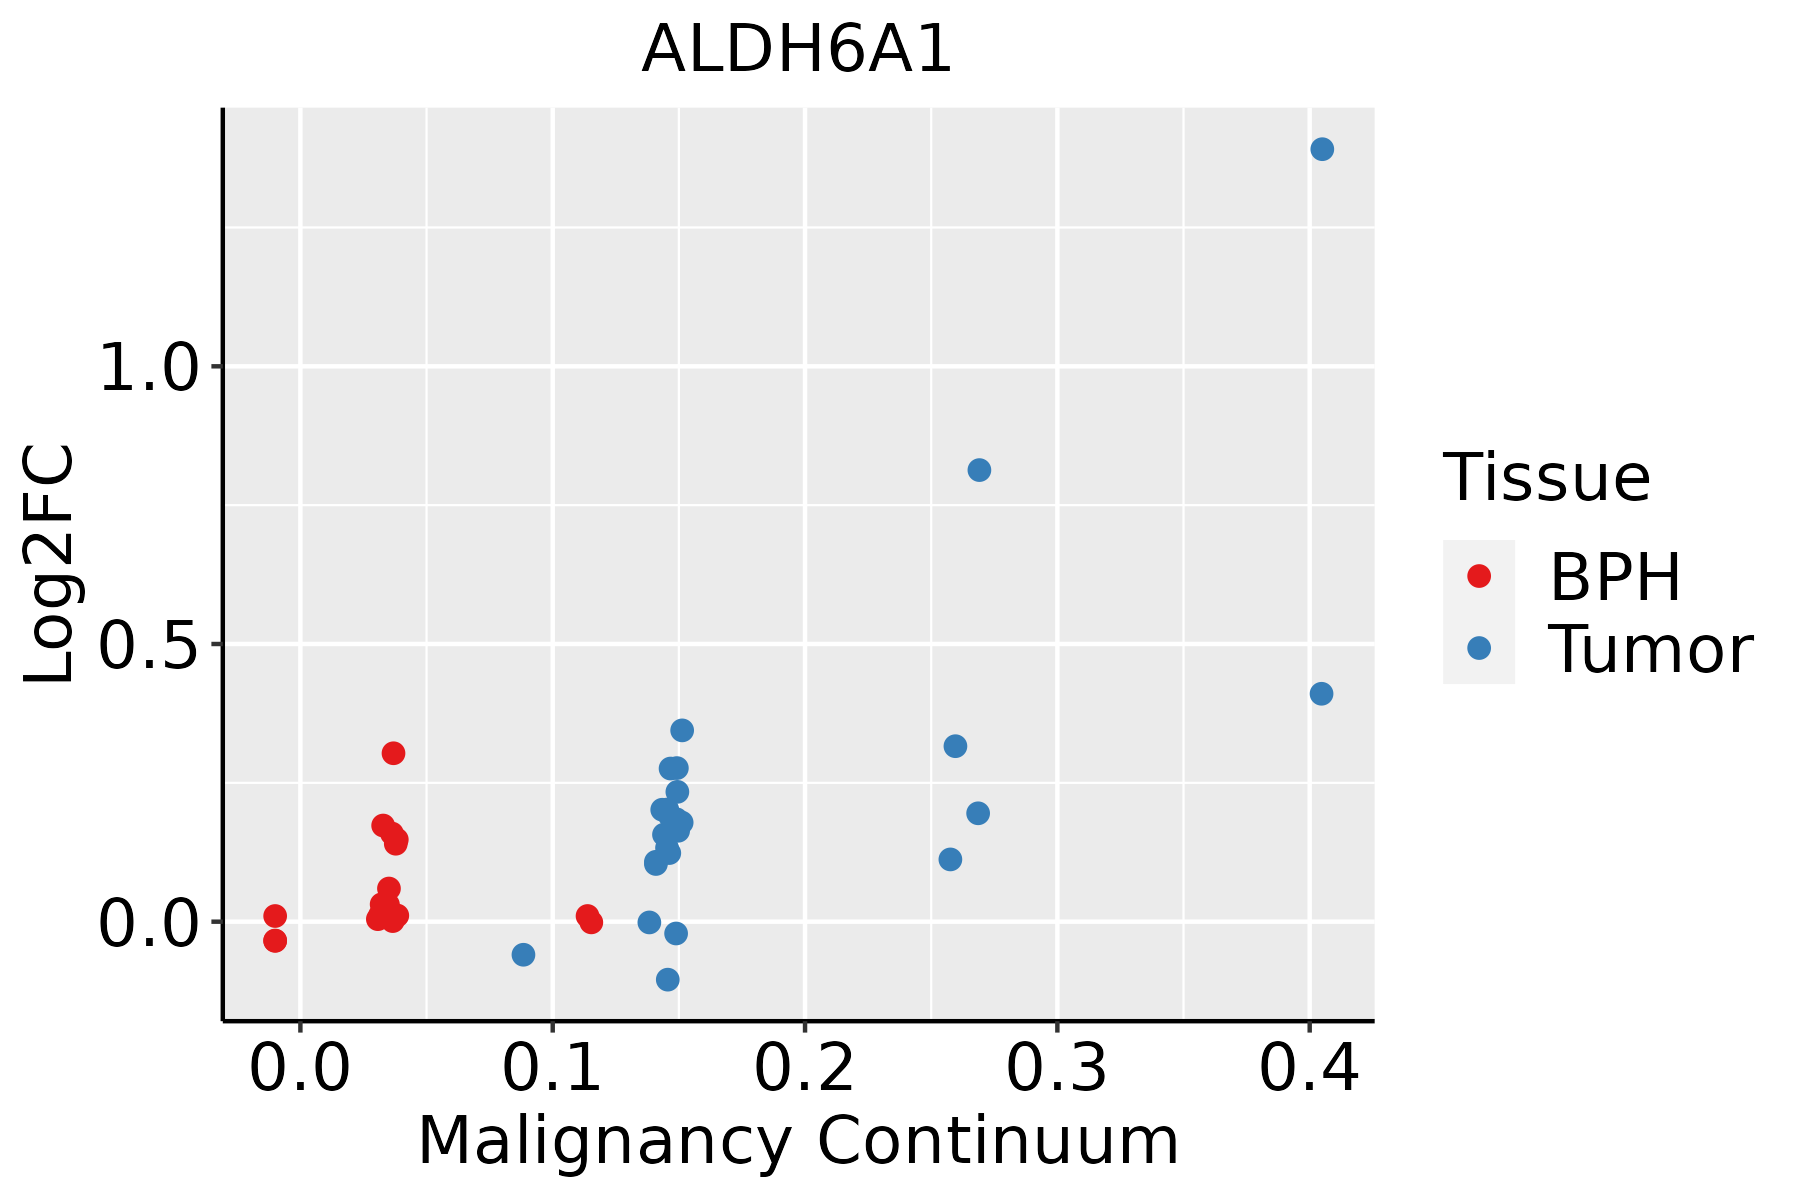 | BPH: Benign Prostatic Hyperplasia |
| Thyroid |  | ATC: Anaplastic thyroid cancer |
| HT: Hashimoto's thyroiditis | ||
| PTC: Papillary thyroid cancer |
| ∗log2FC in expression of this searched gene in stem-like cells from each diseased tissue sample relative to stem-like cells in normal samples in each tissue plotted against the malignancy continuum. Samples are colored based on if they are from different disease stage. |
Top |
Malignant transformation related pathway analysis |
| Find out the enriched GO biological processes and KEGG pathways involved in transition from healthy to precancer to cancer |
| Tissue | Disease Stage | Enriched GO biological Processes |
| Colorectum | AD |  |
| Colorectum | SER |  |
| Colorectum | MSS |  |
| Colorectum | MSI-H |  |
| Colorectum | FAP |  |
| ∗Top 15 enriched GO BP terms are showed in the bar plot of each disease state in each tissue. Each row represents a significant GO biological process which is colored according to the -log10(p.adjust). |
| Page: 1 2 3 4 5 6 7 8 9 |
| GO ID | Tissue | Disease Stage | Description | Gene Ratio | Bg Ratio | pvalue | p.adjust | Count |
| GO:004670014 | Prostate | Tumor | heterocycle catabolic process | 117/3246 | 445/18723 | 1.11e-06 | 2.10e-05 | 117 |
| GO:004544414 | Prostate | Tumor | fat cell differentiation | 69/3246 | 229/18723 | 1.22e-06 | 2.28e-05 | 69 |
| GO:004427015 | Prostate | Tumor | cellular nitrogen compound catabolic process | 118/3246 | 451/18723 | 1.30e-06 | 2.39e-05 | 118 |
| GO:190136114 | Prostate | Tumor | organic cyclic compound catabolic process | 124/3246 | 495/18723 | 7.37e-06 | 1.10e-04 | 124 |
| GO:00090835 | Prostate | Tumor | branched-chain amino acid catabolic process | 8/3246 | 15/18723 | 1.63e-03 | 9.79e-03 | 8 |
| GO:00090814 | Prostate | Tumor | branched-chain amino acid metabolic process | 8/3246 | 19/18723 | 1.00e-02 | 4.20e-02 | 8 |
| GO:0046700111 | Thyroid | PTC | heterocycle catabolic process | 221/5968 | 445/18723 | 2.43e-15 | 1.72e-13 | 221 |
| GO:0044270111 | Thyroid | PTC | cellular nitrogen compound catabolic process | 223/5968 | 451/18723 | 3.34e-15 | 2.31e-13 | 223 |
| GO:1901361111 | Thyroid | PTC | organic cyclic compound catabolic process | 231/5968 | 495/18723 | 2.55e-12 | 1.12e-10 | 231 |
| GO:004544418 | Thyroid | PTC | fat cell differentiation | 102/5968 | 229/18723 | 3.66e-05 | 3.40e-04 | 102 |
| GO:004670024 | Thyroid | ATC | heterocycle catabolic process | 228/6293 | 445/18723 | 7.26e-15 | 4.50e-13 | 228 |
| GO:004427025 | Thyroid | ATC | cellular nitrogen compound catabolic process | 229/6293 | 451/18723 | 2.25e-14 | 1.27e-12 | 229 |
| GO:190136124 | Thyroid | ATC | organic cyclic compound catabolic process | 238/6293 | 495/18723 | 1.12e-11 | 4.12e-10 | 238 |
| GO:004544423 | Thyroid | ATC | fat cell differentiation | 105/6293 | 229/18723 | 7.42e-05 | 5.62e-04 | 105 |
| Page: 1 2 3 4 |
| Pathway ID | Tissue | Disease Stage | Description | Gene Ratio | Bg Ratio | pvalue | p.adjust | qvalue | Count |
| hsa01200 | Colorectum | AD | Carbon metabolism | 55/2092 | 115/8465 | 5.53e-08 | 8.42e-07 | 5.37e-07 | 55 |
| hsa00280 | Colorectum | AD | Valine, leucine and isoleucine degradation | 25/2092 | 48/8465 | 3.97e-05 | 3.41e-04 | 2.18e-04 | 25 |
| hsa00640 | Colorectum | AD | Propanoate metabolism | 18/2092 | 32/8465 | 1.33e-04 | 1.11e-03 | 7.08e-04 | 18 |
| hsa012001 | Colorectum | AD | Carbon metabolism | 55/2092 | 115/8465 | 5.53e-08 | 8.42e-07 | 5.37e-07 | 55 |
| hsa002801 | Colorectum | AD | Valine, leucine and isoleucine degradation | 25/2092 | 48/8465 | 3.97e-05 | 3.41e-04 | 2.18e-04 | 25 |
| hsa006401 | Colorectum | AD | Propanoate metabolism | 18/2092 | 32/8465 | 1.33e-04 | 1.11e-03 | 7.08e-04 | 18 |
| hsa012002 | Colorectum | SER | Carbon metabolism | 40/1580 | 115/8465 | 2.77e-05 | 3.41e-04 | 2.47e-04 | 40 |
| hsa006402 | Colorectum | SER | Propanoate metabolism | 13/1580 | 32/8465 | 3.20e-03 | 2.12e-02 | 1.54e-02 | 13 |
| hsa012003 | Colorectum | SER | Carbon metabolism | 40/1580 | 115/8465 | 2.77e-05 | 3.41e-04 | 2.47e-04 | 40 |
| hsa006403 | Colorectum | SER | Propanoate metabolism | 13/1580 | 32/8465 | 3.20e-03 | 2.12e-02 | 1.54e-02 | 13 |
| hsa012004 | Colorectum | MSS | Carbon metabolism | 43/1875 | 115/8465 | 1.37e-04 | 1.17e-03 | 7.19e-04 | 43 |
| hsa002802 | Colorectum | MSS | Valine, leucine and isoleucine degradation | 21/1875 | 48/8465 | 6.73e-04 | 4.51e-03 | 2.76e-03 | 21 |
| hsa006404 | Colorectum | MSS | Propanoate metabolism | 15/1875 | 32/8465 | 1.68e-03 | 9.05e-03 | 5.55e-03 | 15 |
| hsa012005 | Colorectum | MSS | Carbon metabolism | 43/1875 | 115/8465 | 1.37e-04 | 1.17e-03 | 7.19e-04 | 43 |
| hsa002803 | Colorectum | MSS | Valine, leucine and isoleucine degradation | 21/1875 | 48/8465 | 6.73e-04 | 4.51e-03 | 2.76e-03 | 21 |
| hsa006405 | Colorectum | MSS | Propanoate metabolism | 15/1875 | 32/8465 | 1.68e-03 | 9.05e-03 | 5.55e-03 | 15 |
| hsa0120023 | Esophagus | ESCC | Carbon metabolism | 79/4205 | 115/8465 | 2.50e-05 | 1.21e-04 | 6.22e-05 | 79 |
| hsa002809 | Esophagus | ESCC | Valine, leucine and isoleucine degradation | 34/4205 | 48/8465 | 2.34e-03 | 6.54e-03 | 3.35e-03 | 34 |
| hsa0120033 | Esophagus | ESCC | Carbon metabolism | 79/4205 | 115/8465 | 2.50e-05 | 1.21e-04 | 6.22e-05 | 79 |
| hsa0028014 | Esophagus | ESCC | Valine, leucine and isoleucine degradation | 34/4205 | 48/8465 | 2.34e-03 | 6.54e-03 | 3.35e-03 | 34 |
| Page: 1 2 |
Top |
Cell-cell communication analysis |
| Identification of potential cell-cell interactions between two cell types and their ligand-receptor pairs for different disease states |
| Ligand | Receptor | LRpair | Pathway | Tissue | Disease Stage |
| Page: 1 |
Top |
Single-cell gene regulatory network inference analysis |
| Find out the significant the regulons (TFs) and the target genes of each regulon across cell types for different disease states |
| TF | Cell Type | Tissue | Disease Stage | Target Gene | RSS | Regulon Activity |
| ∗The dot plots of a searched regulon are shown for all cell subpopulations in each disease state of each tissue based on the regulon specific score inferred using pySCENIC and by calculating the average expression. |
| Page: 1 |
Top |
Somatic mutation of malignant transformation related genes |
| Annotation of somatic variants for genes involved in malignant transformation |
| Hugo Symbol | Variant Class | Variant Classification | dbSNP RS | HGVSc | HGVSp | HGVSp Short | SWISSPROT | BIOTYPE | SIFT | PolyPhen | Tumor Sample Barcode | Tissue | Histology | Sex | Age | Stage | Therapy Types | Drugs | Outcome |
| ALDH6A1 | SNV | Missense_Mutation | c.1469C>T | p.Ser490Phe | p.S490F | Q02252 | protein_coding | deleterious(0) | probably_damaging(1) | TCGA-AC-A3QQ-01 | Breast | breast invasive carcinoma | Female | <65 | I/II | Unknown | Unknown | SD | |
| ALDH6A1 | SNV | Missense_Mutation | novel | c.1267N>A | p.Leu423Ile | p.L423I | Q02252 | protein_coding | deleterious(0.01) | probably_damaging(0.944) | TCGA-AN-A046-01 | Breast | breast invasive carcinoma | Female | >=65 | I/II | Unknown | Unknown | SD |
| ALDH6A1 | SNV | Missense_Mutation | c.329A>C | p.Gln110Pro | p.Q110P | Q02252 | protein_coding | tolerated(0.07) | possibly_damaging(0.46) | TCGA-AA-3715-01 | Colorectum | colon adenocarcinoma | Male | >=65 | I/II | Unknown | Unknown | PD | |
| ALDH6A1 | SNV | Missense_Mutation | c.1201N>G | p.Pro401Ala | p.P401A | Q02252 | protein_coding | deleterious(0.02) | probably_damaging(1) | TCGA-AA-A00O-01 | Colorectum | colon adenocarcinoma | Female | >=65 | III/IV | Unknown | Unknown | SD | |
| ALDH6A1 | SNV | Missense_Mutation | rs374367200 | c.262N>T | p.Arg88Cys | p.R88C | Q02252 | protein_coding | deleterious(0.01) | possibly_damaging(0.809) | TCGA-AM-5821-01 | Colorectum | colon adenocarcinoma | Female | >=65 | I/II | Unknown | Unknown | SD |
| ALDH6A1 | SNV | Missense_Mutation | c.424C>A | p.Leu142Ile | p.L142I | Q02252 | protein_coding | tolerated(0.16) | possibly_damaging(0.606) | TCGA-AZ-6601-01 | Colorectum | colon adenocarcinoma | Male | >=65 | I/II | Unknown | Unknown | PD | |
| ALDH6A1 | SNV | Missense_Mutation | c.480G>T | p.Met160Ile | p.M160I | Q02252 | protein_coding | tolerated(0.3) | benign(0.033) | TCGA-G4-6309-01 | Colorectum | colon adenocarcinoma | Female | <65 | III/IV | Chemotherapy | xeloda | PD | |
| ALDH6A1 | SNV | Missense_Mutation | c.1256N>C | p.Phe419Ser | p.F419S | Q02252 | protein_coding | deleterious(0) | probably_damaging(1) | TCGA-G4-6320-01 | Colorectum | colon adenocarcinoma | Male | >=65 | III/IV | Chemotherapy | oxaliplatin | SD | |
| ALDH6A1 | SNV | Missense_Mutation | rs376852895 | c.908A>G | p.Asn303Ser | p.N303S | Q02252 | protein_coding | tolerated(0.06) | benign(0.338) | TCGA-AG-A002-01 | Colorectum | rectum adenocarcinoma | Male | <65 | I/II | Unknown | Unknown | SD |
| ALDH6A1 | SNV | Missense_Mutation | novel | c.628C>T | p.Pro210Ser | p.P210S | Q02252 | protein_coding | deleterious(0) | probably_damaging(0.979) | TCGA-A5-A0G1-01 | Endometrium | uterine corpus endometrioid carcinoma | Female | >=65 | I/II | Unknown | Unknown | SD |
| Page: 1 2 3 4 5 |
Top |
Related drugs of malignant transformation related genes |
| Identification of chemicals and drugs interact with genes involved in malignant transfromation |
| (DGIdb 4.0) |
| Entrez ID | Symbol | Category | Interaction Types | Drug Claim Name | Drug Name | PMIDs |
| Page: 1 |

Copyright 2023-Present -The University of Texas Health Science Center at Houston |