
|
|||||
|
 | |
| |
| |
| |
| |
| |
|
Gene: AKAP12 |
Gene summary for AKAP12 |
| Gene information | Species | Human | Gene symbol | AKAP12 | Gene ID | 9590 |
| Gene name | A-kinase anchoring protein 12 | |
| Gene Alias | AKAP250 | |
| Cytomap | 6q25.1 | |
| Gene Type | protein-coding | GO ID | GO:0000165 | UniProtAcc | Q02952 |
Top |
Malignant transformation analysis |
| Identification of the aberrant gene expression in precancerous and cancerous lesions by comparing the gene expression of stem-like cells in diseased tissues with normal stem cells |
| Entrez ID | Symbol | Replicates | Species | Organ | Tissue | Adj P-value | Log2FC | Malignancy |
| 9590 | AKAP12 | AEH-subject2 | Human | Endometrium | AEH | 1.15e-02 | 2.86e-02 | -0.2525 |
| 9590 | AKAP12 | AEH-subject3 | Human | Endometrium | AEH | 3.27e-05 | -1.46e-01 | -0.2576 |
| 9590 | AKAP12 | AEH-subject4 | Human | Endometrium | AEH | 2.27e-02 | 7.66e-02 | -0.2657 |
| 9590 | AKAP12 | AEH-subject5 | Human | Endometrium | AEH | 1.70e-03 | -1.33e-01 | -0.2953 |
| 9590 | AKAP12 | EEC-subject1 | Human | Endometrium | EEC | 4.33e-04 | -1.40e-01 | -0.2682 |
| 9590 | AKAP12 | EEC-subject2 | Human | Endometrium | EEC | 1.46e-05 | -3.60e-02 | -0.2607 |
| 9590 | AKAP12 | EEC-subject3 | Human | Endometrium | EEC | 1.67e-04 | -1.29e-01 | -0.2525 |
| 9590 | AKAP12 | EEC-subject4 | Human | Endometrium | EEC | 6.35e-05 | -1.50e-01 | -0.2571 |
| 9590 | AKAP12 | EEC-subject5 | Human | Endometrium | EEC | 2.27e-06 | -1.72e-01 | -0.249 |
| 9590 | AKAP12 | GSM5276934 | Human | Endometrium | EEC | 3.90e-37 | 8.73e-01 | -0.0913 |
| 9590 | AKAP12 | GSM5276937 | Human | Endometrium | EEC | 4.24e-57 | 1.31e+00 | -0.0897 |
| 9590 | AKAP12 | GSM6177620_NYU_UCEC1_lib1_lib1 | Human | Endometrium | EEC | 5.49e-06 | -1.48e-01 | -0.1869 |
| 9590 | AKAP12 | GSM6177620_NYU_UCEC1_lib2_lib2 | Human | Endometrium | EEC | 2.13e-05 | -2.03e-01 | -0.1875 |
| 9590 | AKAP12 | GSM6177620_NYU_UCEC1_lib3_lib3 | Human | Endometrium | EEC | 1.12e-06 | -2.03e-01 | -0.1883 |
| 9590 | AKAP12 | GSM6177621_NYU_UCEC2_lib1_lib1 | Human | Endometrium | EEC | 1.85e-09 | -1.96e-01 | -0.1934 |
| 9590 | AKAP12 | GSM6177622_NYU_UCEC3_lib1_lib1 | Human | Endometrium | EEC | 2.65e-11 | -1.60e-01 | -0.1917 |
| 9590 | AKAP12 | GSM6177622_NYU_UCEC3_lib2_lib2 | Human | Endometrium | EEC | 9.79e-09 | -1.65e-01 | -0.1916 |
| 9590 | AKAP12 | P4T-E | Human | Esophagus | ESCC | 8.68e-10 | 3.56e-01 | 0.1323 |
| 9590 | AKAP12 | P8T-E | Human | Esophagus | ESCC | 4.67e-07 | 3.46e-01 | 0.0889 |
| 9590 | AKAP12 | P11T-E | Human | Esophagus | ESCC | 1.86e-10 | 9.50e-01 | 0.1426 |
| Page: 1 2 3 4 |
| Tissue | Expression Dynamics | Abbreviation |
| Endometrium | 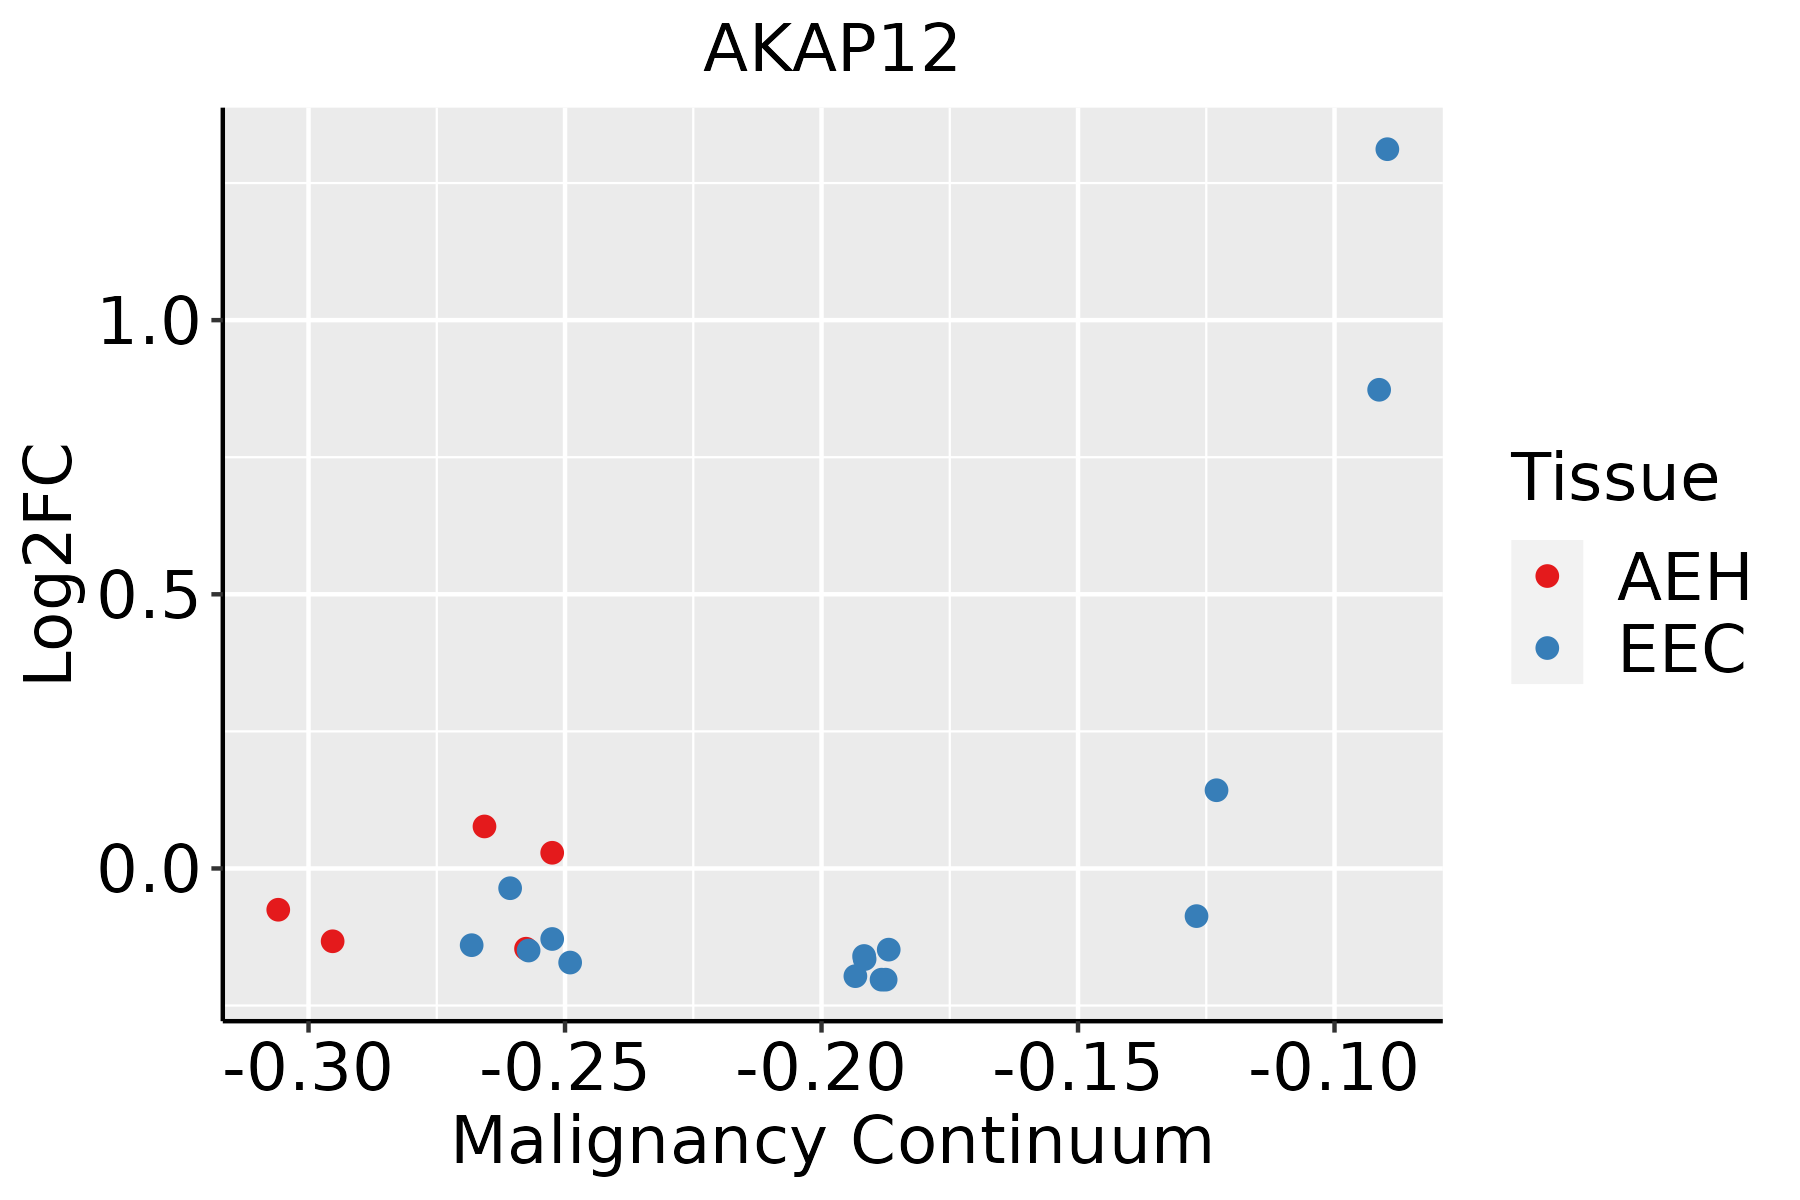 | AEH: Atypical endometrial hyperplasia |
| EEC: Endometrioid Cancer | ||
| Esophagus | 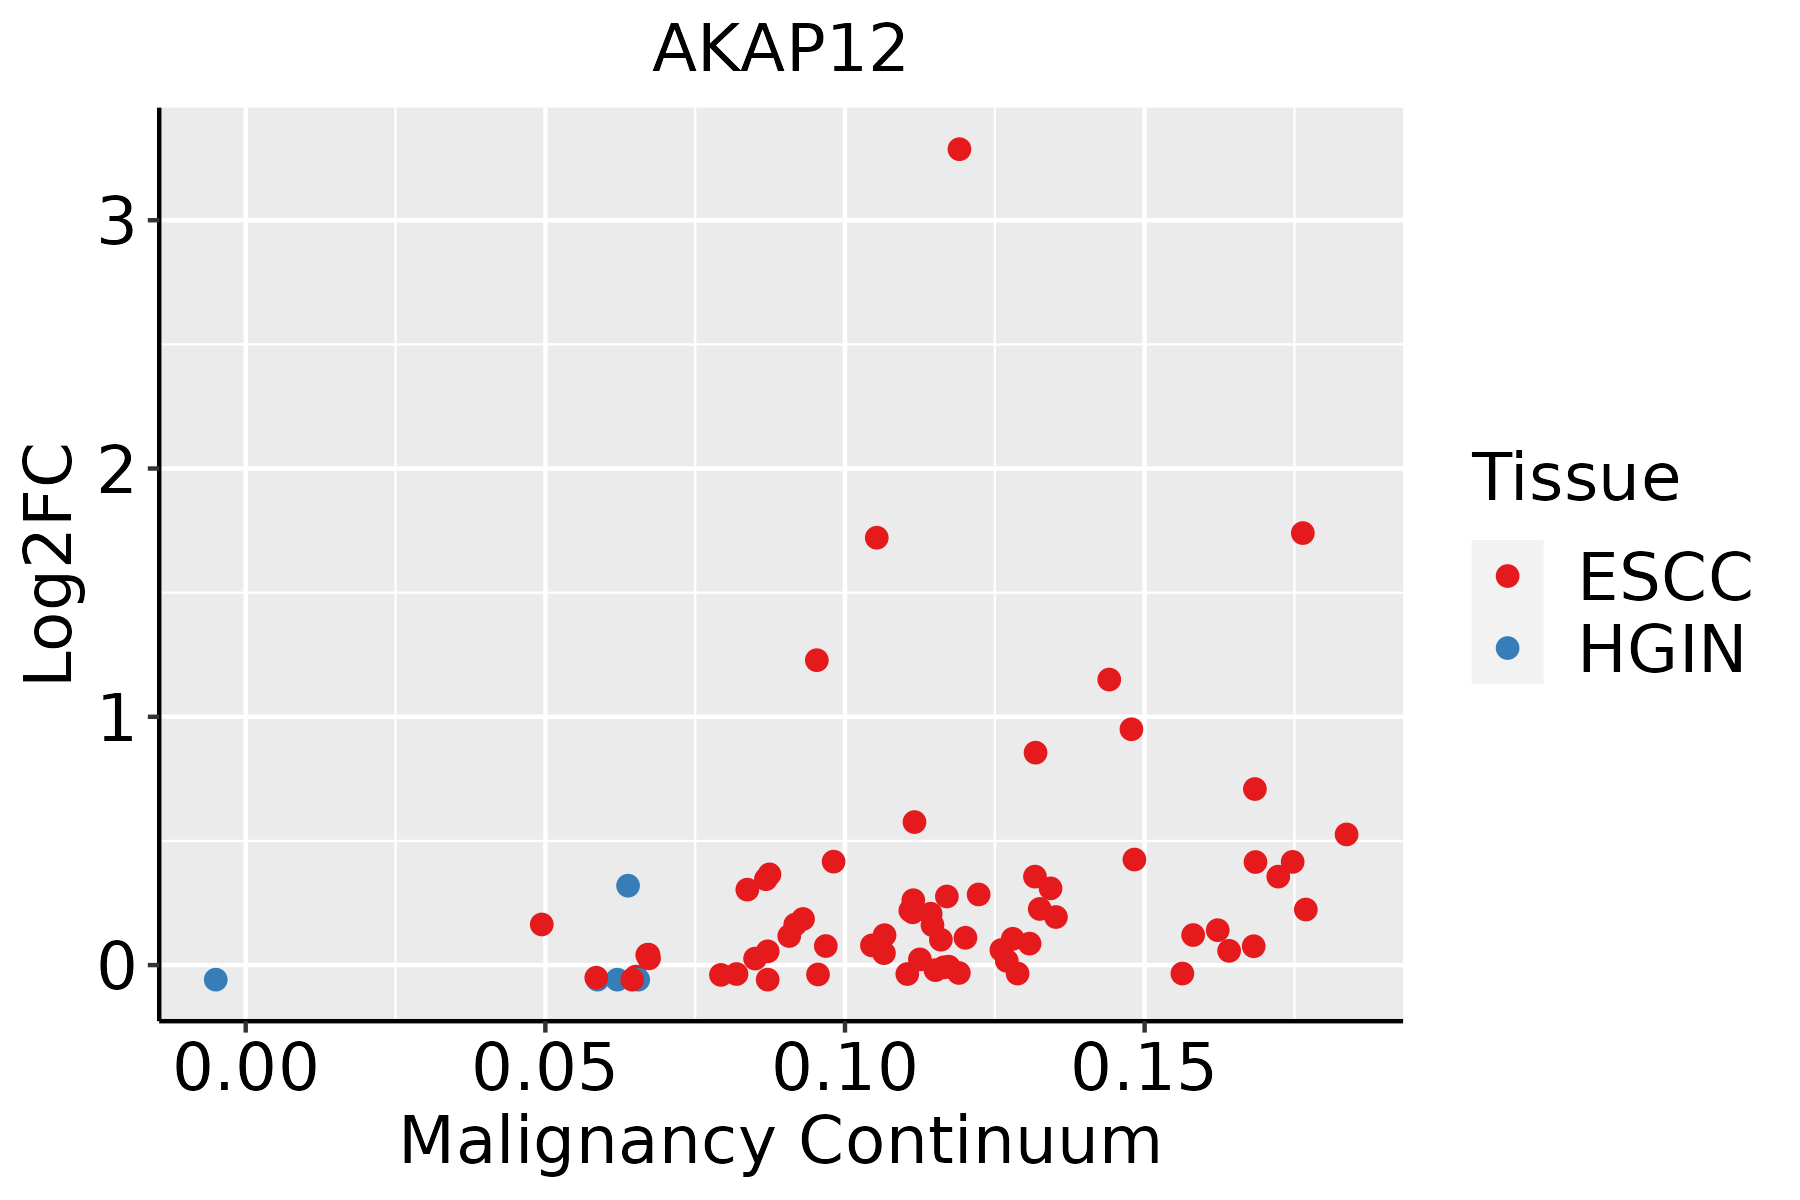 | ESCC: Esophageal squamous cell carcinoma |
| HGIN: High-grade intraepithelial neoplasias | ||
| LGIN: Low-grade intraepithelial neoplasias | ||
| Oral Cavity |  | EOLP: Erosive Oral lichen planus |
| LP: leukoplakia | ||
| NEOLP: Non-erosive oral lichen planus | ||
| OSCC: Oral squamous cell carcinoma | ||
| Prostate | 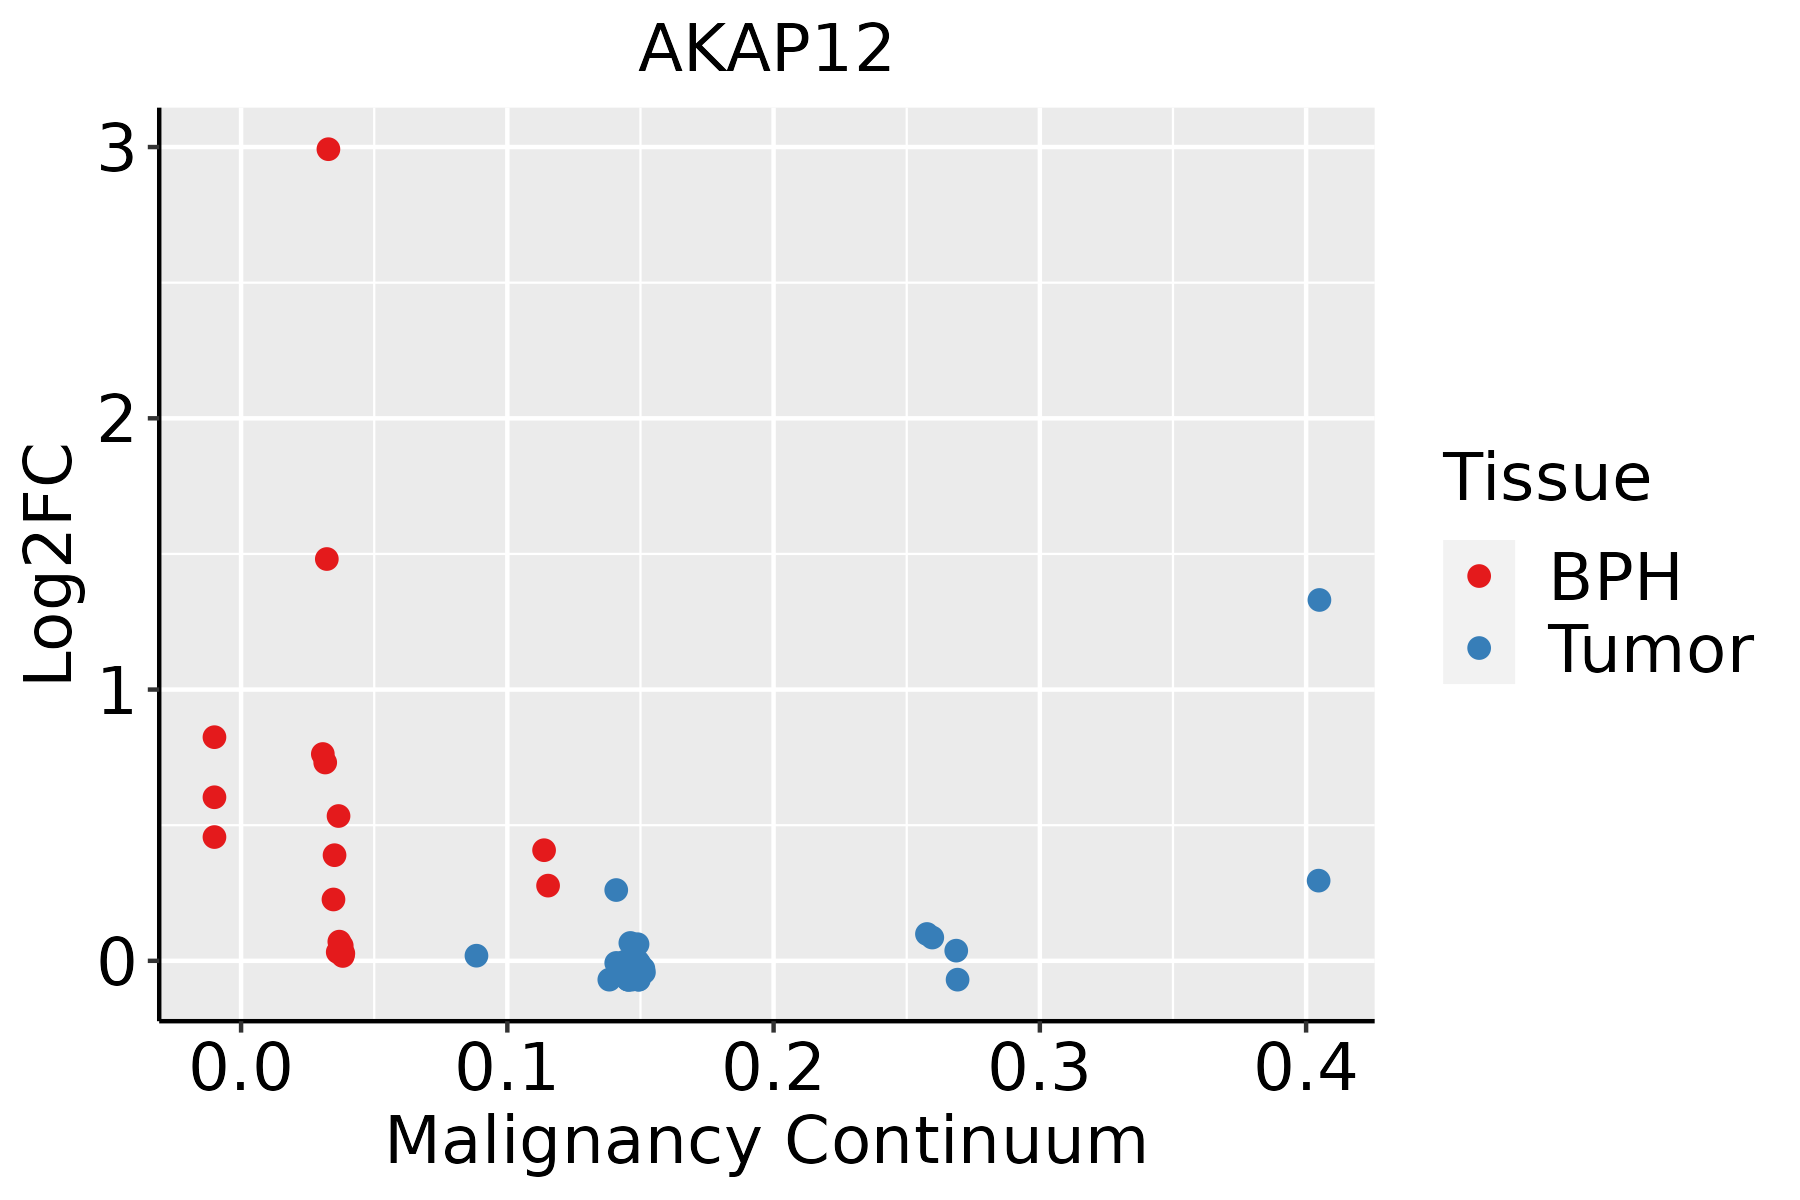 | BPH: Benign Prostatic Hyperplasia |
| Thyroid | 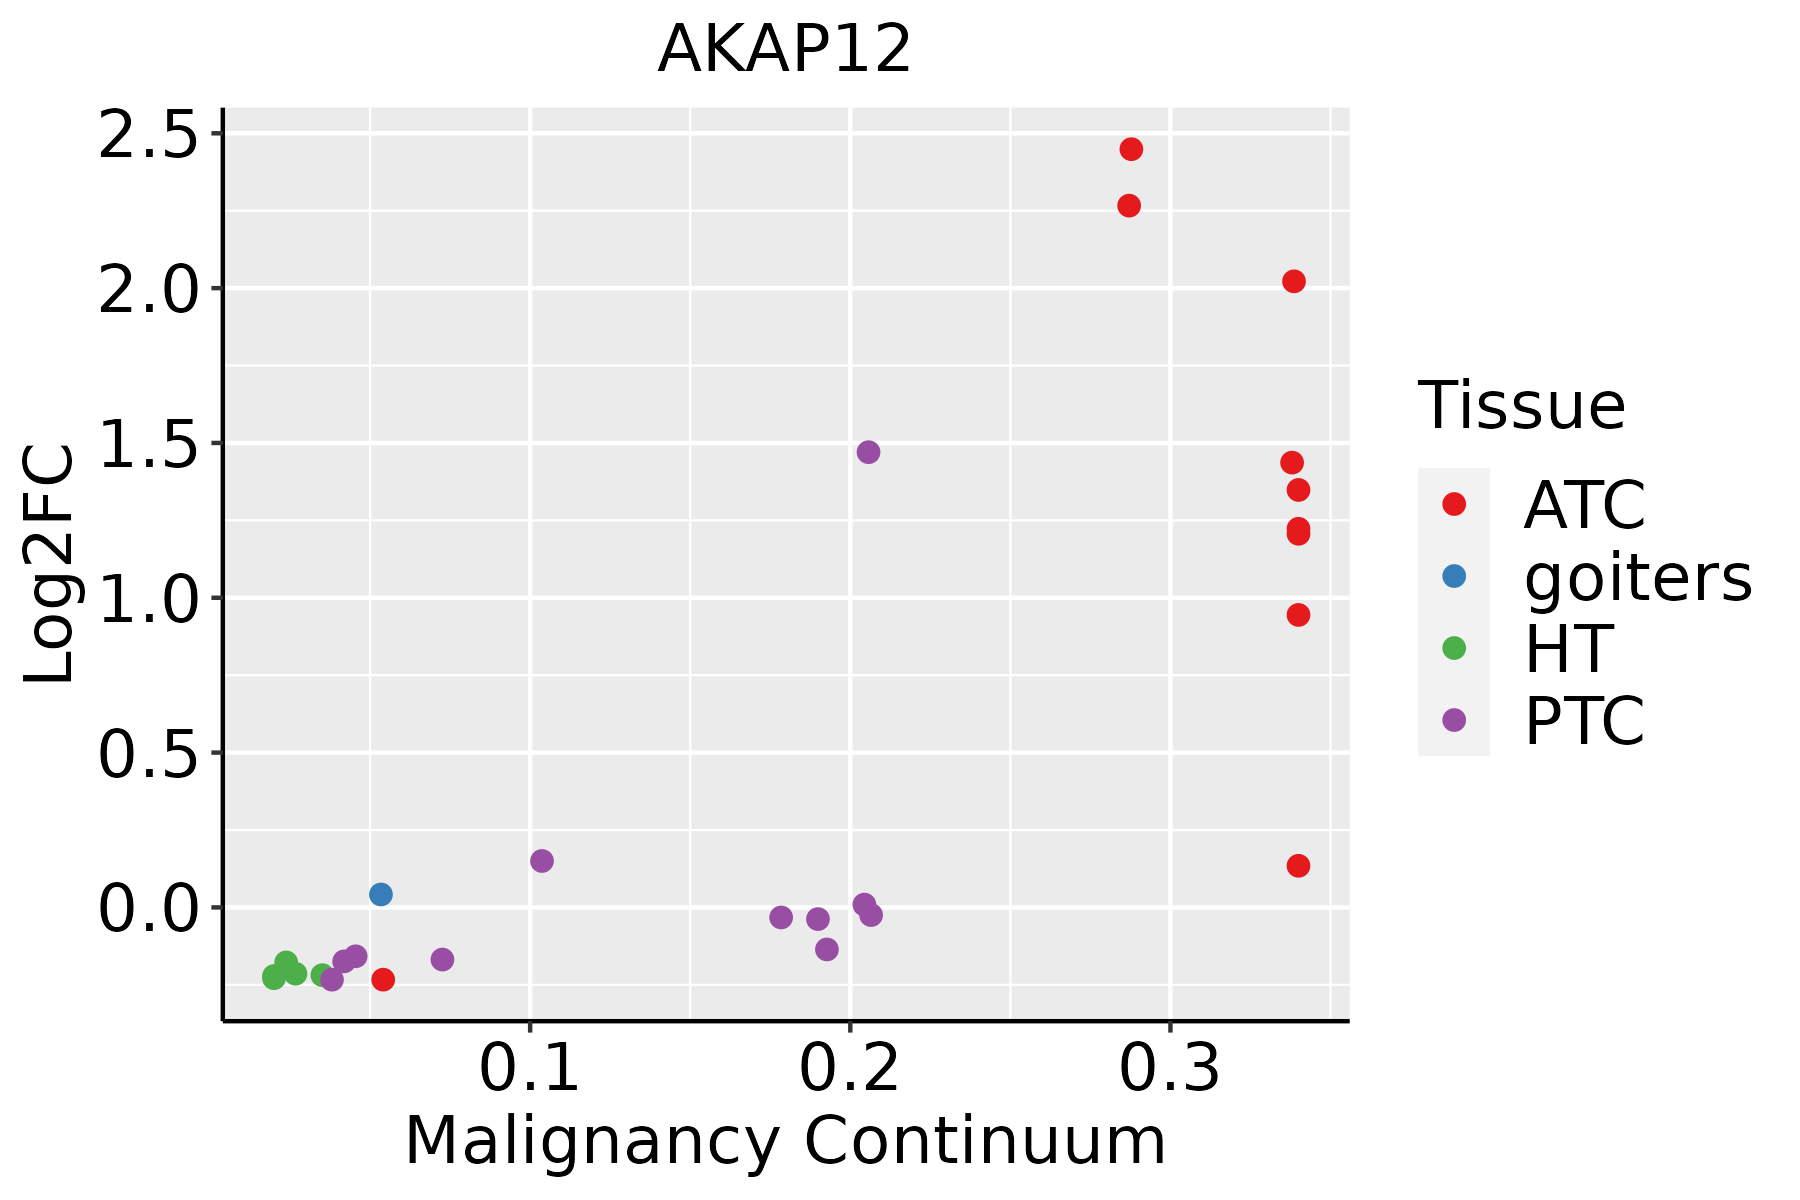 | ATC: Anaplastic thyroid cancer |
| HT: Hashimoto's thyroiditis | ||
| PTC: Papillary thyroid cancer |
| ∗log2FC in expression of this searched gene in stem-like cells from each diseased tissue sample relative to stem-like cells in normal samples in each tissue plotted against the malignancy continuum. Samples are colored based on if they are from different disease stage. |
Top |
Malignant transformation related pathway analysis |
| Find out the enriched GO biological processes and KEGG pathways involved in transition from healthy to precancer to cancer |
| Tissue | Disease Stage | Enriched GO biological Processes |
| Colorectum | AD |  |
| Colorectum | SER |  |
| Colorectum | MSS |  |
| Colorectum | MSI-H |  |
| Colorectum | FAP |  |
| ∗Top 15 enriched GO BP terms are showed in the bar plot of each disease state in each tissue. Each row represents a significant GO biological process which is colored according to the -log10(p.adjust). |
| Page: 1 2 3 4 5 6 7 8 9 |
| GO ID | Tissue | Disease Stage | Description | Gene Ratio | Bg Ratio | pvalue | p.adjust | Count |
| GO:001076121 | Oral cavity | NEOLP | fibroblast migration | 15/2005 | 47/18723 | 7.12e-05 | 9.27e-04 | 15 |
| GO:000181923 | Oral cavity | NEOLP | positive regulation of cytokine production | 73/2005 | 467/18723 | 5.95e-04 | 5.14e-03 | 73 |
| GO:00107631 | Oral cavity | NEOLP | positive regulation of fibroblast migration | 6/2005 | 15/18723 | 3.18e-03 | 1.91e-02 | 6 |
| GO:00107622 | Oral cavity | NEOLP | regulation of fibroblast migration | 10/2005 | 36/18723 | 3.61e-03 | 2.11e-02 | 10 |
| GO:004341013 | Oral cavity | NEOLP | positive regulation of MAPK cascade | 70/2005 | 480/18723 | 4.59e-03 | 2.56e-02 | 70 |
| GO:000166717 | Prostate | BPH | ameboidal-type cell migration | 128/3107 | 475/18723 | 5.69e-09 | 2.05e-07 | 128 |
| GO:003461216 | Prostate | BPH | response to tumor necrosis factor | 68/3107 | 253/18723 | 2.22e-05 | 2.67e-04 | 68 |
| GO:007135616 | Prostate | BPH | cellular response to tumor necrosis factor | 60/3107 | 229/18723 | 1.42e-04 | 1.26e-03 | 60 |
| GO:00434106 | Prostate | BPH | positive regulation of MAPK cascade | 110/3107 | 480/18723 | 1.81e-04 | 1.53e-03 | 110 |
| GO:00018199 | Prostate | BPH | positive regulation of cytokine production | 105/3107 | 467/18723 | 5.18e-04 | 3.66e-03 | 105 |
| GO:00107617 | Prostate | BPH | fibroblast migration | 17/3107 | 47/18723 | 9.41e-04 | 5.94e-03 | 17 |
| GO:0043116 | Prostate | BPH | negative regulation of vascular permeability | 9/3107 | 18/18723 | 1.09e-03 | 6.77e-03 | 9 |
| GO:003249615 | Prostate | BPH | response to lipopolysaccharide | 79/3107 | 343/18723 | 1.18e-03 | 7.29e-03 | 79 |
| GO:000223715 | Prostate | BPH | response to molecule of bacterial origin | 81/3107 | 363/18723 | 2.63e-03 | 1.41e-02 | 81 |
| GO:00703715 | Prostate | BPH | ERK1 and ERK2 cascade | 74/3107 | 330/18723 | 3.43e-03 | 1.76e-02 | 74 |
| GO:000166718 | Prostate | Tumor | ameboidal-type cell migration | 130/3246 | 475/18723 | 2.36e-08 | 8.09e-07 | 130 |
| GO:003461217 | Prostate | Tumor | response to tumor necrosis factor | 66/3246 | 253/18723 | 2.87e-04 | 2.32e-03 | 66 |
| GO:000181914 | Prostate | Tumor | positive regulation of cytokine production | 109/3246 | 467/18723 | 4.98e-04 | 3.67e-03 | 109 |
| GO:007135617 | Prostate | Tumor | cellular response to tumor necrosis factor | 59/3246 | 229/18723 | 8.15e-04 | 5.51e-03 | 59 |
| GO:004341012 | Prostate | Tumor | positive regulation of MAPK cascade | 110/3246 | 480/18723 | 9.41e-04 | 6.18e-03 | 110 |
| Page: 1 2 3 4 5 6 |
| Pathway ID | Tissue | Disease Stage | Description | Gene Ratio | Bg Ratio | pvalue | p.adjust | qvalue | Count |
| Page: 1 |
Top |
Cell-cell communication analysis |
| Identification of potential cell-cell interactions between two cell types and their ligand-receptor pairs for different disease states |
| Ligand | Receptor | LRpair | Pathway | Tissue | Disease Stage |
| Page: 1 |
Top |
Single-cell gene regulatory network inference analysis |
| Find out the significant the regulons (TFs) and the target genes of each regulon across cell types for different disease states |
| TF | Cell Type | Tissue | Disease Stage | Target Gene | RSS | Regulon Activity |
| ∗The dot plots of a searched regulon are shown for all cell subpopulations in each disease state of each tissue based on the regulon specific score inferred using pySCENIC and by calculating the average expression. |
| Page: 1 |
Top |
Somatic mutation of malignant transformation related genes |
| Annotation of somatic variants for genes involved in malignant transformation |
| Hugo Symbol | Variant Class | Variant Classification | dbSNP RS | HGVSc | HGVSp | HGVSp Short | SWISSPROT | BIOTYPE | SIFT | PolyPhen | Tumor Sample Barcode | Tissue | Histology | Sex | Age | Stage | Therapy Types | Drugs | Outcome |
| AKAP12 | SNV | Missense_Mutation | novel | c.1813G>A | p.Glu605Lys | p.E605K | Q02952 | protein_coding | deleterious(0) | probably_damaging(0.996) | TCGA-3C-AALI-01 | Breast | breast invasive carcinoma | Female | <65 | I/II | Unspecific | Poly E | Complete Response |
| AKAP12 | SNV | Missense_Mutation | c.2143G>A | p.Asp715Asn | p.D715N | Q02952 | protein_coding | deleterious(0) | benign(0.397) | TCGA-A2-A0CT-01 | Breast | breast invasive carcinoma | Female | >=65 | I/II | Chemotherapy | cytoxan | SD | |
| AKAP12 | SNV | Missense_Mutation | c.799N>C | p.Glu267Gln | p.E267Q | Q02952 | protein_coding | tolerated(0.26) | possibly_damaging(0.543) | TCGA-A2-A0EY-01 | Breast | breast invasive carcinoma | Female | <65 | I/II | Chemotherapy | adriamycin | SD | |
| AKAP12 | SNV | Missense_Mutation | novel | c.3718G>A | p.Glu1240Lys | p.E1240K | Q02952 | protein_coding | tolerated(0.16) | benign(0.007) | TCGA-A2-A0YD-01 | Breast | breast invasive carcinoma | Female | <65 | I/II | Chemotherapy | cytoxan | SD |
| AKAP12 | SNV | Missense_Mutation | novel | c.830N>A | p.Pro277His | p.P277H | Q02952 | protein_coding | deleterious(0) | possibly_damaging(0.662) | TCGA-A7-A6VW-01 | Breast | breast invasive carcinoma | Female | <65 | I/II | Chemotherapy | doxorubicin | CR |
| AKAP12 | SNV | Missense_Mutation | c.1913N>A | p.Val638Asp | p.V638D | Q02952 | protein_coding | deleterious(0) | possibly_damaging(0.641) | TCGA-A8-A075-01 | Breast | breast invasive carcinoma | Female | <65 | I/II | Chemotherapy | epirubicin | CR | |
| AKAP12 | SNV | Missense_Mutation | c.2130N>G | p.Asp710Glu | p.D710E | Q02952 | protein_coding | tolerated(0.41) | benign(0.003) | TCGA-AO-A128-01 | Breast | breast invasive carcinoma | Female | <65 | I/II | Chemotherapy | doxorubicin | SD | |
| AKAP12 | SNV | Missense_Mutation | novel | c.3154N>C | p.Glu1052Gln | p.E1052Q | Q02952 | protein_coding | tolerated(0.08) | benign(0.184) | TCGA-BH-A0B6-01 | Breast | breast invasive carcinoma | Female | <65 | I/II | Unknown | Unknown | SD |
| AKAP12 | SNV | Missense_Mutation | novel | c.386N>T | p.Ala129Val | p.A129V | Q02952 | protein_coding | tolerated(0.31) | benign(0.006) | TCGA-BH-A0DS-01 | Breast | breast invasive carcinoma | Female | >=65 | III/IV | Chemotherapy | cyclophosphamide | SD |
| AKAP12 | SNV | Missense_Mutation | rs755923718 | c.5335N>T | p.Leu1779Phe | p.L1779F | Q02952 | protein_coding | tolerated_low_confidence(0.12) | benign(0.137) | TCGA-BH-A18Q-01 | Breast | breast invasive carcinoma | Female | <65 | I/II | Unknown | Unknown | SD |
| Page: 1 2 3 4 5 6 7 8 9 10 11 12 13 14 15 16 17 18 19 20 |
Top |
Related drugs of malignant transformation related genes |
| Identification of chemicals and drugs interact with genes involved in malignant transfromation |
| (DGIdb 4.0) |
| Entrez ID | Symbol | Category | Interaction Types | Drug Claim Name | Drug Name | PMIDs |
| Page: 1 |

Copyright 2023-Present -The University of Texas Health Science Center at Houston |