
|
|||||
|
 | |
| |
| |
| |
| |
| |
|
Gene: ADRM1 |
Gene summary for ADRM1 |
| Gene information | Species | Human | Gene symbol | ADRM1 | Gene ID | 11047 |
| Gene name | ADRM1 26S proteasome ubiquitin receptor | |
| Gene Alias | ARM-1 | |
| Cytomap | 20q13.33 | |
| Gene Type | protein-coding | GO ID | GO:0006139 | UniProtAcc | A0A087WX59 |
Top |
Malignant transformation analysis |
| Identification of the aberrant gene expression in precancerous and cancerous lesions by comparing the gene expression of stem-like cells in diseased tissues with normal stem cells |
| Entrez ID | Symbol | Replicates | Species | Organ | Tissue | Adj P-value | Log2FC | Malignancy |
| 11047 | ADRM1 | GSM4909282 | Human | Breast | IDC | 5.22e-06 | 3.11e-01 | -0.0288 |
| 11047 | ADRM1 | GSM4909285 | Human | Breast | IDC | 8.84e-05 | 2.57e-01 | 0.21 |
| 11047 | ADRM1 | GSM4909286 | Human | Breast | IDC | 2.64e-06 | 1.61e-01 | 0.1081 |
| 11047 | ADRM1 | GSM4909296 | Human | Breast | IDC | 7.15e-03 | -2.94e-02 | 0.1524 |
| 11047 | ADRM1 | GSM4909297 | Human | Breast | IDC | 1.08e-09 | -1.43e-01 | 0.1517 |
| 11047 | ADRM1 | GSM4909309 | Human | Breast | IDC | 1.43e-07 | 2.21e-01 | 0.0483 |
| 11047 | ADRM1 | GSM4909311 | Human | Breast | IDC | 5.59e-21 | -2.81e-01 | 0.1534 |
| 11047 | ADRM1 | GSM4909312 | Human | Breast | IDC | 4.09e-06 | -2.79e-02 | 0.1552 |
| 11047 | ADRM1 | GSM4909313 | Human | Breast | IDC | 6.05e-03 | -1.86e-01 | 0.0391 |
| 11047 | ADRM1 | GSM4909317 | Human | Breast | IDC | 1.10e-16 | 5.69e-01 | 0.1355 |
| 11047 | ADRM1 | GSM4909318 | Human | Breast | IDC | 1.75e-16 | 8.33e-01 | 0.2031 |
| 11047 | ADRM1 | GSM4909319 | Human | Breast | IDC | 2.56e-32 | -8.21e-02 | 0.1563 |
| 11047 | ADRM1 | GSM4909320 | Human | Breast | IDC | 1.84e-04 | 9.68e-02 | 0.1575 |
| 11047 | ADRM1 | GSM4909321 | Human | Breast | IDC | 4.84e-13 | 1.63e-01 | 0.1559 |
| 11047 | ADRM1 | brca1 | Human | Breast | Precancer | 2.01e-22 | 6.02e-01 | -0.0338 |
| 11047 | ADRM1 | brca2 | Human | Breast | Precancer | 4.78e-18 | 4.06e-01 | -0.024 |
| 11047 | ADRM1 | brca3 | Human | Breast | Precancer | 3.99e-06 | 3.13e-01 | -0.0263 |
| 11047 | ADRM1 | M2 | Human | Breast | IDC | 2.42e-09 | 5.96e-01 | 0.21 |
| 11047 | ADRM1 | NCCBC14 | Human | Breast | DCIS | 4.87e-04 | -1.68e-01 | 0.2021 |
| 11047 | ADRM1 | NCCBC5 | Human | Breast | DCIS | 6.56e-06 | 1.29e-02 | 0.2046 |
| Page: 1 2 3 4 5 6 7 8 9 |
| Tissue | Expression Dynamics | Abbreviation |
| Breast | 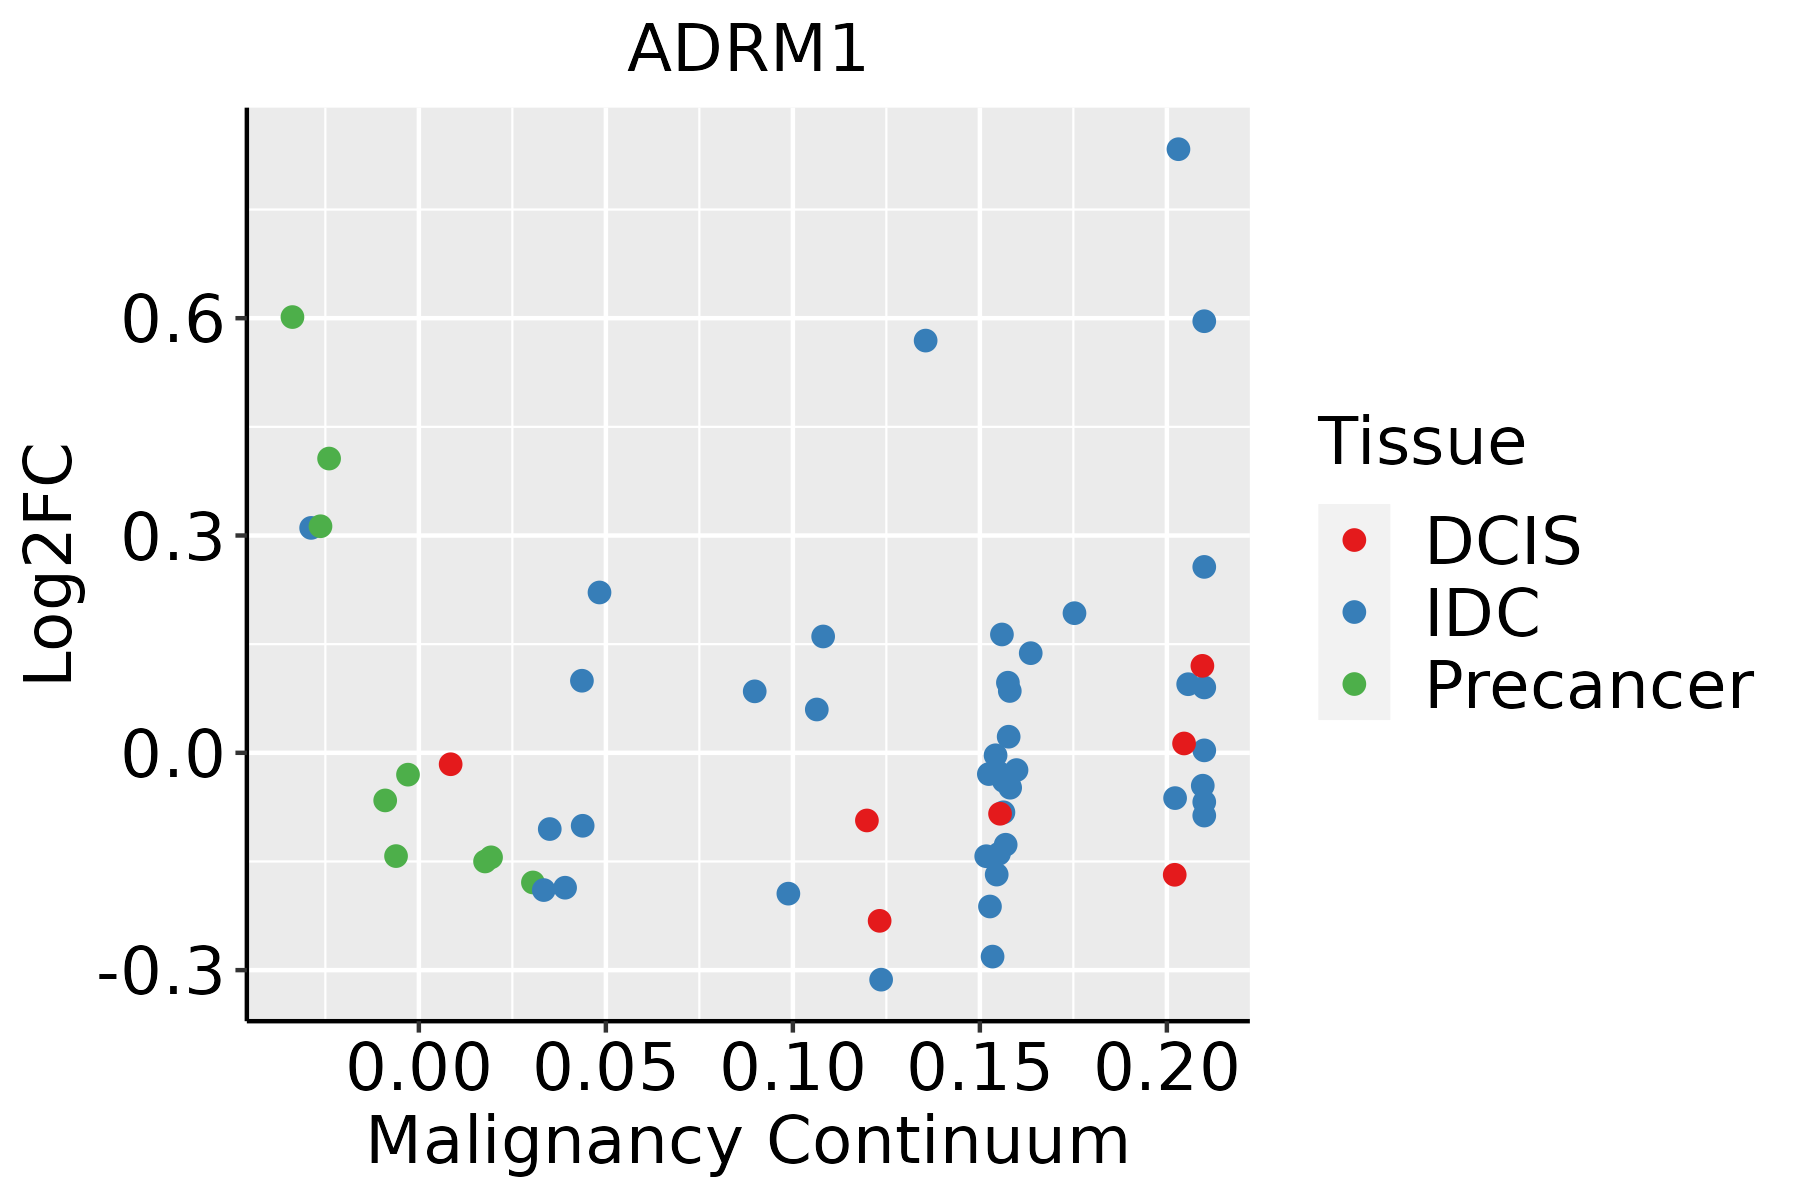 | IDC: Invasive ductal carcinoma |
| DCIS: Ductal carcinoma in situ | ||
| Precancer(BRCA1-mut): Precancerous lesion from BRCA1 mutation carriers | ||
| Esophagus | 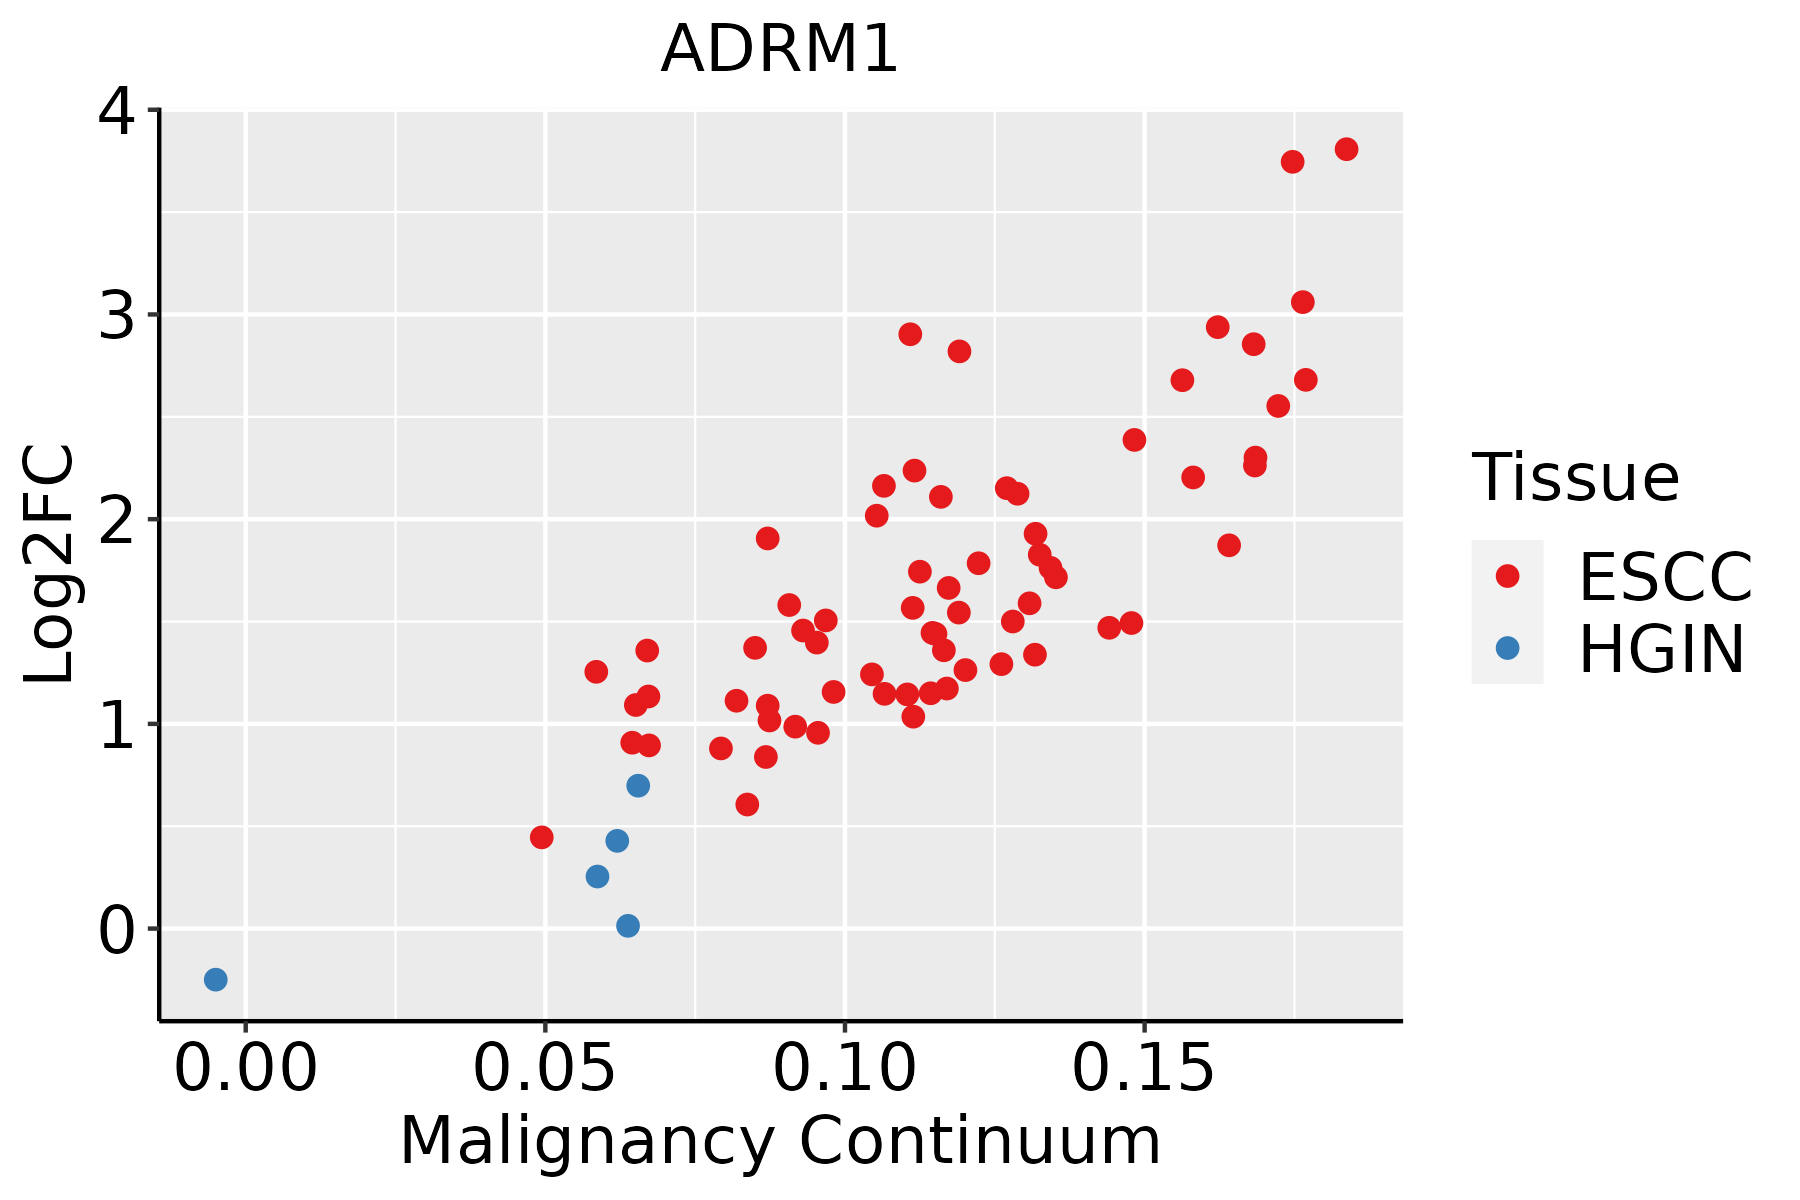 | ESCC: Esophageal squamous cell carcinoma |
| HGIN: High-grade intraepithelial neoplasias | ||
| LGIN: Low-grade intraepithelial neoplasias | ||
| GC | 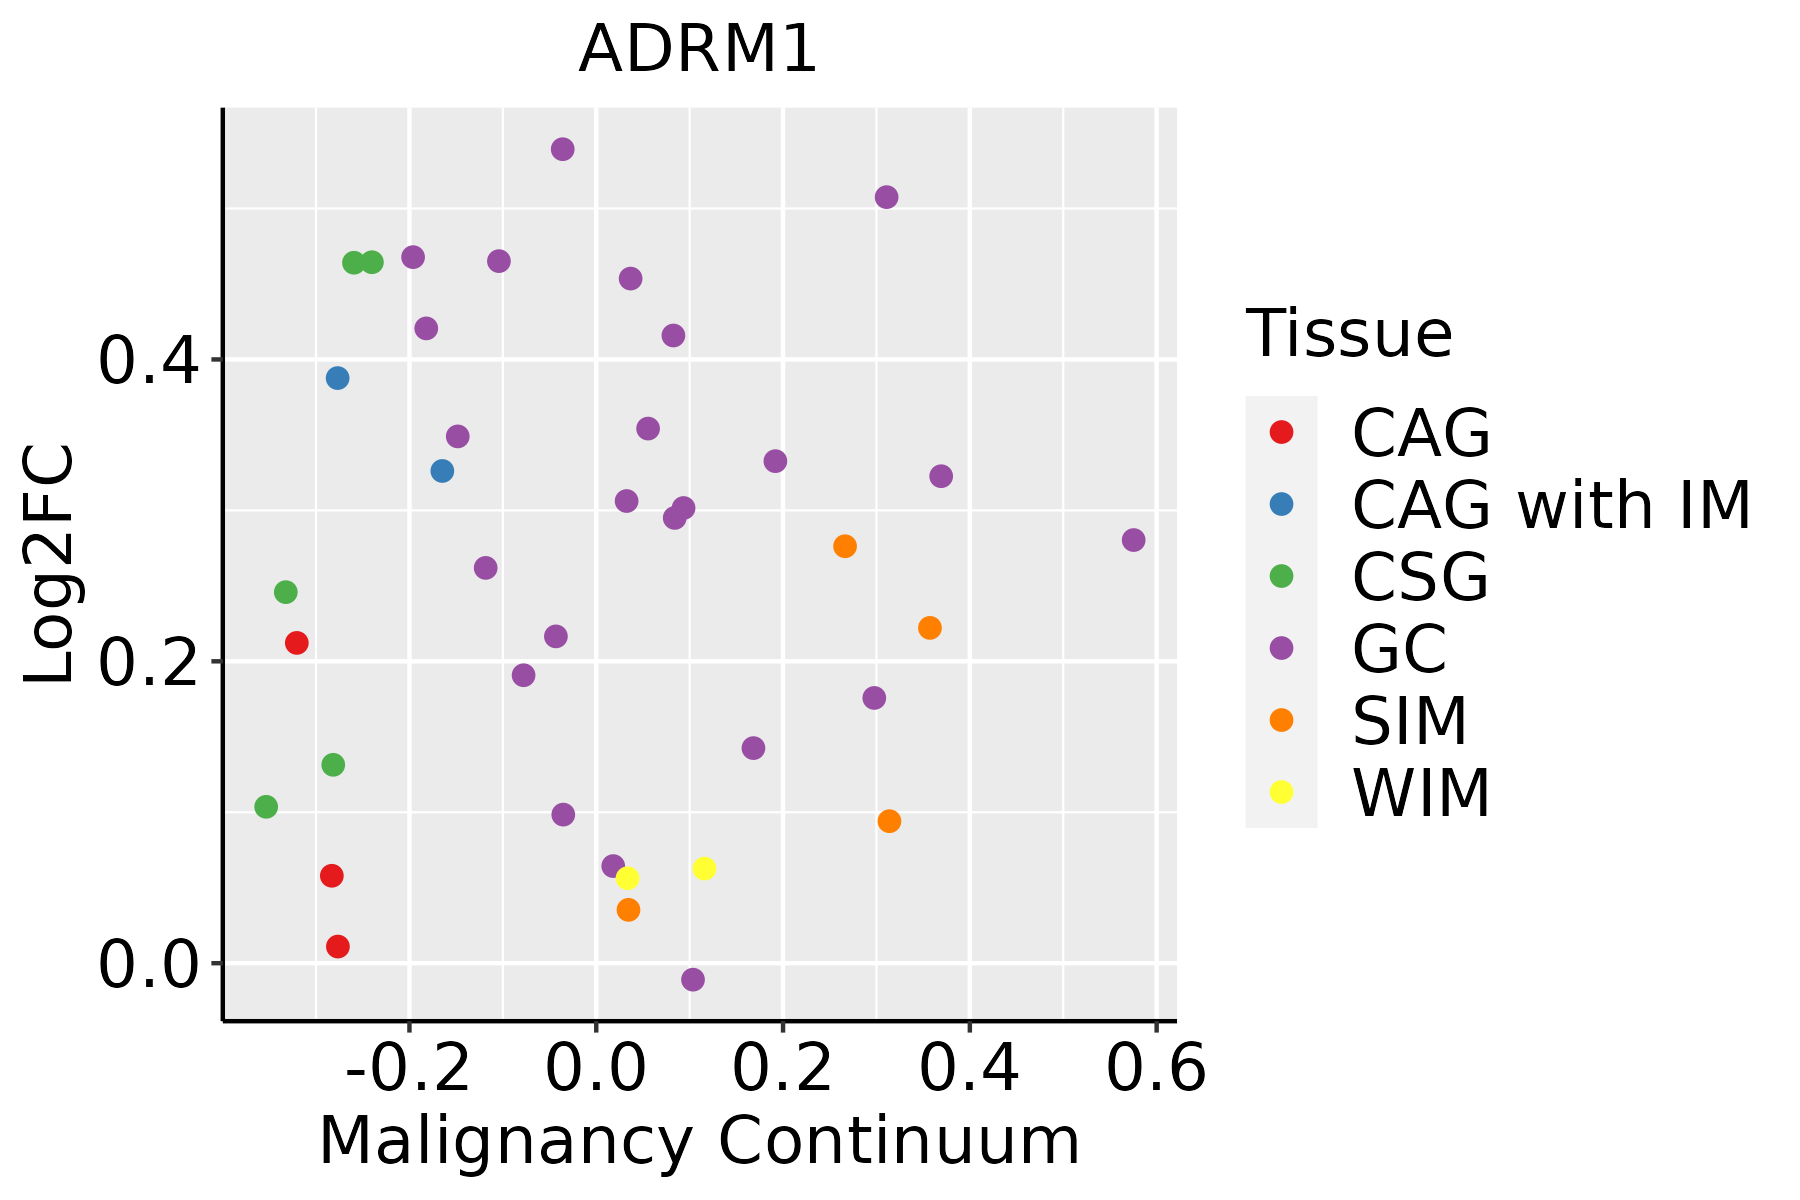 | CAG: Chronic atrophic gastritis |
| CAG with IM: Chronic atrophic gastritis with intestinal metaplasia | ||
| CSG: Chronic superficial gastritis | ||
| GC: Gastric cancer | ||
| SIM: Severe intestinal metaplasia | ||
| WIM: Wild intestinal metaplasia | ||
| Liver |  | HCC: Hepatocellular carcinoma |
| NAFLD: Non-alcoholic fatty liver disease | ||
| Oral Cavity |  | EOLP: Erosive Oral lichen planus |
| LP: leukoplakia | ||
| NEOLP: Non-erosive oral lichen planus | ||
| OSCC: Oral squamous cell carcinoma | ||
| Skin | 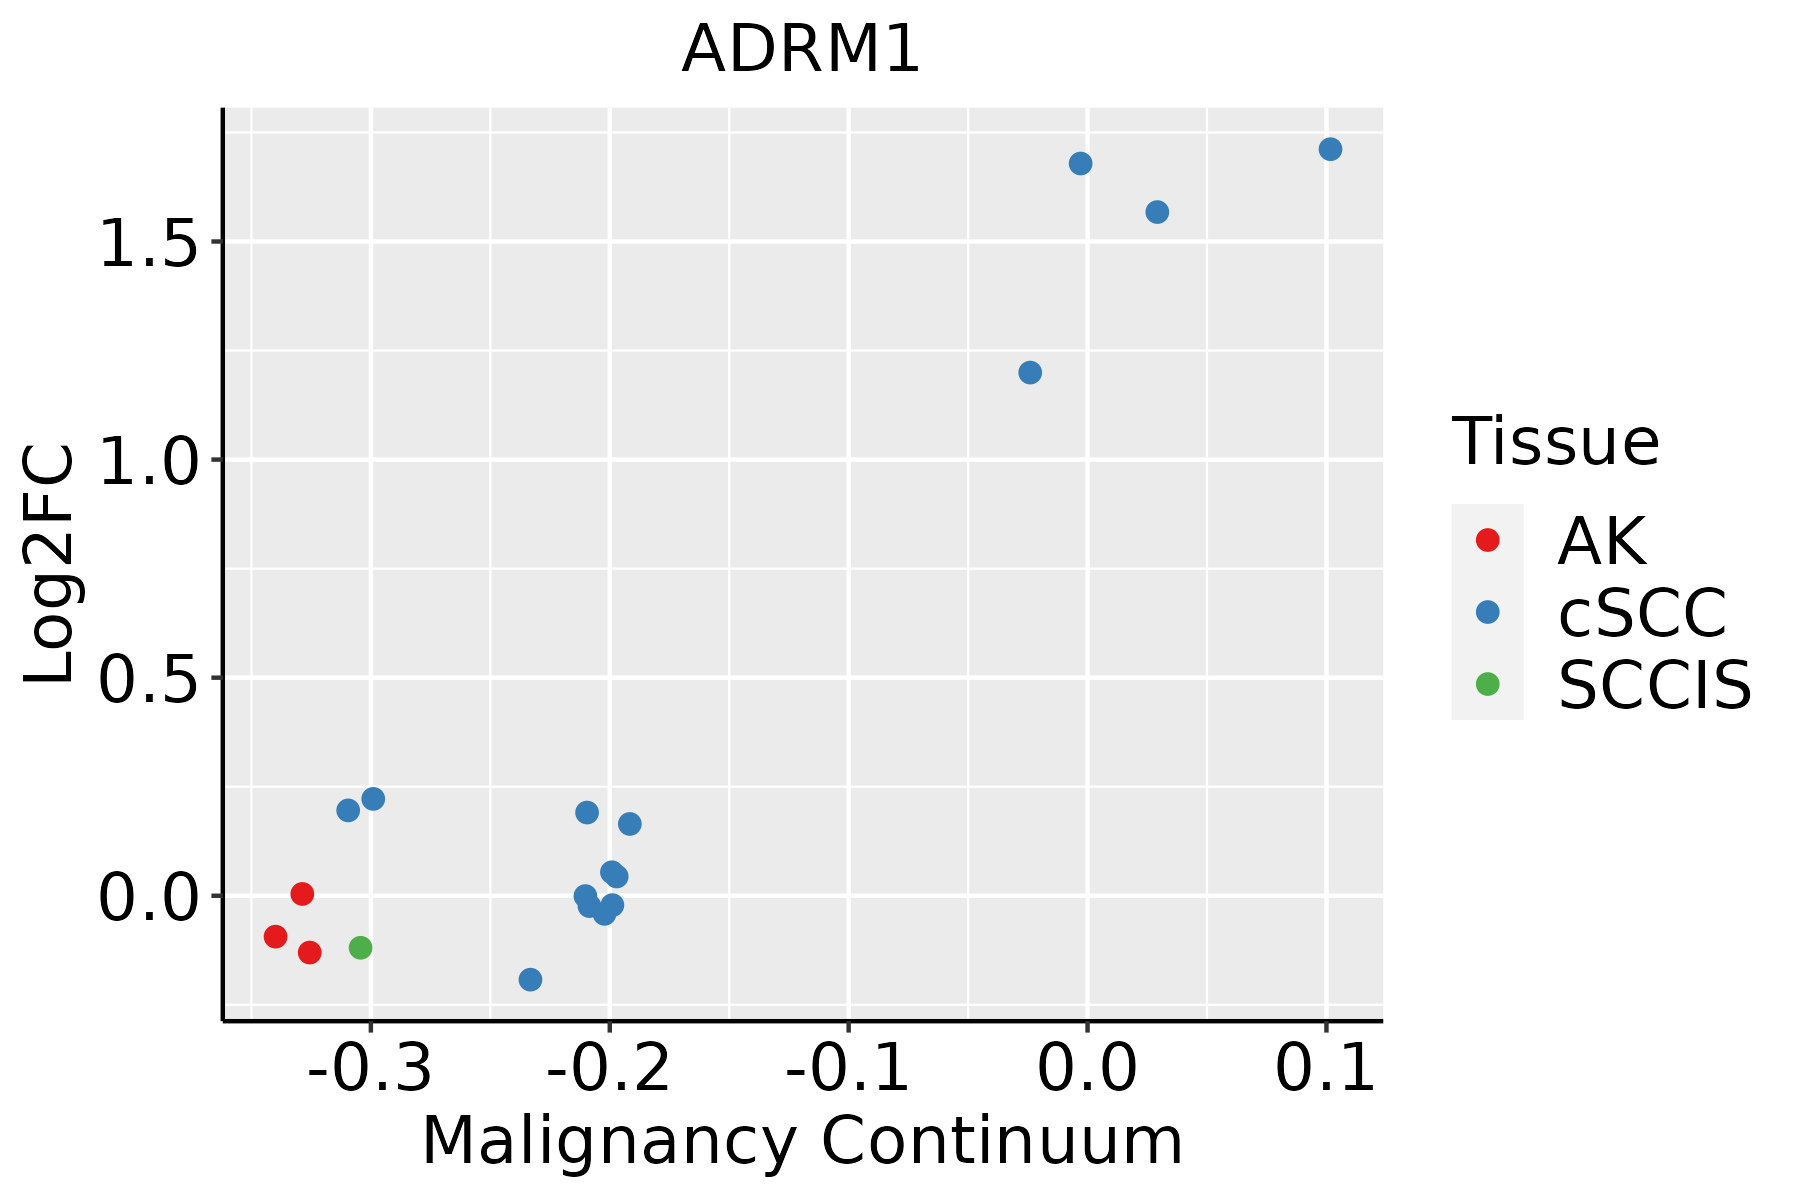 | AK: Actinic keratosis |
| cSCC: Cutaneous squamous cell carcinoma | ||
| SCCIS:squamous cell carcinoma in situ | ||
| Thyroid | 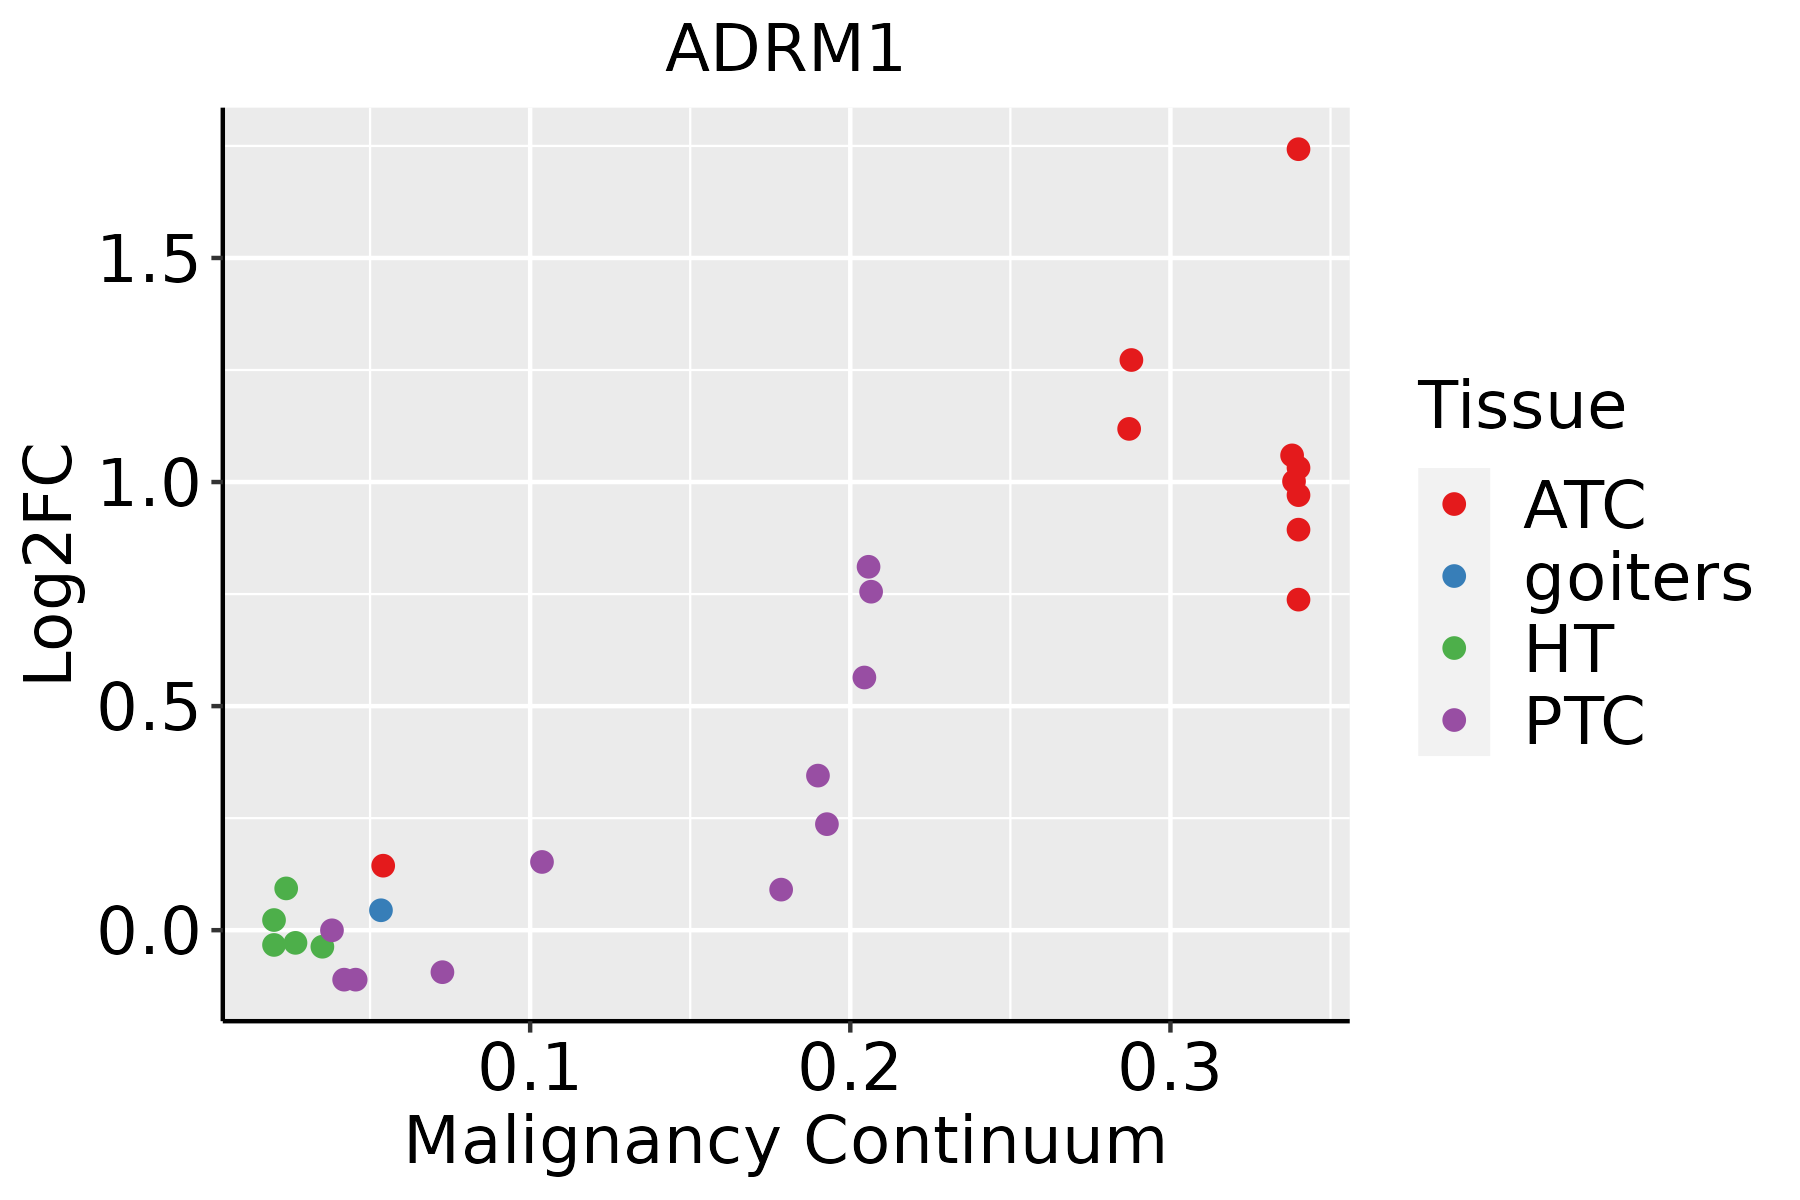 | ATC: Anaplastic thyroid cancer |
| HT: Hashimoto's thyroiditis | ||
| PTC: Papillary thyroid cancer |
| ∗log2FC in expression of this searched gene in stem-like cells from each diseased tissue sample relative to stem-like cells in normal samples in each tissue plotted against the malignancy continuum. Samples are colored based on if they are from different disease stage. |
Top |
Malignant transformation related pathway analysis |
| Find out the enriched GO biological processes and KEGG pathways involved in transition from healthy to precancer to cancer |
| Tissue | Disease Stage | Enriched GO biological Processes |
| Colorectum | AD |  |
| Colorectum | SER |  |
| Colorectum | MSS |  |
| Colorectum | MSI-H |  |
| Colorectum | FAP |  |
| ∗Top 15 enriched GO BP terms are showed in the bar plot of each disease state in each tissue. Each row represents a significant GO biological process which is colored according to the -log10(p.adjust). |
| Page: 1 2 3 4 5 6 7 8 9 |
| GO ID | Tissue | Disease Stage | Description | Gene Ratio | Bg Ratio | pvalue | p.adjust | Count |
| GO:000635413 | Oral cavity | LP | DNA-templated transcription, elongation | 39/4623 | 91/18723 | 1.08e-04 | 1.31e-03 | 39 |
| GO:000636813 | Oral cavity | LP | transcription elongation from RNA polymerase II promoter | 31/4623 | 69/18723 | 1.92e-04 | 2.11e-03 | 31 |
| GO:004586229 | Skin | cSCC | positive regulation of proteolysis | 169/4864 | 372/18723 | 2.43e-16 | 2.21e-14 | 169 |
| GO:005254728 | Skin | cSCC | regulation of peptidase activity | 177/4864 | 461/18723 | 2.21e-09 | 8.02e-08 | 177 |
| GO:005254828 | Skin | cSCC | regulation of endopeptidase activity | 165/4864 | 432/18723 | 1.18e-08 | 3.63e-07 | 165 |
| GO:000635415 | Skin | cSCC | DNA-templated transcription, elongation | 48/4864 | 91/18723 | 4.58e-08 | 1.19e-06 | 48 |
| GO:000636815 | Skin | cSCC | transcription elongation from RNA polymerase II promoter | 39/4864 | 69/18723 | 7.15e-08 | 1.78e-06 | 39 |
| GO:001095227 | Skin | cSCC | positive regulation of peptidase activity | 85/4864 | 197/18723 | 1.14e-07 | 2.69e-06 | 85 |
| GO:0010950112 | Skin | cSCC | positive regulation of endopeptidase activity | 74/4864 | 179/18723 | 4.98e-06 | 7.25e-05 | 74 |
| GO:00432484 | Skin | cSCC | proteasome assembly | 10/4864 | 12/18723 | 5.36e-05 | 5.38e-04 | 10 |
| GO:00525476 | Stomach | GC | regulation of peptidase activity | 67/1159 | 461/18723 | 5.35e-11 | 1.10e-08 | 67 |
| GO:00525486 | Stomach | GC | regulation of endopeptidase activity | 63/1159 | 432/18723 | 1.76e-10 | 2.82e-08 | 63 |
| GO:00458626 | Stomach | GC | positive regulation of proteolysis | 44/1159 | 372/18723 | 2.81e-05 | 7.88e-04 | 44 |
| GO:00109526 | Stomach | GC | positive regulation of peptidase activity | 27/1159 | 197/18723 | 8.57e-05 | 1.79e-03 | 27 |
| GO:00109506 | Stomach | GC | positive regulation of endopeptidase activity | 24/1159 | 179/18723 | 2.90e-04 | 4.67e-03 | 24 |
| GO:005254711 | Stomach | CAG with IM | regulation of peptidase activity | 61/1050 | 461/18723 | 3.60e-10 | 6.00e-08 | 61 |
| GO:005254811 | Stomach | CAG with IM | regulation of endopeptidase activity | 58/1050 | 432/18723 | 5.62e-10 | 8.56e-08 | 58 |
| GO:004586211 | Stomach | CAG with IM | positive regulation of proteolysis | 41/1050 | 372/18723 | 2.85e-05 | 7.99e-04 | 41 |
| GO:001095211 | Stomach | CAG with IM | positive regulation of peptidase activity | 24/1050 | 197/18723 | 2.89e-04 | 4.99e-03 | 24 |
| GO:001095011 | Stomach | CAG with IM | positive regulation of endopeptidase activity | 22/1050 | 179/18723 | 4.50e-04 | 6.95e-03 | 22 |
| Page: 1 2 3 4 5 6 |
| Pathway ID | Tissue | Disease Stage | Description | Gene Ratio | Bg Ratio | pvalue | p.adjust | qvalue | Count |
| hsa0501218 | Breast | Precancer | Parkinson disease | 99/684 | 266/8465 | 3.58e-42 | 5.65e-40 | 4.33e-40 | 99 |
| hsa0502016 | Breast | Precancer | Prion disease | 95/684 | 273/8465 | 1.39e-37 | 1.46e-35 | 1.12e-35 | 95 |
| hsa0501616 | Breast | Precancer | Huntington disease | 98/684 | 306/8465 | 2.85e-35 | 2.25e-33 | 1.72e-33 | 98 |
| hsa0501016 | Breast | Precancer | Alzheimer disease | 103/684 | 384/8465 | 1.03e-29 | 4.66e-28 | 3.57e-28 | 103 |
| hsa0501416 | Breast | Precancer | Amyotrophic lateral sclerosis | 98/684 | 364/8465 | 2.13e-28 | 8.41e-27 | 6.44e-27 | 98 |
| hsa0502216 | Breast | Precancer | Pathways of neurodegeneration - multiple diseases | 112/684 | 476/8465 | 6.96e-27 | 2.44e-25 | 1.87e-25 | 112 |
| hsa0305010 | Breast | Precancer | Proteasome | 25/684 | 46/8465 | 4.35e-16 | 9.81e-15 | 7.52e-15 | 25 |
| hsa0501714 | Breast | Precancer | Spinocerebellar ataxia | 29/684 | 143/8465 | 2.79e-06 | 3.83e-05 | 2.94e-05 | 29 |
| hsa0516918 | Breast | Precancer | Epstein-Barr virus infection | 35/684 | 202/8465 | 1.15e-05 | 1.26e-04 | 9.64e-05 | 35 |
| hsa0501219 | Breast | Precancer | Parkinson disease | 99/684 | 266/8465 | 3.58e-42 | 5.65e-40 | 4.33e-40 | 99 |
| hsa0502017 | Breast | Precancer | Prion disease | 95/684 | 273/8465 | 1.39e-37 | 1.46e-35 | 1.12e-35 | 95 |
| hsa0501617 | Breast | Precancer | Huntington disease | 98/684 | 306/8465 | 2.85e-35 | 2.25e-33 | 1.72e-33 | 98 |
| hsa0501017 | Breast | Precancer | Alzheimer disease | 103/684 | 384/8465 | 1.03e-29 | 4.66e-28 | 3.57e-28 | 103 |
| hsa0501417 | Breast | Precancer | Amyotrophic lateral sclerosis | 98/684 | 364/8465 | 2.13e-28 | 8.41e-27 | 6.44e-27 | 98 |
| hsa0502217 | Breast | Precancer | Pathways of neurodegeneration - multiple diseases | 112/684 | 476/8465 | 6.96e-27 | 2.44e-25 | 1.87e-25 | 112 |
| hsa0305013 | Breast | Precancer | Proteasome | 25/684 | 46/8465 | 4.35e-16 | 9.81e-15 | 7.52e-15 | 25 |
| hsa0501715 | Breast | Precancer | Spinocerebellar ataxia | 29/684 | 143/8465 | 2.79e-06 | 3.83e-05 | 2.94e-05 | 29 |
| hsa0516919 | Breast | Precancer | Epstein-Barr virus infection | 35/684 | 202/8465 | 1.15e-05 | 1.26e-04 | 9.64e-05 | 35 |
| hsa0501224 | Breast | IDC | Parkinson disease | 107/867 | 266/8465 | 2.57e-39 | 8.36e-37 | 6.26e-37 | 107 |
| hsa0502023 | Breast | IDC | Prion disease | 102/867 | 273/8465 | 3.70e-34 | 4.01e-32 | 3.00e-32 | 102 |
| Page: 1 2 3 4 5 6 7 8 |
Top |
Cell-cell communication analysis |
| Identification of potential cell-cell interactions between two cell types and their ligand-receptor pairs for different disease states |
| Ligand | Receptor | LRpair | Pathway | Tissue | Disease Stage |
| Page: 1 |
Top |
Single-cell gene regulatory network inference analysis |
| Find out the significant the regulons (TFs) and the target genes of each regulon across cell types for different disease states |
| TF | Cell Type | Tissue | Disease Stage | Target Gene | RSS | Regulon Activity |
| ∗The dot plots of a searched regulon are shown for all cell subpopulations in each disease state of each tissue based on the regulon specific score inferred using pySCENIC and by calculating the average expression. |
| Page: 1 |
Top |
Somatic mutation of malignant transformation related genes |
| Annotation of somatic variants for genes involved in malignant transformation |
| Hugo Symbol | Variant Class | Variant Classification | dbSNP RS | HGVSc | HGVSp | HGVSp Short | SWISSPROT | BIOTYPE | SIFT | PolyPhen | Tumor Sample Barcode | Tissue | Histology | Sex | Age | Stage | Therapy Types | Drugs | Outcome |
| ADRM1 | SNV | Missense_Mutation | c.382C>G | p.Leu128Val | p.L128V | Q16186 | protein_coding | deleterious(0) | probably_damaging(0.918) | TCGA-AC-A23H-01 | Breast | breast invasive carcinoma | Female | >=65 | I/II | Unknown | Unknown | PD | |
| ADRM1 | SNV | Missense_Mutation | rs752123074 | c.430N>A | p.Gly144Ser | p.G144S | Q16186 | protein_coding | tolerated(0.12) | probably_damaging(0.995) | TCGA-2W-A8YY-01 | Cervix | cervical & endocervical cancer | Female | <65 | I/II | Chemotherapy | cisplatin | CR |
| ADRM1 | SNV | Missense_Mutation | novel | c.978N>C | p.Glu326Asp | p.E326D | Q16186 | protein_coding | deleterious(0.05) | possibly_damaging(0.704) | TCGA-C5-A905-01 | Cervix | cervical & endocervical cancer | Female | <65 | I/II | Unknown | Unknown | SD |
| ADRM1 | SNV | Missense_Mutation | c.489N>A | p.Met163Ile | p.M163I | Q16186 | protein_coding | deleterious(0) | benign(0.007) | TCGA-DR-A0ZM-01 | Cervix | cervical & endocervical cancer | Female | <65 | III/IV | Unspecific | Cisplatin | SD | |
| ADRM1 | SNV | Missense_Mutation | c.656N>T | p.Ser219Leu | p.S219L | Q16186 | protein_coding | tolerated(0.09) | benign(0.357) | TCGA-Q1-A73O-01 | Cervix | cervical & endocervical cancer | Female | <65 | I/II | Chemotherapy | cisplatin | CR | |
| ADRM1 | SNV | Missense_Mutation | rs369505590 | c.446N>T | p.Ala149Val | p.A149V | Q16186 | protein_coding | tolerated(0.11) | possibly_damaging(0.887) | TCGA-VS-A8EL-01 | Cervix | cervical & endocervical cancer | Female | <65 | I/II | Chemotherapy | cisplatin | CR |
| ADRM1 | SNV | Missense_Mutation | c.1112N>T | p.Lys371Met | p.K371M | Q16186 | protein_coding | deleterious(0.01) | probably_damaging(0.994) | TCGA-AD-A5EJ-01 | Colorectum | colon adenocarcinoma | Female | >=65 | I/II | Unknown | Unknown | SD | |
| ADRM1 | SNV | Missense_Mutation | c.814N>T | p.Ala272Ser | p.A272S | Q16186 | protein_coding | tolerated(1) | benign(0.156) | TCGA-D5-6540-01 | Colorectum | colon adenocarcinoma | Male | >=65 | I/II | Unknown | Unknown | SD | |
| ADRM1 | SNV | Missense_Mutation | c.847G>T | p.Gly283Cys | p.G283C | Q16186 | protein_coding | deleterious(0.01) | benign(0.166) | TCGA-EI-6507-01 | Colorectum | rectum adenocarcinoma | Male | <65 | I/II | Unknown | Unknown | SD | |
| ADRM1 | insertion | Frame_Shift_Ins | novel | c.*1_*4dupGCCA | Q16186 | protein_coding | TCGA-CK-5913-01 | Colorectum | colon adenocarcinoma | Female | <65 | I/II | Unknown | Unknown | SD |
| Page: 1 2 3 4 |
Top |
Related drugs of malignant transformation related genes |
| Identification of chemicals and drugs interact with genes involved in malignant transfromation |
| (DGIdb 4.0) |
| Entrez ID | Symbol | Category | Interaction Types | Drug Claim Name | Drug Name | PMIDs |
| 11047 | ADRM1 | ENZYME | BORTEZOMIB | BORTEZOMIB | 24524217 | |
| 11047 | ADRM1 | ENZYME | inhibitor | CHEMBL3545432 | IXAZOMIB CITRATE | |
| 11047 | ADRM1 | ENZYME | CARFILZOMIB | CARFILZOMIB | 24524217 | |
| 11047 | ADRM1 | ENZYME | inhibitor | CHEMBL451887 | CARFILZOMIB | |
| 11047 | ADRM1 | ENZYME | inhibitor | CHEMBL325041 | BORTEZOMIB | |
| 11047 | ADRM1 | ENZYME | inhibitor | CHEMBL2103884 | OPROZOMIB |
| Page: 1 |

Copyright 2023-Present -The University of Texas Health Science Center at Houston |