
|
|||||
|
 | |
| |
| |
| |
| |
| |
|
Gene: ADAMTS1 |
Gene summary for ADAMTS1 |
| Gene information | Species | Human | Gene symbol | ADAMTS1 | Gene ID | 9510 |
| Gene name | ADAM metallopeptidase with thrombospondin type 1 motif 1 | |
| Gene Alias | C3-C5 | |
| Cytomap | 21q21.3 | |
| Gene Type | protein-coding | GO ID | GO:0000003 | UniProtAcc | B2RB33 |
Top |
Malignant transformation analysis |
| Identification of the aberrant gene expression in precancerous and cancerous lesions by comparing the gene expression of stem-like cells in diseased tissues with normal stem cells |
| Entrez ID | Symbol | Replicates | Species | Organ | Tissue | Adj P-value | Log2FC | Malignancy |
| 9510 | ADAMTS1 | CA_HPV_3 | Human | Cervix | CC | 3.92e-06 | 1.95e-01 | 0.0414 |
| 9510 | ADAMTS1 | T1 | Human | Cervix | CC | 1.57e-03 | 2.41e-01 | 0.0918 |
| 9510 | ADAMTS1 | T2 | Human | Cervix | CC | 1.35e-04 | 3.95e-01 | 0.0709 |
| 9510 | ADAMTS1 | AEH-subject1 | Human | Endometrium | AEH | 1.27e-18 | 5.15e-01 | -0.3059 |
| 9510 | ADAMTS1 | AEH-subject2 | Human | Endometrium | AEH | 6.07e-06 | 3.34e-01 | -0.2525 |
| 9510 | ADAMTS1 | AEH-subject3 | Human | Endometrium | AEH | 5.30e-05 | 2.65e-01 | -0.2576 |
| 9510 | ADAMTS1 | AEH-subject4 | Human | Endometrium | AEH | 2.36e-02 | 2.88e-01 | -0.2657 |
| 9510 | ADAMTS1 | EEC-subject1 | Human | Endometrium | EEC | 4.85e-06 | 2.77e-01 | -0.2682 |
| 9510 | ADAMTS1 | EEC-subject2 | Human | Endometrium | EEC | 3.90e-05 | 2.70e-01 | -0.2607 |
| 9510 | ADAMTS1 | EEC-subject3 | Human | Endometrium | EEC | 1.30e-02 | 1.45e-01 | -0.2525 |
| 9510 | ADAMTS1 | GSM6177620_NYU_UCEC1_lib1_lib1 | Human | Endometrium | EEC | 9.84e-08 | 3.00e-01 | -0.1869 |
| 9510 | ADAMTS1 | GSM6177620_NYU_UCEC1_lib2_lib2 | Human | Endometrium | EEC | 5.06e-10 | 4.37e-01 | -0.1875 |
| 9510 | ADAMTS1 | GSM6177620_NYU_UCEC1_lib3_lib3 | Human | Endometrium | EEC | 3.86e-05 | 1.78e-01 | -0.1883 |
| 9510 | ADAMTS1 | GSM6177621_NYU_UCEC2_lib1_lib1 | Human | Endometrium | EEC | 4.97e-06 | 2.54e-01 | -0.1934 |
| 9510 | ADAMTS1 | GSM6177622_NYU_UCEC3_lib1_lib1 | Human | Endometrium | EEC | 4.63e-16 | 3.94e-01 | -0.1917 |
| 9510 | ADAMTS1 | GSM6177622_NYU_UCEC3_lib2_lib2 | Human | Endometrium | EEC | 9.96e-12 | 3.15e-01 | -0.1916 |
| 9510 | ADAMTS1 | GSM6177623_NYU_UCEC3_Vis | Human | Endometrium | EEC | 1.80e-48 | 9.79e-01 | -0.1269 |
| 9510 | ADAMTS1 | LZE7T | Human | Esophagus | ESCC | 2.99e-02 | 8.19e-01 | 0.0667 |
| 9510 | ADAMTS1 | P10T-E | Human | Esophagus | ESCC | 4.20e-09 | -6.88e-02 | 0.116 |
| 9510 | ADAMTS1 | P11T-E | Human | Esophagus | ESCC | 2.57e-03 | 1.42e+00 | 0.1426 |
| Page: 1 2 3 |
| Tissue | Expression Dynamics | Abbreviation |
| Cervix | 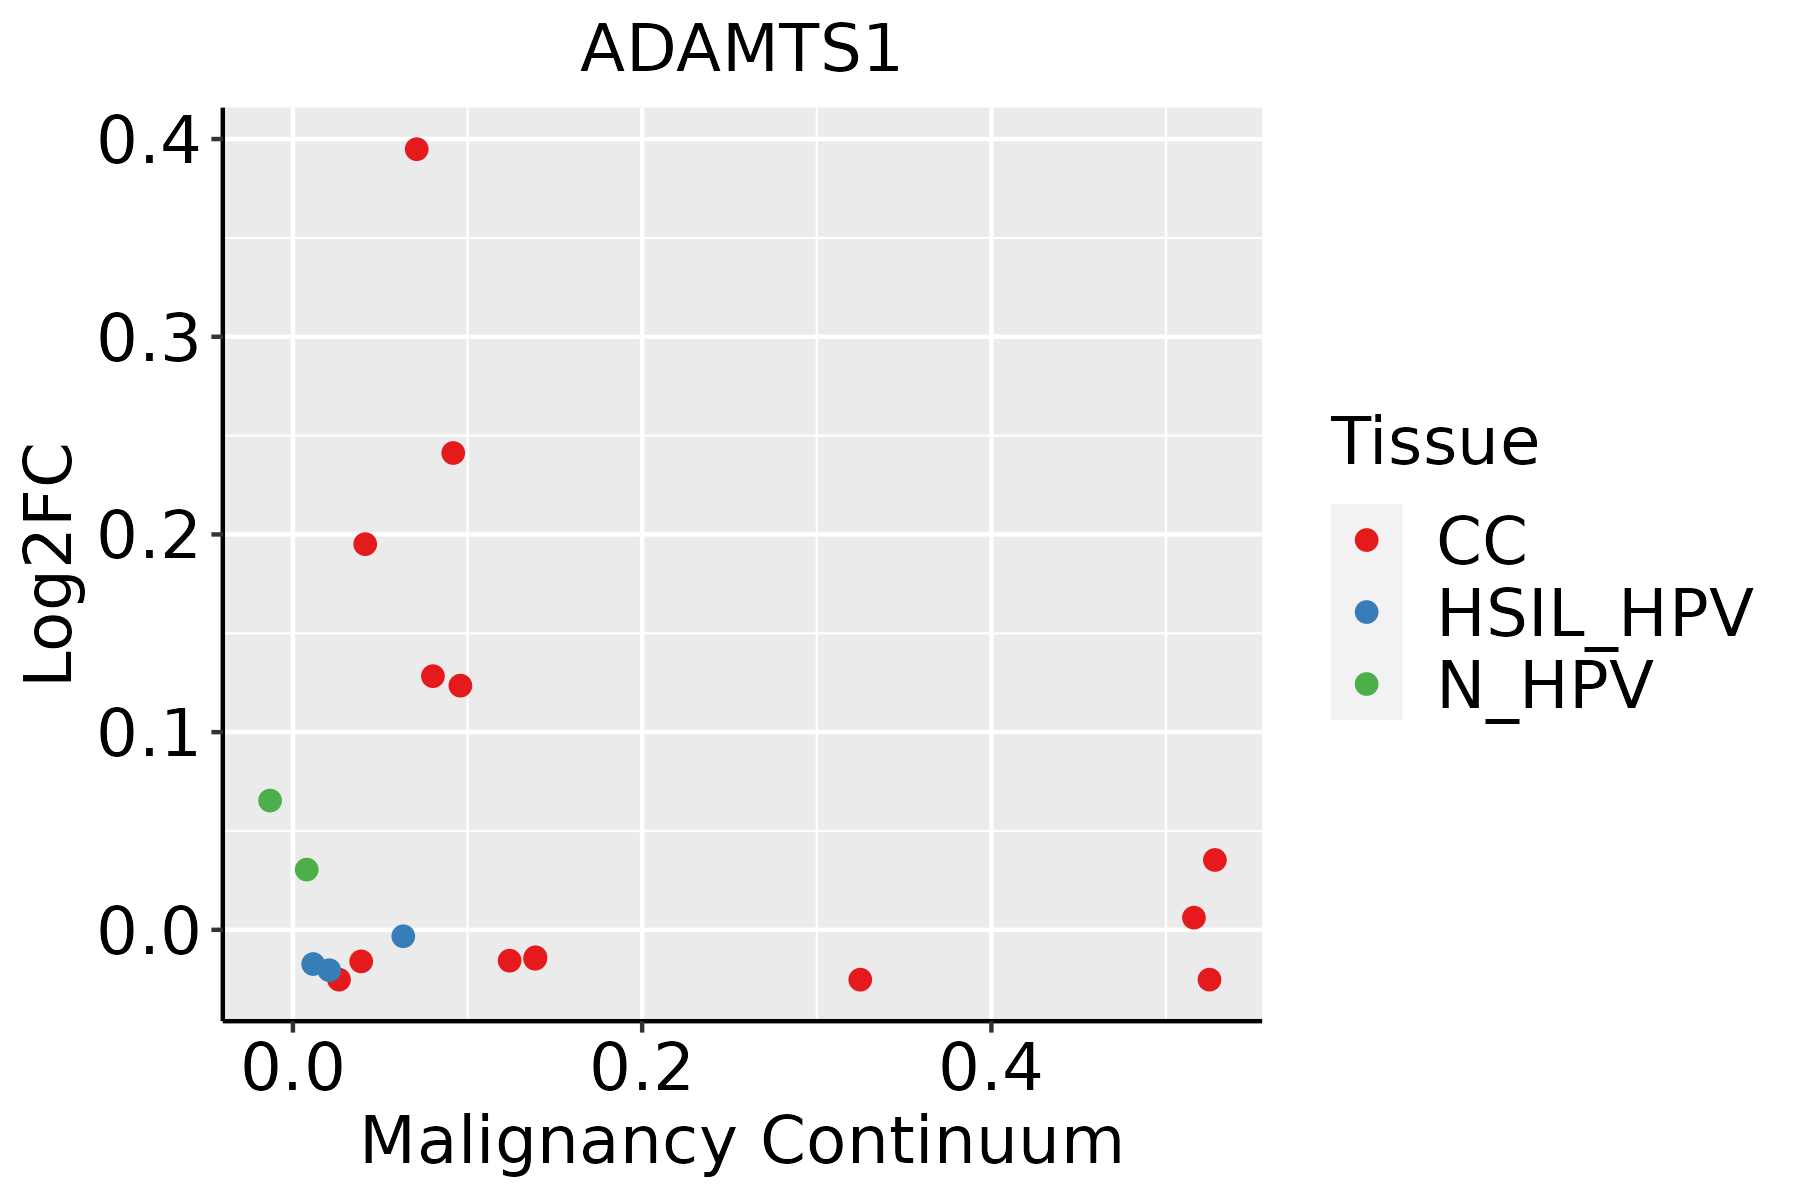 | CC: Cervix cancer |
| HSIL_HPV: HPV-infected high-grade squamous intraepithelial lesions | ||
| N_HPV: HPV-infected normal cervix | ||
| Endometrium |  | AEH: Atypical endometrial hyperplasia |
| EEC: Endometrioid Cancer | ||
| Esophagus |  | ESCC: Esophageal squamous cell carcinoma |
| HGIN: High-grade intraepithelial neoplasias | ||
| LGIN: Low-grade intraepithelial neoplasias | ||
| Oral Cavity |  | EOLP: Erosive Oral lichen planus |
| LP: leukoplakia | ||
| NEOLP: Non-erosive oral lichen planus | ||
| OSCC: Oral squamous cell carcinoma | ||
| Prostate |  | BPH: Benign Prostatic Hyperplasia |
| Thyroid |  | ATC: Anaplastic thyroid cancer |
| HT: Hashimoto's thyroiditis | ||
| PTC: Papillary thyroid cancer |
| ∗log2FC in expression of this searched gene in stem-like cells from each diseased tissue sample relative to stem-like cells in normal samples in each tissue plotted against the malignancy continuum. Samples are colored based on if they are from different disease stage. |
Top |
Malignant transformation related pathway analysis |
| Find out the enriched GO biological processes and KEGG pathways involved in transition from healthy to precancer to cancer |
| Tissue | Disease Stage | Enriched GO biological Processes |
| Colorectum | AD |  |
| Colorectum | SER |  |
| Colorectum | MSS |  |
| Colorectum | MSI-H |  |
| Colorectum | FAP |  |
| ∗Top 15 enriched GO BP terms are showed in the bar plot of each disease state in each tissue. Each row represents a significant GO biological process which is colored according to the -log10(p.adjust). |
| Page: 1 2 3 4 5 6 7 8 9 |
| GO ID | Tissue | Disease Stage | Description | Gene Ratio | Bg Ratio | pvalue | p.adjust | Count |
| GO:000722914 | Endometrium | EEC | integrin-mediated signaling pathway | 32/2168 | 107/18723 | 2.58e-07 | 1.10e-05 | 32 |
| GO:000165512 | Endometrium | EEC | urogenital system development | 69/2168 | 338/18723 | 1.70e-06 | 5.18e-05 | 69 |
| GO:007200112 | Endometrium | EEC | renal system development | 63/2168 | 302/18723 | 2.24e-06 | 6.59e-05 | 63 |
| GO:004866013 | Endometrium | EEC | regulation of smooth muscle cell proliferation | 43/2168 | 180/18723 | 2.54e-06 | 7.35e-05 | 43 |
| GO:004865913 | Endometrium | EEC | smooth muscle cell proliferation | 43/2168 | 184/18723 | 4.65e-06 | 1.16e-04 | 43 |
| GO:000182212 | Endometrium | EEC | kidney development | 59/2168 | 293/18723 | 1.44e-05 | 2.87e-04 | 59 |
| GO:00330021 | Endometrium | EEC | muscle cell proliferation | 50/2168 | 248/18723 | 6.08e-05 | 9.21e-04 | 50 |
| GO:004578713 | Endometrium | EEC | positive regulation of cell cycle | 59/2168 | 313/18723 | 1.04e-04 | 1.44e-03 | 59 |
| GO:00426981 | Endometrium | EEC | ovulation cycle | 19/2168 | 68/18723 | 1.84e-04 | 2.26e-03 | 19 |
| GO:00465451 | Endometrium | EEC | development of primary female sexual characteristics | 24/2168 | 100/18723 | 3.66e-04 | 3.95e-03 | 24 |
| GO:00085851 | Endometrium | EEC | female gonad development | 23/2168 | 95/18723 | 4.20e-04 | 4.40e-03 | 23 |
| GO:00466601 | Endometrium | EEC | female sex differentiation | 26/2168 | 114/18723 | 4.99e-04 | 5.05e-03 | 26 |
| GO:004477213 | Endometrium | EEC | mitotic cell cycle phase transition | 71/2168 | 424/18723 | 8.68e-04 | 7.97e-03 | 71 |
| GO:009006812 | Endometrium | EEC | positive regulation of cell cycle process | 44/2168 | 236/18723 | 9.39e-04 | 8.42e-03 | 44 |
| GO:00030071 | Endometrium | EEC | heart morphogenesis | 45/2168 | 246/18723 | 1.24e-03 | 1.03e-02 | 45 |
| GO:004866111 | Endometrium | EEC | positive regulation of smooth muscle cell proliferation | 23/2168 | 104/18723 | 1.59e-03 | 1.27e-02 | 23 |
| GO:00075481 | Endometrium | EEC | sex differentiation | 48/2168 | 276/18723 | 2.58e-03 | 1.87e-02 | 48 |
| GO:004593113 | Endometrium | EEC | positive regulation of mitotic cell cycle | 25/2168 | 121/18723 | 2.76e-03 | 1.97e-02 | 25 |
| GO:0022602 | Endometrium | EEC | ovulation cycle process | 12/2168 | 45/18723 | 4.18e-03 | 2.73e-02 | 12 |
| GO:004513711 | Endometrium | EEC | development of primary sexual characteristics | 40/2168 | 227/18723 | 4.43e-03 | 2.86e-02 | 40 |
| Page: 1 2 3 4 5 6 7 8 9 10 11 12 13 14 15 16 17 18 19 |
| Pathway ID | Tissue | Disease Stage | Description | Gene Ratio | Bg Ratio | pvalue | p.adjust | qvalue | Count |
| Page: 1 |
Top |
Cell-cell communication analysis |
| Identification of potential cell-cell interactions between two cell types and their ligand-receptor pairs for different disease states |
| Ligand | Receptor | LRpair | Pathway | Tissue | Disease Stage |
| Page: 1 |
Top |
Single-cell gene regulatory network inference analysis |
| Find out the significant the regulons (TFs) and the target genes of each regulon across cell types for different disease states |
| TF | Cell Type | Tissue | Disease Stage | Target Gene | RSS | Regulon Activity |
| ∗The dot plots of a searched regulon are shown for all cell subpopulations in each disease state of each tissue based on the regulon specific score inferred using pySCENIC and by calculating the average expression. |
| Page: 1 |
Top |
Somatic mutation of malignant transformation related genes |
| Annotation of somatic variants for genes involved in malignant transformation |
| Hugo Symbol | Variant Class | Variant Classification | dbSNP RS | HGVSc | HGVSp | HGVSp Short | SWISSPROT | BIOTYPE | SIFT | PolyPhen | Tumor Sample Barcode | Tissue | Histology | Sex | Age | Stage | Therapy Types | Drugs | Outcome |
| ADAMTS1 | SNV | Missense_Mutation | novel | c.1879N>A | p.Glu627Lys | p.E627K | Q9UHI8 | protein_coding | deleterious(0.01) | possibly_damaging(0.621) | TCGA-5L-AAT1-01 | Breast | breast invasive carcinoma | Female | <65 | III/IV | Hormone Therapy | letrozol | SD |
| ADAMTS1 | SNV | Missense_Mutation | novel | c.2556N>G | p.Ile852Met | p.I852M | Q9UHI8 | protein_coding | deleterious(0.01) | probably_damaging(0.943) | TCGA-A2-A4S1-01 | Breast | breast invasive carcinoma | Female | >=65 | I/II | Unknown | Unknown | SD |
| ADAMTS1 | SNV | Missense_Mutation | c.2215N>A | p.His739Asn | p.H739N | Q9UHI8 | protein_coding | tolerated(1) | benign(0.005) | TCGA-A8-A09X-01 | Breast | breast invasive carcinoma | Female | <65 | III/IV | Unknown | Unknown | SD | |
| ADAMTS1 | SNV | Missense_Mutation | c.1718N>C | p.Arg573Thr | p.R573T | Q9UHI8 | protein_coding | deleterious(0) | probably_damaging(0.999) | TCGA-AR-A0TX-01 | Breast | breast invasive carcinoma | Female | <65 | I/II | Unknown | Unknown | SD | |
| ADAMTS1 | SNV | Missense_Mutation | c.1766N>G | p.Pro589Arg | p.P589R | Q9UHI8 | protein_coding | deleterious(0) | probably_damaging(1) | TCGA-C8-A26Y-01 | Breast | breast invasive carcinoma | Female | >=65 | I/II | Unknown | Unknown | SD | |
| ADAMTS1 | SNV | Missense_Mutation | novel | c.2134N>C | p.Asp712His | p.D712H | Q9UHI8 | protein_coding | deleterious(0) | probably_damaging(0.977) | TCGA-LD-A74U-01 | Breast | breast invasive carcinoma | Female | >=65 | III/IV | Chemotherapy | taxotere | SD |
| ADAMTS1 | SNV | Missense_Mutation | novel | c.2492C>T | p.Ala831Val | p.A831V | Q9UHI8 | protein_coding | tolerated(0.6) | benign(0.021) | TCGA-LL-A6FP-01 | Breast | breast invasive carcinoma | Female | >=65 | I/II | Hormone Therapy | arimidex | SD |
| ADAMTS1 | insertion | In_Frame_Ins | novel | c.1509_1510insTTTTCAAACAATTTTTGTTATACT | p.Ala503_Ser504insPheSerAsnAsnPheCysTyrThr | p.A503_S504insFSNNFCYT | Q9UHI8 | protein_coding | TCGA-A8-A06P-01 | Breast | breast invasive carcinoma | Female | <65 | III/IV | Unspecific | SD | |||
| ADAMTS1 | insertion | Nonsense_Mutation | novel | c.2665_2666insATGTAGGCAATGGTGATAGTTGAGGTTGT | p.Ala889AspfsTer8 | p.A889Dfs*8 | Q9UHI8 | protein_coding | TCGA-A8-A0A2-01 | Breast | breast invasive carcinoma | Female | >=65 | I/II | Hormone Therapy | tamoxiphen | SD | ||
| ADAMTS1 | insertion | Frame_Shift_Ins | novel | c.1717_1718insCCTGG | p.Arg573ThrfsTer13 | p.R573Tfs*13 | Q9UHI8 | protein_coding | TCGA-BH-A0HF-01 | Breast | breast invasive carcinoma | Female | >=65 | I/II | Hormone Therapy | arimidex | SD |
| Page: 1 2 3 4 5 6 7 8 9 10 11 12 13 14 |
Top |
Related drugs of malignant transformation related genes |
| Identification of chemicals and drugs interact with genes involved in malignant transfromation |
| (DGIdb 4.0) |
| Entrez ID | Symbol | Category | Interaction Types | Drug Claim Name | Drug Name | PMIDs |
| 9510 | ADAMTS1 | ENZYME, NEUTRAL ZINC METALLOPEPTIDASE, DRUGGABLE GENOME, PROTEASE | inhibitor | 252166863 | ||
| 9510 | ADAMTS1 | ENZYME, NEUTRAL ZINC METALLOPEPTIDASE, DRUGGABLE GENOME, PROTEASE | pravastatin | PRAVASTATIN | 18174457 | |
| 9510 | ADAMTS1 | ENZYME, NEUTRAL ZINC METALLOPEPTIDASE, DRUGGABLE GENOME, PROTEASE | hmg coa reductase inhibitors | 21037509 |
| Page: 1 |

Copyright 2023-Present -The University of Texas Health Science Center at Houston |