
|
|||||
|
 | |
| |
| |
| |
| |
| |
|
Gene: PLK2 |
Gene summary for PLK2 |
| Gene information | Species | Human | Gene symbol | PLK2 | Gene ID | 10769 |
| Gene name | polo like kinase 2 | |
| Gene Alias | SNK | |
| Cytomap | 5q11.2 | |
| Gene Type | protein-coding | GO ID | GO:0000075 | UniProtAcc | A0A087WUH9 |
Top |
Malignant transformation analysis |
| Identification of the aberrant gene expression in precancerous and cancerous lesions by comparing the gene expression of stem-like cells in diseased tissues with normal stem cells |
| Entrez ID | Symbol | Replicates | Species | Organ | Tissue | Adj P-value | Log2FC | Malignancy |
| 10769 | PLK2 | GSM4909282 | Human | Breast | IDC | 9.91e-08 | -3.64e-01 | -0.0288 |
| 10769 | PLK2 | GSM4909286 | Human | Breast | IDC | 2.91e-10 | -3.50e-01 | 0.1081 |
| 10769 | PLK2 | GSM4909287 | Human | Breast | IDC | 7.37e-05 | -3.57e-01 | 0.2057 |
| 10769 | PLK2 | GSM4909290 | Human | Breast | IDC | 6.21e-06 | -4.22e-01 | 0.2096 |
| 10769 | PLK2 | GSM4909291 | Human | Breast | IDC | 5.67e-04 | -4.08e-01 | 0.1753 |
| 10769 | PLK2 | GSM4909293 | Human | Breast | IDC | 3.94e-05 | -2.94e-01 | 0.1581 |
| 10769 | PLK2 | GSM4909296 | Human | Breast | IDC | 1.56e-17 | -4.40e-01 | 0.1524 |
| 10769 | PLK2 | GSM4909297 | Human | Breast | IDC | 3.60e-07 | -1.64e-01 | 0.1517 |
| 10769 | PLK2 | GSM4909301 | Human | Breast | IDC | 1.24e-02 | -2.20e-01 | 0.1577 |
| 10769 | PLK2 | GSM4909302 | Human | Breast | IDC | 3.63e-12 | -4.58e-01 | 0.1545 |
| 10769 | PLK2 | GSM4909304 | Human | Breast | IDC | 1.33e-16 | -4.74e-01 | 0.1636 |
| 10769 | PLK2 | GSM4909306 | Human | Breast | IDC | 3.31e-11 | -3.84e-01 | 0.1564 |
| 10769 | PLK2 | GSM4909309 | Human | Breast | IDC | 5.46e-07 | -4.12e-01 | 0.0483 |
| 10769 | PLK2 | GSM4909311 | Human | Breast | IDC | 1.71e-29 | -5.29e-01 | 0.1534 |
| 10769 | PLK2 | GSM4909312 | Human | Breast | IDC | 6.64e-24 | -5.14e-01 | 0.1552 |
| 10769 | PLK2 | GSM4909315 | Human | Breast | IDC | 4.51e-10 | -3.55e-01 | 0.21 |
| 10769 | PLK2 | GSM4909316 | Human | Breast | IDC | 1.18e-02 | -4.54e-01 | 0.21 |
| 10769 | PLK2 | GSM4909317 | Human | Breast | IDC | 1.77e-07 | -4.23e-01 | 0.1355 |
| 10769 | PLK2 | GSM4909318 | Human | Breast | IDC | 4.75e-04 | -5.54e-01 | 0.2031 |
| 10769 | PLK2 | GSM4909319 | Human | Breast | IDC | 2.92e-30 | -5.30e-01 | 0.1563 |
| Page: 1 2 3 4 5 6 7 8 |
| Tissue | Expression Dynamics | Abbreviation |
| Breast | 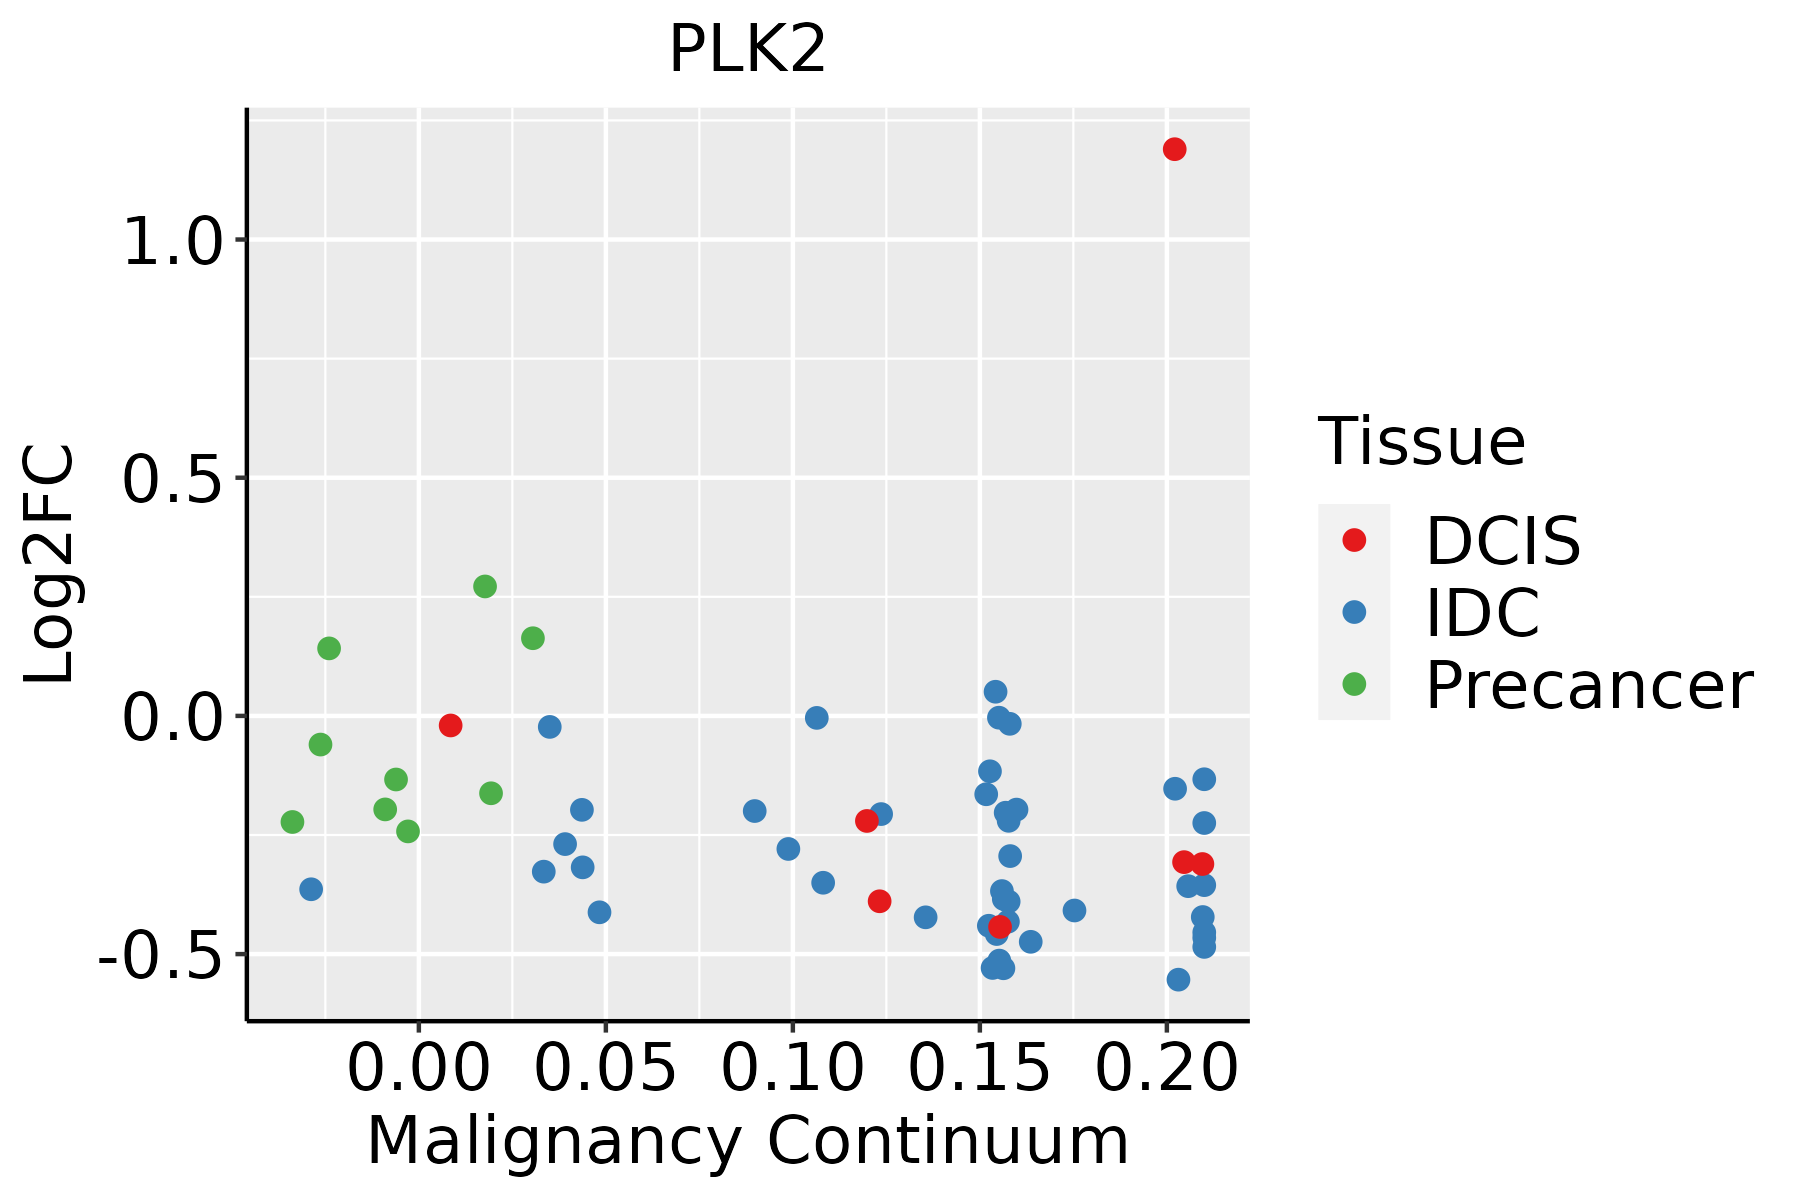 | IDC: Invasive ductal carcinoma |
| DCIS: Ductal carcinoma in situ | ||
| Precancer(BRCA1-mut): Precancerous lesion from BRCA1 mutation carriers | ||
| Esophagus | 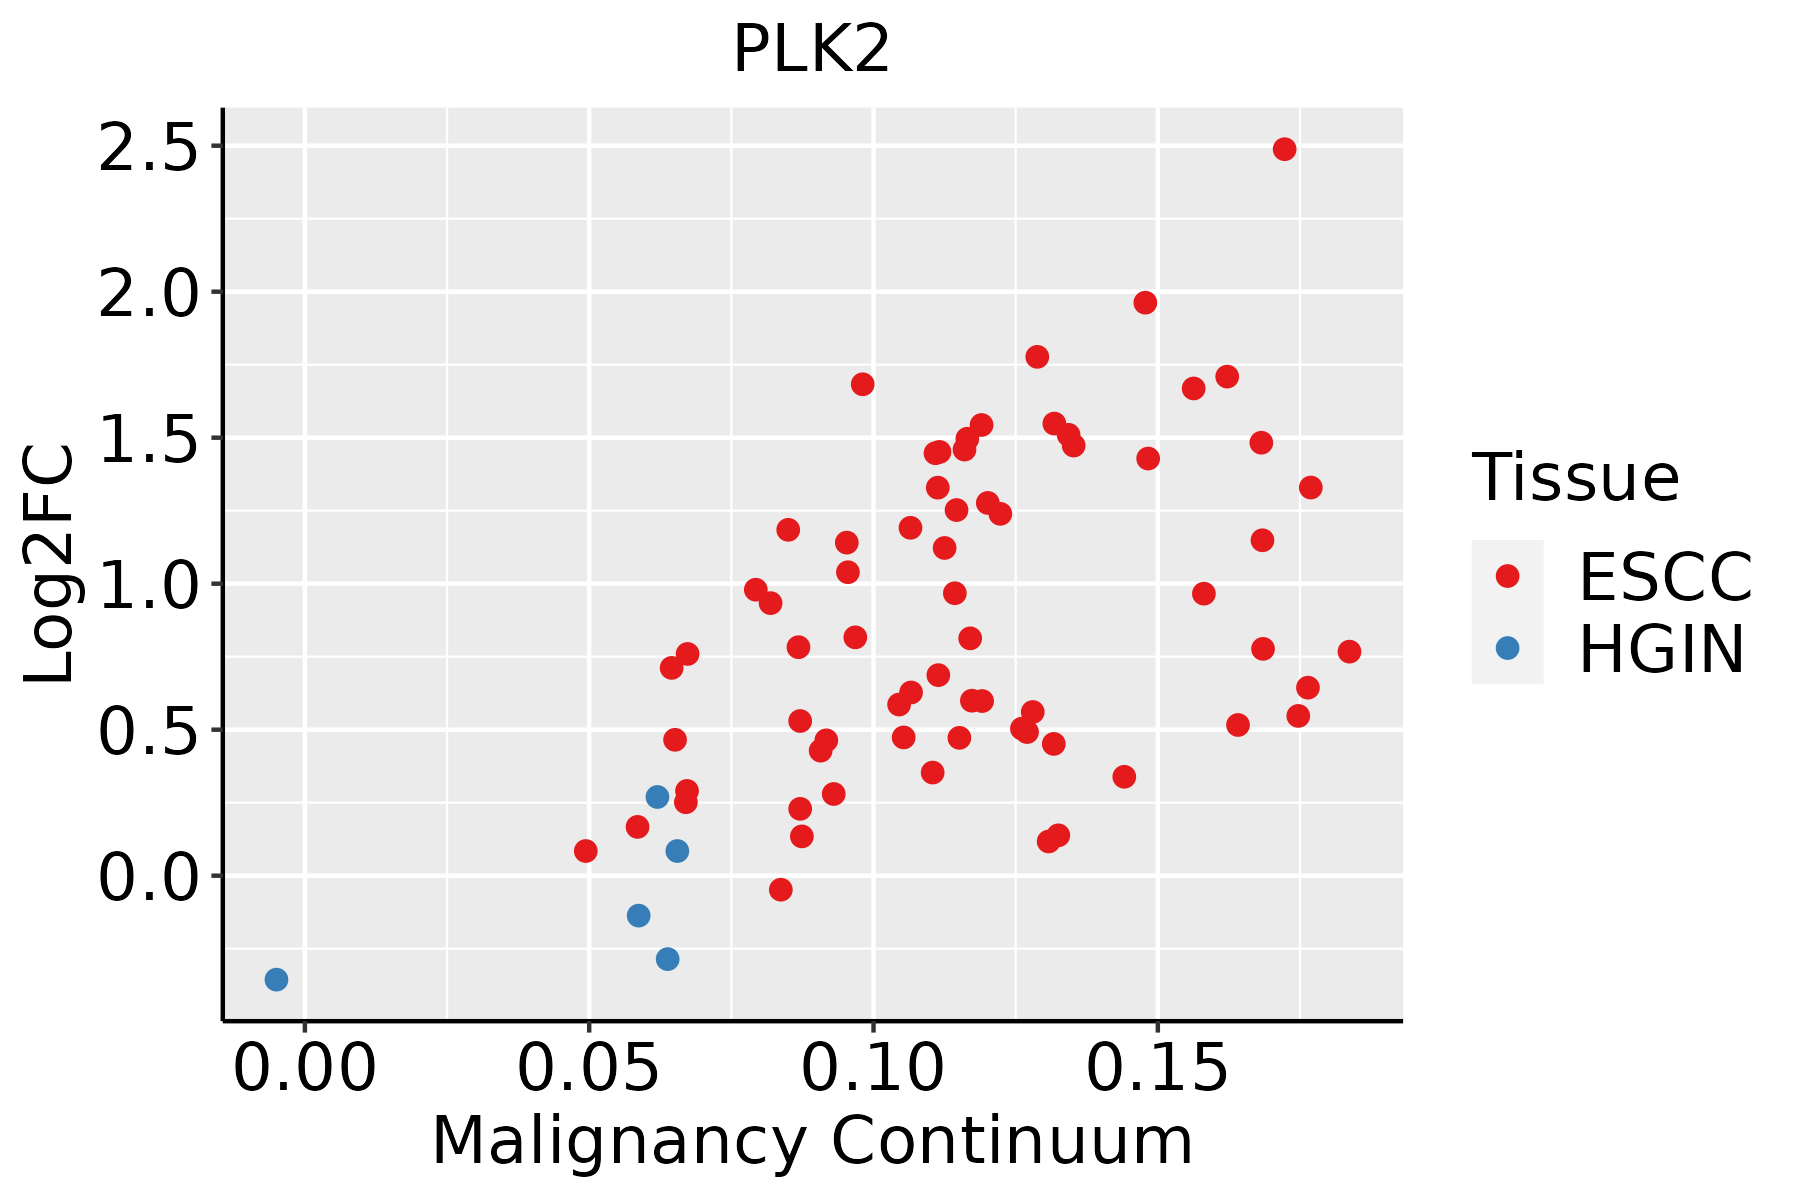 | ESCC: Esophageal squamous cell carcinoma |
| HGIN: High-grade intraepithelial neoplasias | ||
| LGIN: Low-grade intraepithelial neoplasias | ||
| Liver |  | HCC: Hepatocellular carcinoma |
| NAFLD: Non-alcoholic fatty liver disease | ||
| Oral Cavity | 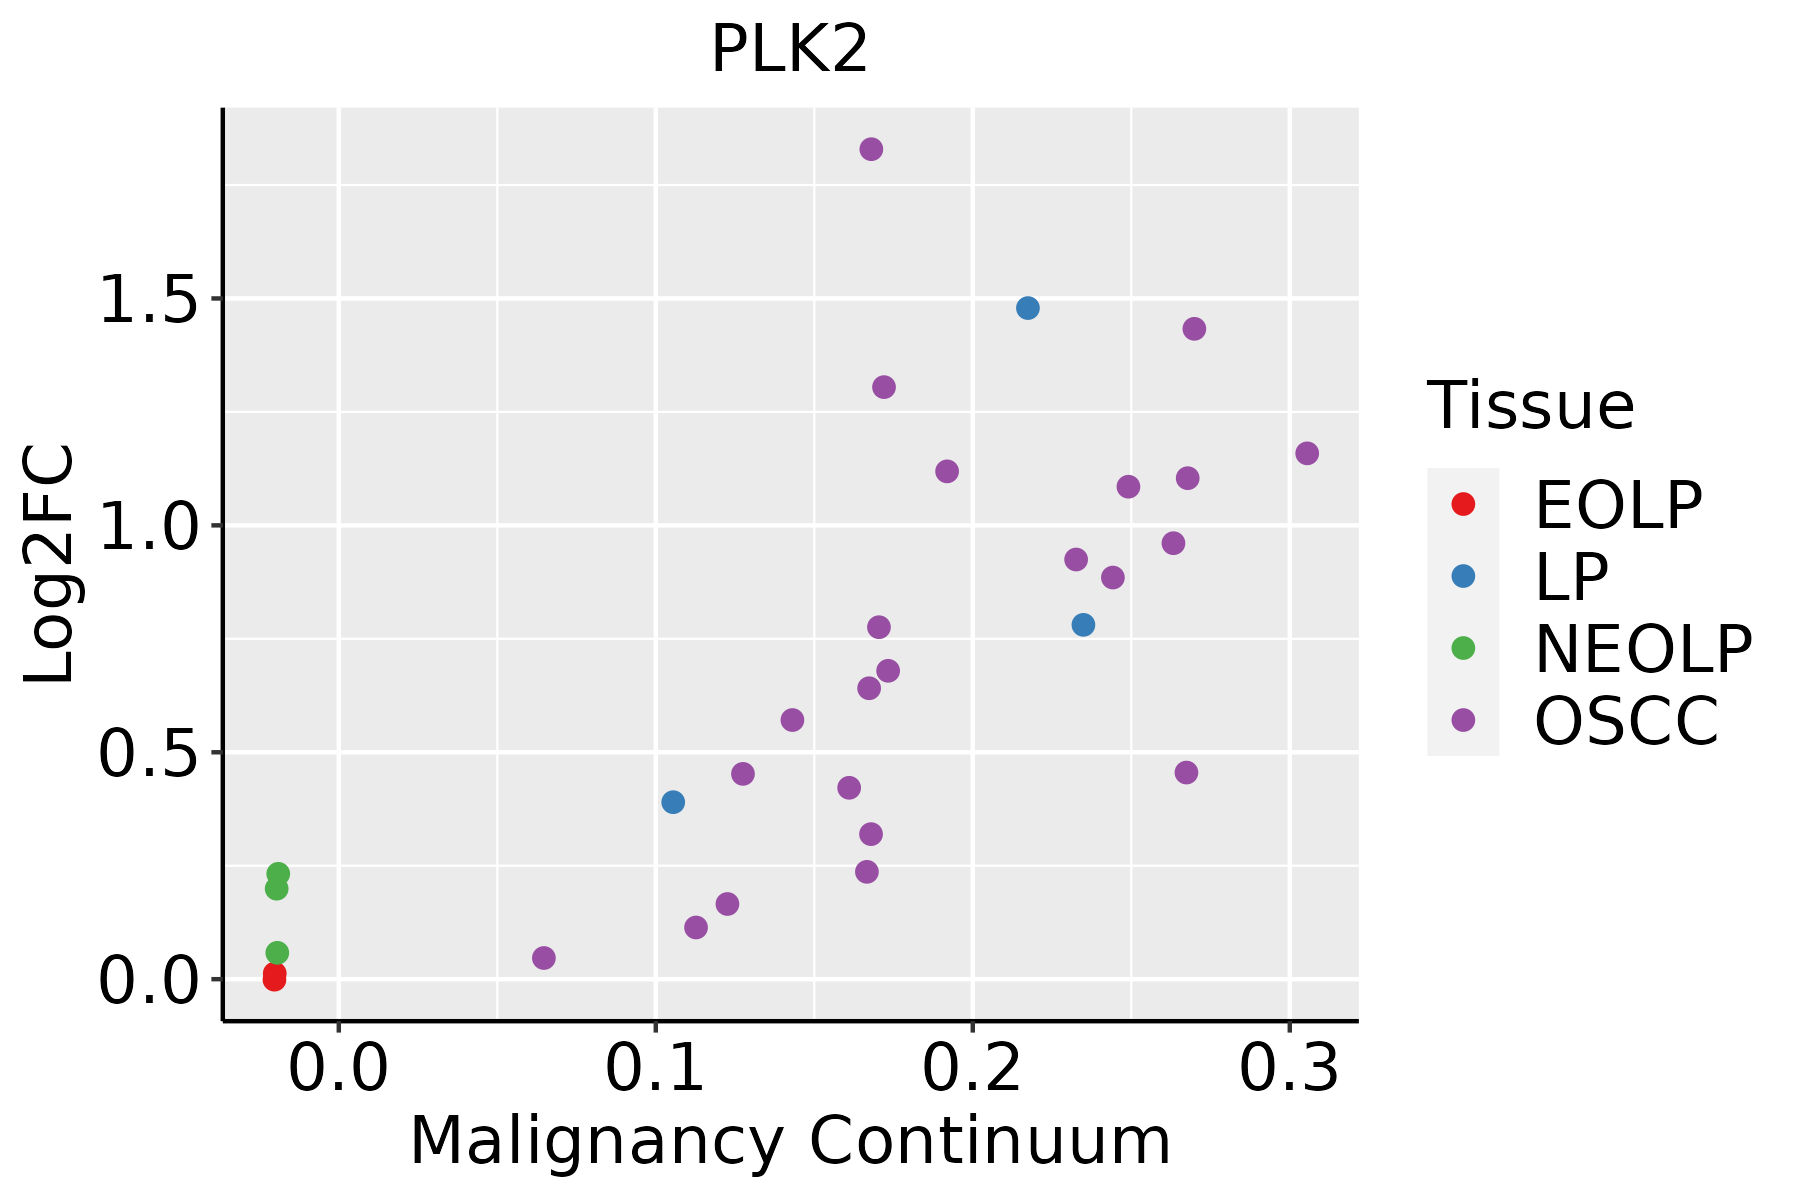 | EOLP: Erosive Oral lichen planus |
| LP: leukoplakia | ||
| NEOLP: Non-erosive oral lichen planus | ||
| OSCC: Oral squamous cell carcinoma | ||
| Prostate | 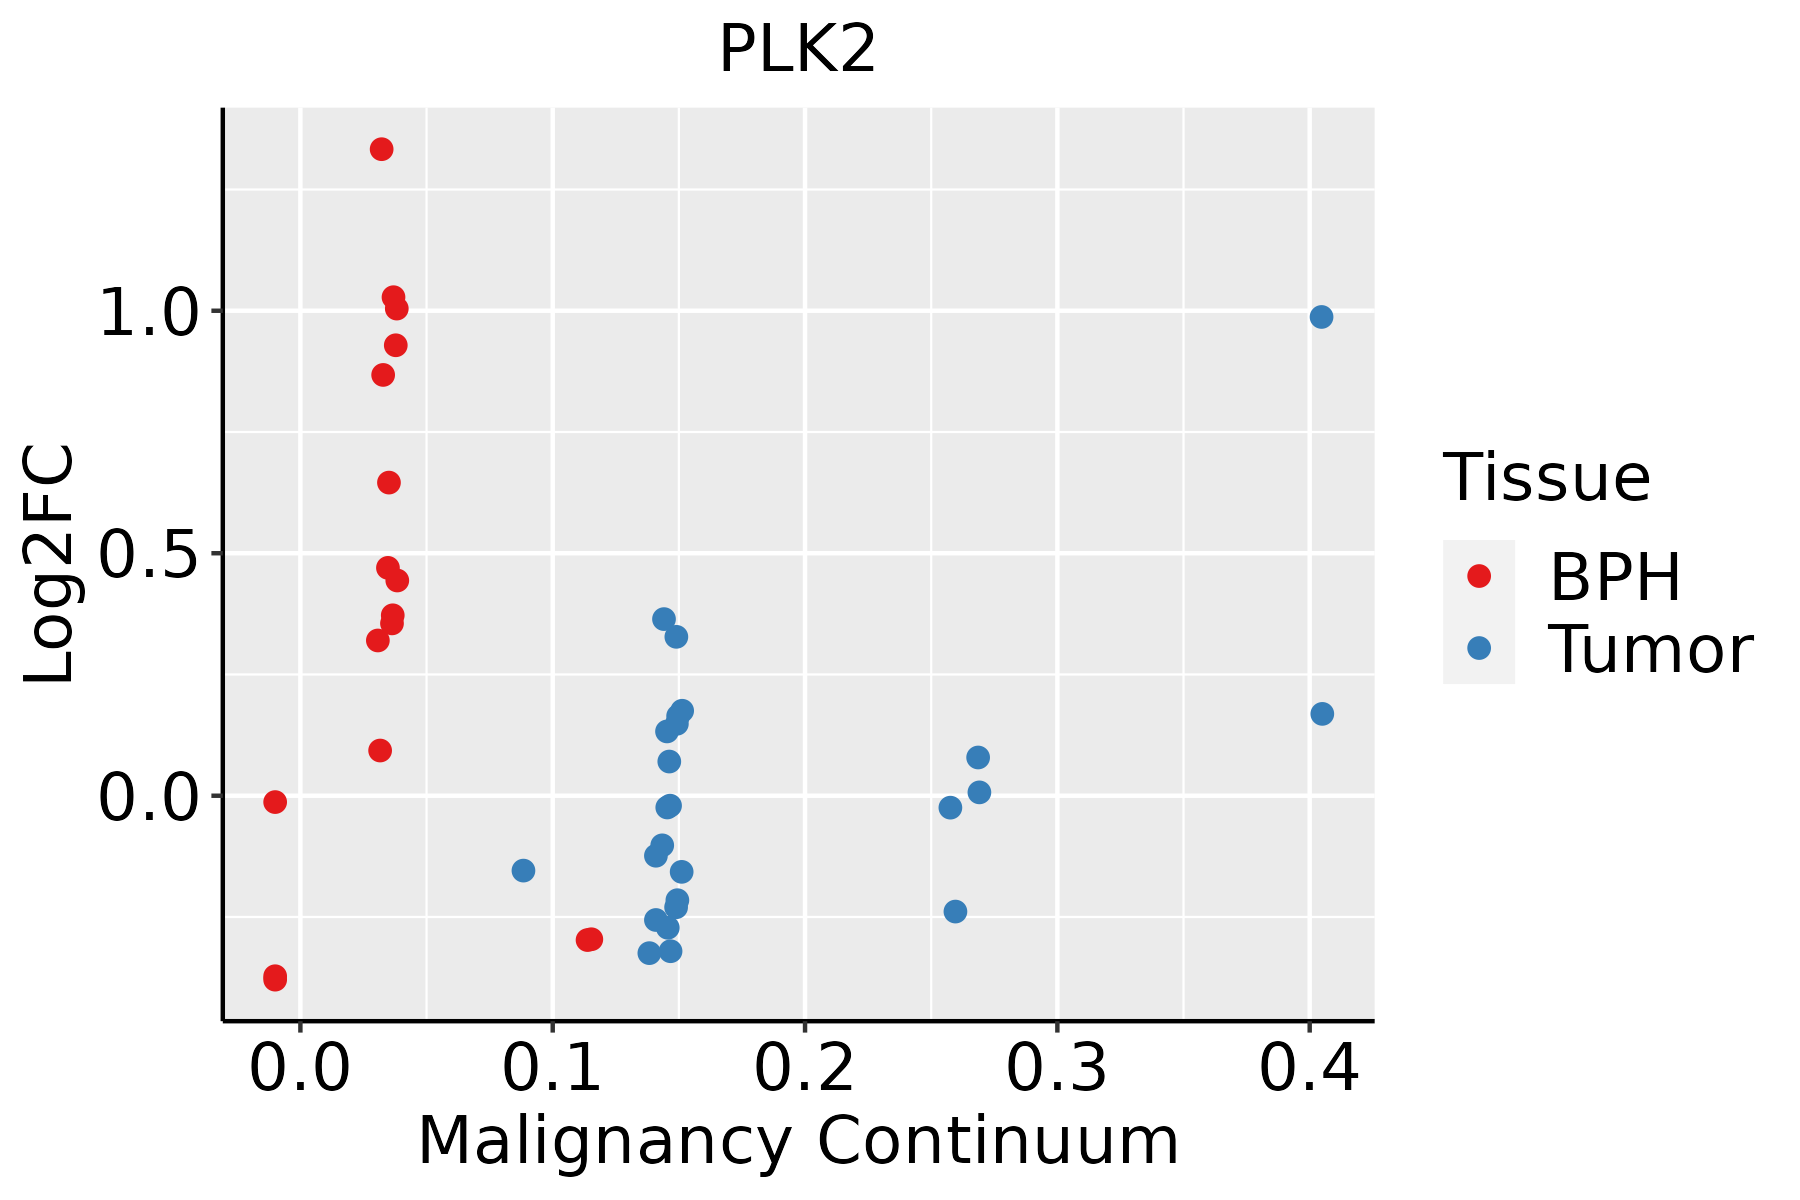 | BPH: Benign Prostatic Hyperplasia |
| Skin | 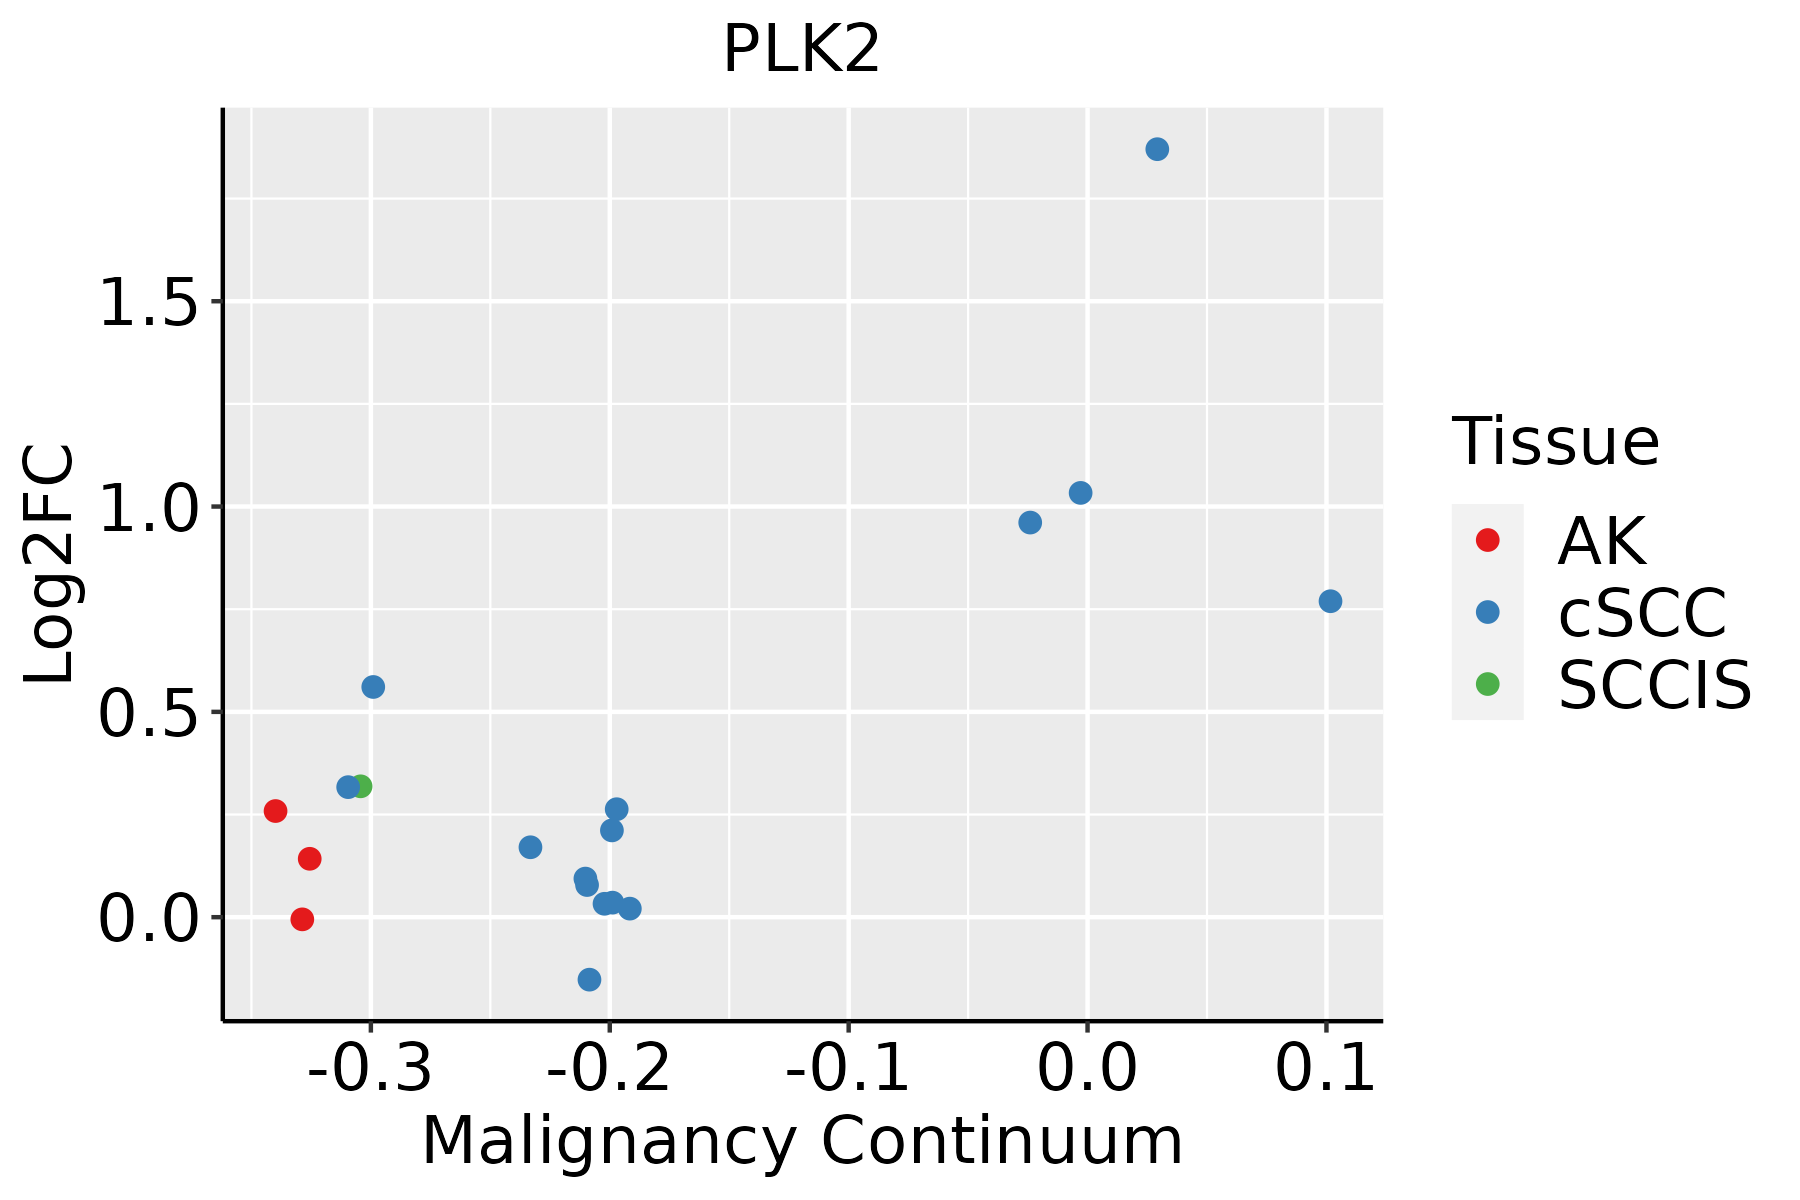 | AK: Actinic keratosis |
| cSCC: Cutaneous squamous cell carcinoma | ||
| SCCIS:squamous cell carcinoma in situ | ||
| Thyroid | 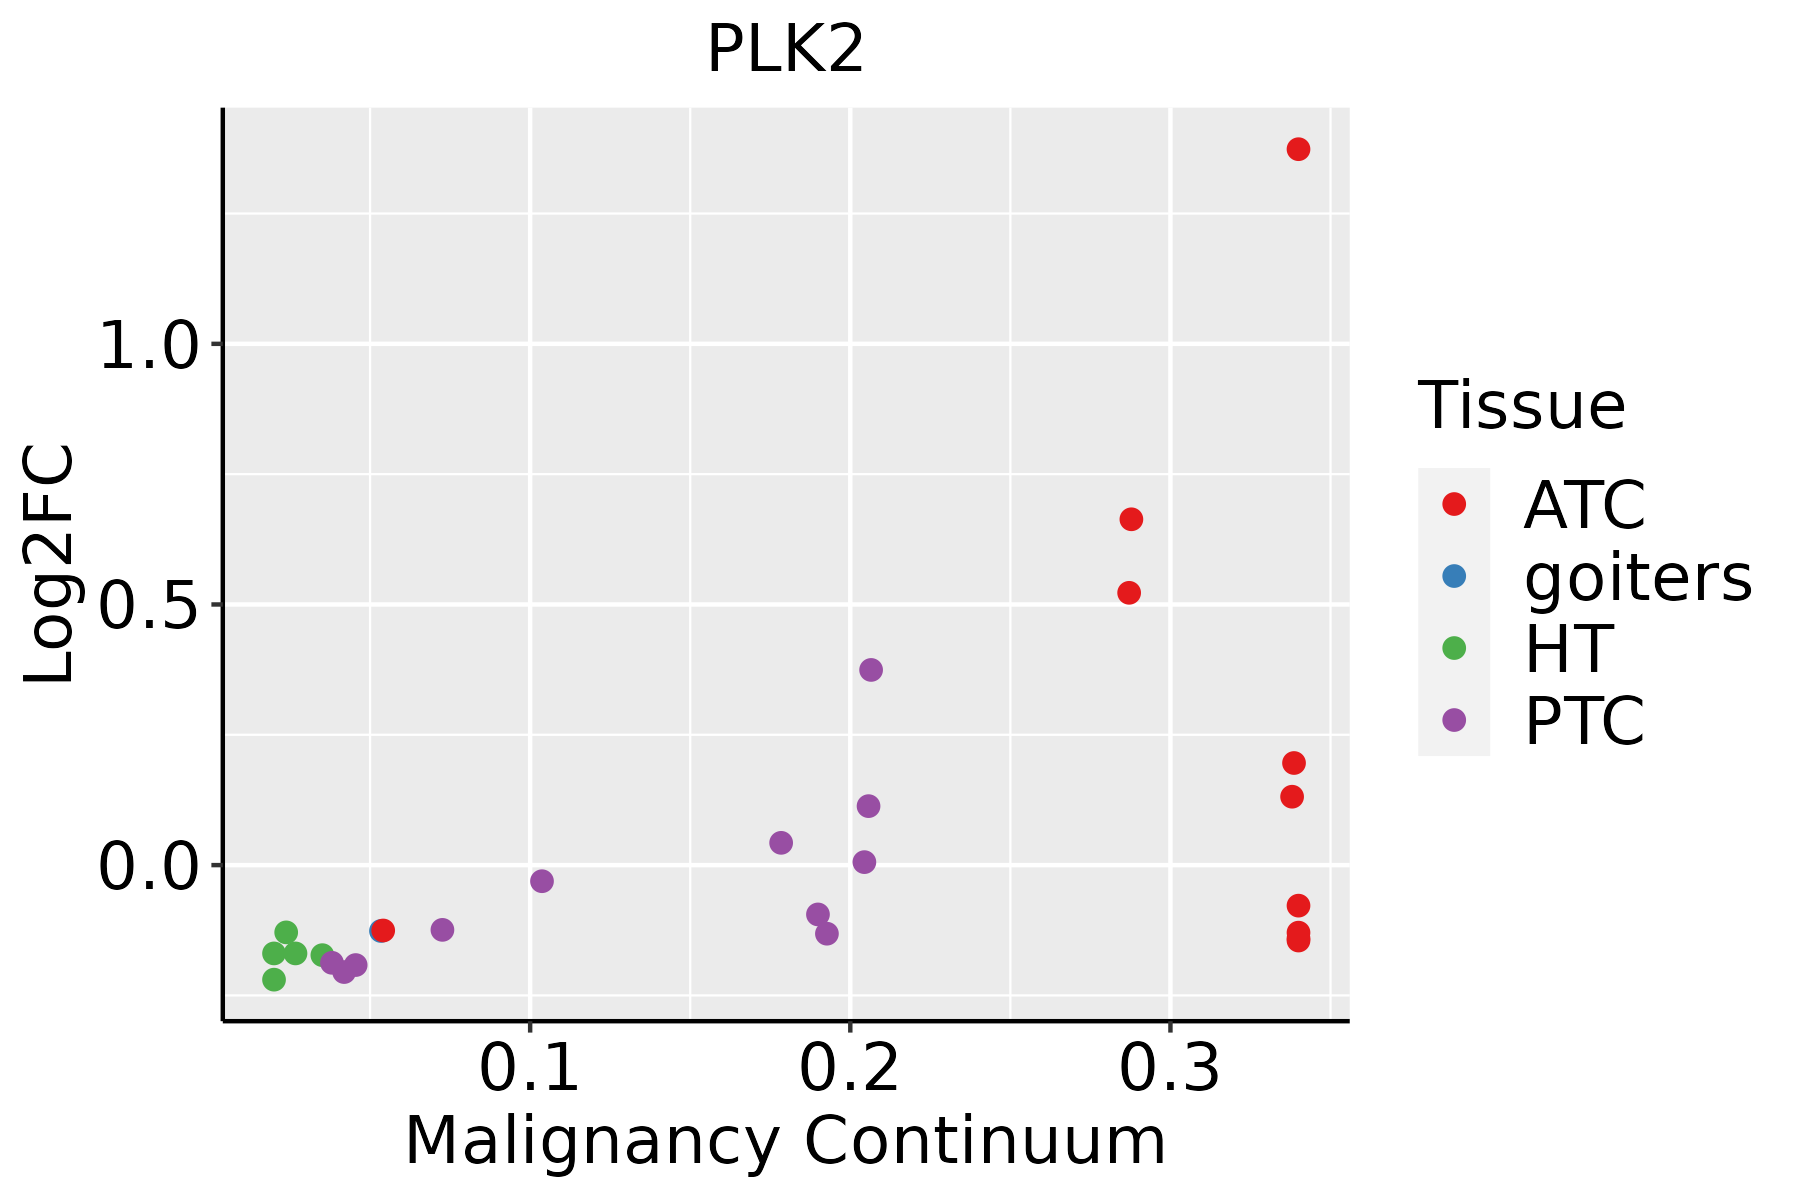 | ATC: Anaplastic thyroid cancer |
| HT: Hashimoto's thyroiditis | ||
| PTC: Papillary thyroid cancer |
| ∗log2FC in expression of this searched gene in stem-like cells from each diseased tissue sample relative to stem-like cells in normal samples in each tissue plotted against the malignancy continuum. Samples are colored based on if they are from different disease stage. |
Top |
Malignant transformation related pathway analysis |
| Find out the enriched GO biological processes and KEGG pathways involved in transition from healthy to precancer to cancer |
| Tissue | Disease Stage | Enriched GO biological Processes |
| Colorectum | AD |  |
| Colorectum | SER |  |
| Colorectum | MSS |  |
| Colorectum | MSI-H |  |
| Colorectum | FAP |  |
| ∗Top 15 enriched GO BP terms are showed in the bar plot of each disease state in each tissue. Each row represents a significant GO biological process which is colored according to the -log10(p.adjust). |
| Page: 1 2 3 4 5 6 7 8 9 |
| GO ID | Tissue | Disease Stage | Description | Gene Ratio | Bg Ratio | pvalue | p.adjust | Count |
| GO:00321024 | Skin | AK | negative regulation of response to external stimulus | 61/1910 | 420/18723 | 2.96e-03 | 1.87e-02 | 61 |
| GO:00109485 | Skin | AK | negative regulation of cell cycle process | 45/1910 | 294/18723 | 3.73e-03 | 2.22e-02 | 45 |
| GO:004312319 | Skin | AK | positive regulation of I-kappaB kinase/NF-kappaB signaling | 31/1910 | 186/18723 | 4.21e-03 | 2.46e-02 | 31 |
| GO:00315706 | Skin | AK | DNA integrity checkpoint | 22/1910 | 123/18723 | 6.33e-03 | 3.38e-02 | 22 |
| GO:00000755 | Skin | AK | cell cycle checkpoint | 28/1910 | 169/18723 | 6.83e-03 | 3.60e-02 | 28 |
| GO:0042176112 | Skin | SCCIS | regulation of protein catabolic process | 54/919 | 391/18723 | 5.60e-12 | 7.43e-09 | 54 |
| GO:1903362112 | Skin | SCCIS | regulation of cellular protein catabolic process | 38/919 | 255/18723 | 9.24e-10 | 5.45e-07 | 38 |
| GO:001635818 | Skin | SCCIS | dendrite development | 36/919 | 243/18723 | 3.00e-09 | 1.45e-06 | 36 |
| GO:0045732112 | Skin | SCCIS | positive regulation of protein catabolic process | 34/919 | 231/18723 | 9.75e-09 | 3.45e-06 | 34 |
| GO:1903364112 | Skin | SCCIS | positive regulation of cellular protein catabolic process | 26/919 | 155/18723 | 3.64e-08 | 7.72e-06 | 26 |
| GO:1903050112 | Skin | SCCIS | regulation of proteolysis involved in cellular protein catabolic process | 32/919 | 221/18723 | 3.93e-08 | 7.72e-06 | 32 |
| GO:000268318 | Skin | SCCIS | negative regulation of immune system process | 49/919 | 434/18723 | 4.92e-08 | 8.19e-06 | 49 |
| GO:0007568110 | Skin | SCCIS | aging | 41/919 | 339/18723 | 9.54e-08 | 1.29e-05 | 41 |
| GO:2000058112 | Skin | SCCIS | regulation of ubiquitin-dependent protein catabolic process | 26/919 | 164/18723 | 1.18e-07 | 1.52e-05 | 26 |
| GO:0010631110 | Skin | SCCIS | epithelial cell migration | 42/919 | 357/18723 | 1.45e-07 | 1.74e-05 | 42 |
| GO:0045862112 | Skin | SCCIS | positive regulation of proteolysis | 43/919 | 372/18723 | 1.69e-07 | 1.91e-05 | 43 |
| GO:0090132110 | Skin | SCCIS | epithelium migration | 42/919 | 360/18723 | 1.82e-07 | 1.97e-05 | 42 |
| GO:0090130110 | Skin | SCCIS | tissue migration | 42/919 | 365/18723 | 2.66e-07 | 2.62e-05 | 42 |
| GO:0061136112 | Skin | SCCIS | regulation of proteasomal protein catabolic process | 26/919 | 187/18723 | 1.60e-06 | 9.11e-05 | 26 |
| GO:0001667111 | Skin | SCCIS | ameboidal-type cell migration | 48/919 | 475/18723 | 1.78e-06 | 9.73e-05 | 48 |
| Page: 1 2 3 4 5 6 7 8 9 10 11 12 13 14 15 16 17 18 19 20 21 22 23 24 25 26 27 28 29 30 31 32 33 34 35 36 37 38 39 40 41 42 43 44 45 46 47 48 49 50 51 52 53 |
| Pathway ID | Tissue | Disease Stage | Description | Gene Ratio | Bg Ratio | pvalue | p.adjust | qvalue | Count |
| hsa040689 | Esophagus | ESCC | FoxO signaling pathway | 89/4205 | 131/8465 | 1.56e-05 | 7.98e-05 | 4.09e-05 | 89 |
| hsa0406814 | Esophagus | ESCC | FoxO signaling pathway | 89/4205 | 131/8465 | 1.56e-05 | 7.98e-05 | 4.09e-05 | 89 |
| hsa040682 | Liver | Cirrhotic | FoxO signaling pathway | 52/2530 | 131/8465 | 9.98e-03 | 3.32e-02 | 2.05e-02 | 52 |
| hsa040683 | Liver | Cirrhotic | FoxO signaling pathway | 52/2530 | 131/8465 | 9.98e-03 | 3.32e-02 | 2.05e-02 | 52 |
| hsa040684 | Liver | HCC | FoxO signaling pathway | 85/4020 | 131/8465 | 3.99e-05 | 2.16e-04 | 1.20e-04 | 85 |
| hsa040685 | Liver | HCC | FoxO signaling pathway | 85/4020 | 131/8465 | 3.99e-05 | 2.16e-04 | 1.20e-04 | 85 |
| hsa040688 | Oral cavity | OSCC | FoxO signaling pathway | 85/3704 | 131/8465 | 7.50e-07 | 4.33e-06 | 2.21e-06 | 85 |
| hsa0406813 | Oral cavity | OSCC | FoxO signaling pathway | 85/3704 | 131/8465 | 7.50e-07 | 4.33e-06 | 2.21e-06 | 85 |
| hsa0406841 | Oral cavity | NEOLP | FoxO signaling pathway | 27/1112 | 131/8465 | 1.07e-02 | 3.54e-02 | 2.22e-02 | 27 |
| hsa0406851 | Oral cavity | NEOLP | FoxO signaling pathway | 27/1112 | 131/8465 | 1.07e-02 | 3.54e-02 | 2.22e-02 | 27 |
| hsa040687 | Prostate | BPH | FoxO signaling pathway | 54/1718 | 131/8465 | 3.05e-08 | 3.59e-07 | 2.22e-07 | 54 |
| hsa0406812 | Prostate | BPH | FoxO signaling pathway | 54/1718 | 131/8465 | 3.05e-08 | 3.59e-07 | 2.22e-07 | 54 |
| hsa0406822 | Prostate | Tumor | FoxO signaling pathway | 54/1791 | 131/8465 | 1.32e-07 | 1.51e-06 | 9.36e-07 | 54 |
| hsa0406832 | Prostate | Tumor | FoxO signaling pathway | 54/1791 | 131/8465 | 1.32e-07 | 1.51e-06 | 9.36e-07 | 54 |
| Page: 1 |
Top |
Cell-cell communication analysis |
| Identification of potential cell-cell interactions between two cell types and their ligand-receptor pairs for different disease states |
| Ligand | Receptor | LRpair | Pathway | Tissue | Disease Stage |
| Page: 1 |
Top |
Single-cell gene regulatory network inference analysis |
| Find out the significant the regulons (TFs) and the target genes of each regulon across cell types for different disease states |
| TF | Cell Type | Tissue | Disease Stage | Target Gene | RSS | Regulon Activity |
| ∗The dot plots of a searched regulon are shown for all cell subpopulations in each disease state of each tissue based on the regulon specific score inferred using pySCENIC and by calculating the average expression. |
| Page: 1 |
Top |
Somatic mutation of malignant transformation related genes |
| Annotation of somatic variants for genes involved in malignant transformation |
| Hugo Symbol | Variant Class | Variant Classification | dbSNP RS | HGVSc | HGVSp | HGVSp Short | SWISSPROT | BIOTYPE | SIFT | PolyPhen | Tumor Sample Barcode | Tissue | Histology | Sex | Age | Stage | Therapy Types | Drugs | Outcome |
| PLK2 | SNV | Missense_Mutation | c.1468N>C | p.Asp490His | p.D490H | Q9NYY3 | protein_coding | deleterious(0.03) | benign(0.438) | TCGA-AC-A23H-01 | Breast | breast invasive carcinoma | Female | >=65 | I/II | Unknown | Unknown | PD | |
| PLK2 | SNV | Missense_Mutation | novel | c.1034N>A | p.Ser345Tyr | p.S345Y | Q9NYY3 | protein_coding | deleterious(0.04) | benign(0.212) | TCGA-AN-A046-01 | Breast | breast invasive carcinoma | Female | >=65 | I/II | Unknown | Unknown | SD |
| PLK2 | SNV | Missense_Mutation | novel | c.412N>T | p.His138Tyr | p.H138Y | Q9NYY3 | protein_coding | deleterious(0.02) | possibly_damaging(0.808) | TCGA-B6-A0IA-01 | Breast | breast invasive carcinoma | Female | <65 | I/II | Unknown | Unknown | SD |
| PLK2 | SNV | Missense_Mutation | novel | c.622C>G | p.Leu208Val | p.L208V | Q9NYY3 | protein_coding | deleterious(0.03) | possibly_damaging(0.879) | TCGA-OL-A5S0-01 | Breast | breast invasive carcinoma | Female | >=65 | I/II | Chemotherapy | taxol | CR |
| PLK2 | insertion | Frame_Shift_Ins | novel | c.1417_1418insCAAA | p.Asp473AlafsTer19 | p.D473Afs*19 | Q9NYY3 | protein_coding | TCGA-A8-A07G-01 | Breast | breast invasive carcinoma | Female | >=65 | I/II | Chemotherapy | 5-fluorouracil | CR | ||
| PLK2 | insertion | Nonsense_Mutation | novel | c.1416_1417insTAGGCCCCTAAAGATATCAGAAGCATAAAATTATAAA | p.Asp473Ter | p.D473* | Q9NYY3 | protein_coding | TCGA-A8-A07G-01 | Breast | breast invasive carcinoma | Female | >=65 | I/II | Chemotherapy | 5-fluorouracil | CR | ||
| PLK2 | insertion | Frame_Shift_Ins | novel | c.409_410insATTTACGACT | p.Leu137HisfsTer7 | p.L137Hfs*7 | Q9NYY3 | protein_coding | TCGA-B6-A0IA-01 | Breast | breast invasive carcinoma | Female | <65 | I/II | Unknown | Unknown | SD | ||
| PLK2 | deletion | Frame_Shift_Del | novel | c.1327delN | p.Asp443MetfsTer5 | p.D443Mfs*5 | Q9NYY3 | protein_coding | TCGA-EW-A2FV-01 | Breast | breast invasive carcinoma | Female | <65 | III/IV | Chemotherapy | docetaxel | SD | ||
| PLK2 | SNV | Missense_Mutation | novel | c.1961C>A | p.Thr654Asn | p.T654N | Q9NYY3 | protein_coding | deleterious(0) | probably_damaging(0.99) | TCGA-VS-A9UP-01 | Cervix | cervical & endocervical cancer | Female | <65 | I/II | Chemotherapy | cisplatin | PD |
| PLK2 | SNV | Missense_Mutation | novel | c.1207N>G | p.Lys403Glu | p.K403E | Q9NYY3 | protein_coding | tolerated(1) | benign(0.001) | TCGA-CA-6717-01 | Colorectum | colon adenocarcinoma | Male | <65 | I/II | Chemotherapy | oxaliplatin | CR |
| Page: 1 2 3 4 5 6 7 8 9 |
Top |
Related drugs of malignant transformation related genes |
| Identification of chemicals and drugs interact with genes involved in malignant transfromation |
| (DGIdb 4.0) |
| Entrez ID | Symbol | Category | Interaction Types | Drug Claim Name | Drug Name | PMIDs |
| 10769 | PLK2 | CLINICALLY ACTIONABLE, KINASE, DRUGGABLE GENOME, ENZYME, SERINE THREONINE KINASE | US8598172, 1 | |||
| 10769 | PLK2 | CLINICALLY ACTIONABLE, KINASE, DRUGGABLE GENOME, ENZYME, SERINE THREONINE KINASE | inhibitor | 178102294 | BI-2536 | |
| 10769 | PLK2 | CLINICALLY ACTIONABLE, KINASE, DRUGGABLE GENOME, ENZYME, SERINE THREONINE KINASE | inhibitor | 249565601 | ONVANSERTIB | |
| 10769 | PLK2 | CLINICALLY ACTIONABLE, KINASE, DRUGGABLE GENOME, ENZYME, SERINE THREONINE KINASE | BI2536 | |||
| 10769 | PLK2 | CLINICALLY ACTIONABLE, KINASE, DRUGGABLE GENOME, ENZYME, SERINE THREONINE KINASE | WORTMANNIN | WORTMANNIN | 17135248 |
| Page: 1 |

Copyright 2023-Present -The University of Texas Health Science Center at Houston |