
|
|||||
|
 | |
| |
| |
| |
| |
| |
|
Gene: HDC |
Gene summary for HDC |
| Gene information | Species | Human | Gene symbol | HDC | Gene ID | 3067 |
| Gene name | histidine decarboxylase | |
| Gene Alias | HDC | |
| Cytomap | 15q21.2 | |
| Gene Type | protein-coding | GO ID | GO:0001692 | UniProtAcc | P19113 |
Top |
Malignant transformation analysis |
| Identification of the aberrant gene expression in precancerous and cancerous lesions by comparing the gene expression of stem-like cells in diseased tissues with normal stem cells |
| Entrez ID | Symbol | Replicates | Species | Organ | Tissue | Adj P-value | Log2FC | Malignancy |
| 3067 | HDC | CA_HPV_1 | Human | Cervix | CC | 1.90e-14 | -4.60e-01 | 0.0264 |
| 3067 | HDC | HSIL_HPV_2 | Human | Cervix | HSIL_HPV | 1.66e-04 | 3.33e-02 | 0.0208 |
| 3067 | HDC | N_HPV_2 | Human | Cervix | N_HPV | 1.76e-02 | -3.56e-01 | -0.0131 |
| 3067 | HDC | CCI_1 | Human | Cervix | CC | 2.11e-03 | -5.60e-01 | 0.528 |
| 3067 | HDC | CCI_2 | Human | Cervix | CC | 5.80e-03 | -5.60e-01 | 0.5249 |
| 3067 | HDC | CCI_3 | Human | Cervix | CC | 3.56e-05 | -5.60e-01 | 0.516 |
| 3067 | HDC | CCII_1 | Human | Cervix | CC | 6.78e-08 | -5.60e-01 | 0.3249 |
| 3067 | HDC | Tumor | Human | Cervix | CC | 2.52e-20 | -5.60e-01 | 0.1241 |
| 3067 | HDC | sample1 | Human | Cervix | CC | 2.70e-06 | -5.60e-01 | 0.0959 |
| 3067 | HDC | sample3 | Human | Cervix | CC | 4.65e-21 | -5.60e-01 | 0.1387 |
| 3067 | HDC | H2 | Human | Cervix | HSIL_HPV | 1.62e-17 | -5.49e-01 | 0.0632 |
| 3067 | HDC | L1 | Human | Cervix | CC | 7.67e-09 | -5.60e-01 | 0.0802 |
| 3067 | HDC | T1 | Human | Cervix | CC | 8.70e-16 | -5.60e-01 | 0.0918 |
| 3067 | HDC | T2 | Human | Cervix | CC | 1.07e-02 | -5.60e-01 | 0.0709 |
| 3067 | HDC | T3 | Human | Cervix | CC | 3.12e-19 | -5.60e-01 | 0.1389 |
| Page: 1 |
| Tissue | Expression Dynamics | Abbreviation |
| Cervix | 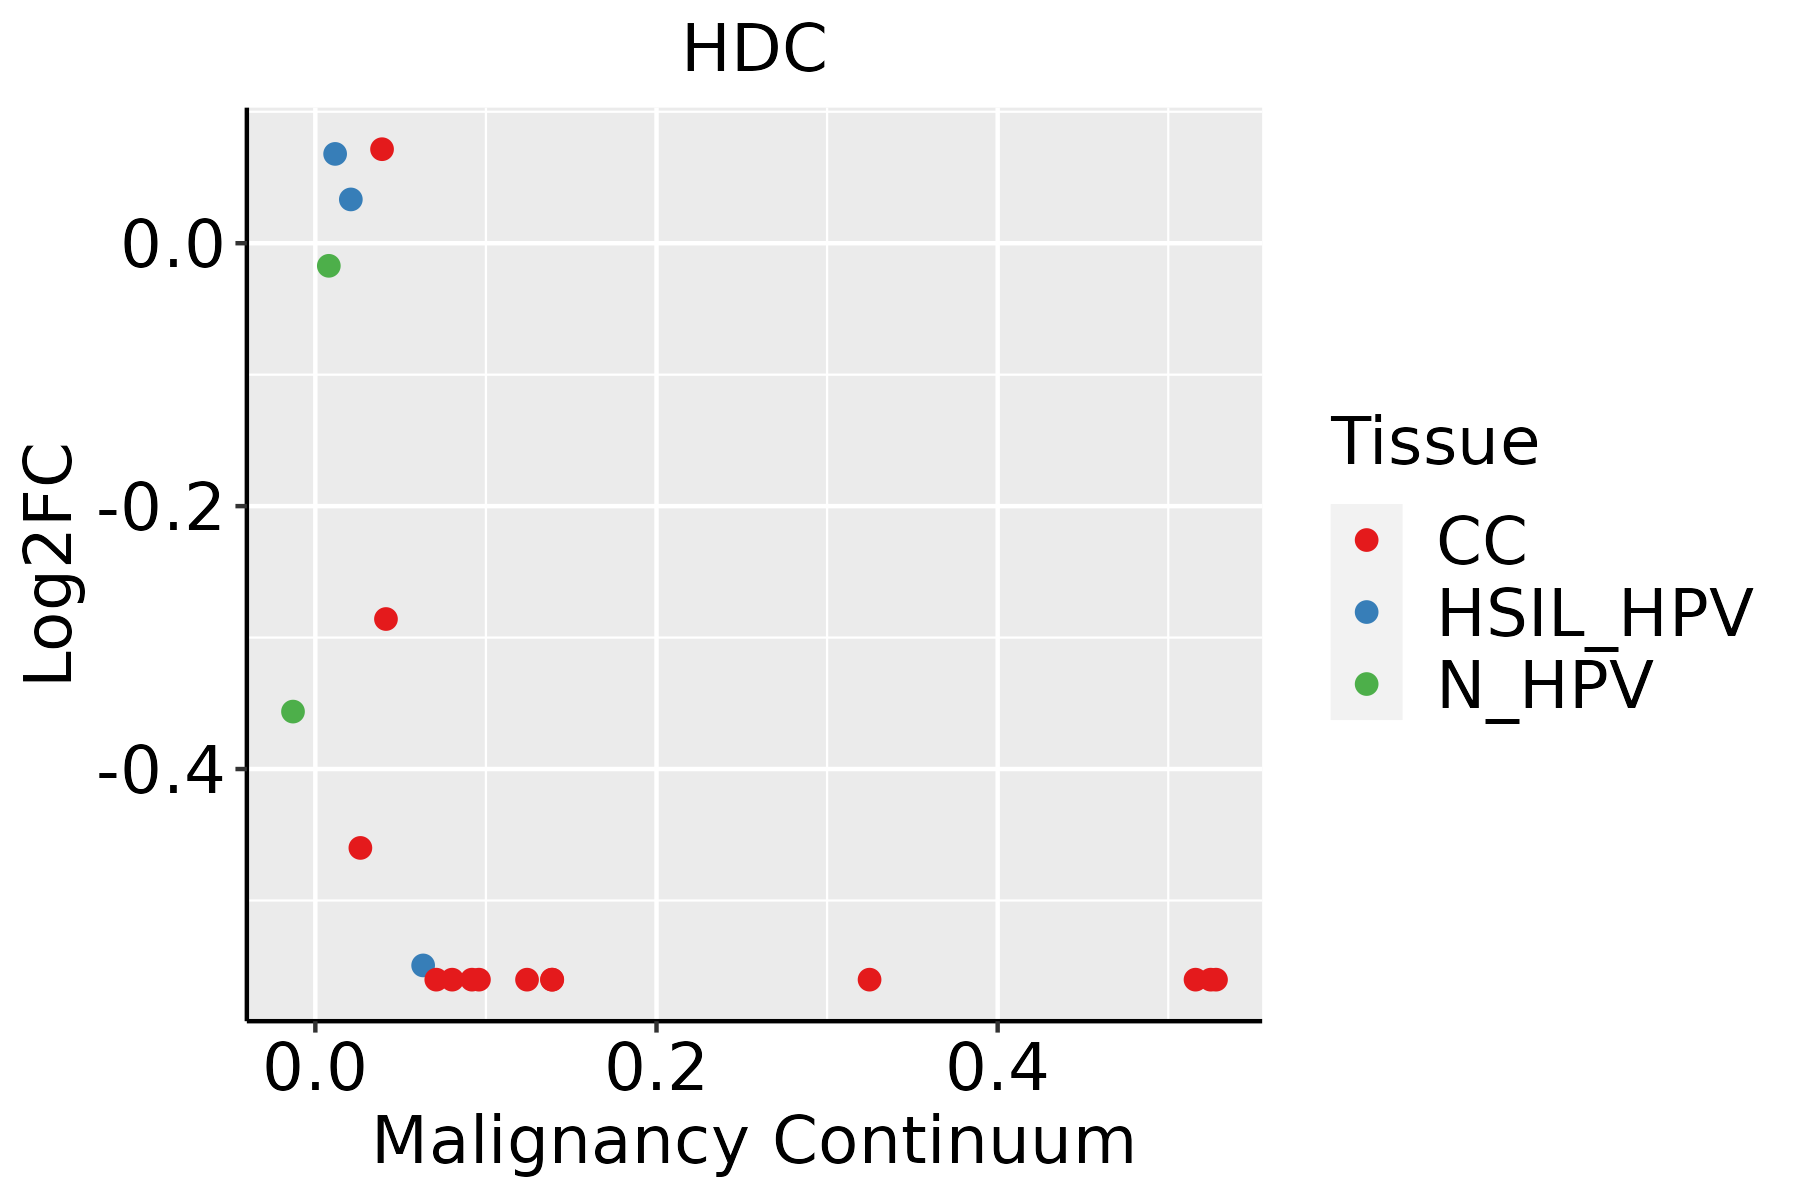 | CC: Cervix cancer |
| HSIL_HPV: HPV-infected high-grade squamous intraepithelial lesions | ||
| N_HPV: HPV-infected normal cervix |
| ∗log2FC in expression of this searched gene in stem-like cells from each diseased tissue sample relative to stem-like cells in normal samples in each tissue plotted against the malignancy continuum. Samples are colored based on if they are from different disease stage. |
Top |
Malignant transformation related pathway analysis |
| Find out the enriched GO biological processes and KEGG pathways involved in transition from healthy to precancer to cancer |
| Tissue | Disease Stage | Enriched GO biological Processes |
| Colorectum | AD |  |
| Colorectum | SER |  |
| Colorectum | MSS |  |
| Colorectum | MSI-H |  |
| Colorectum | FAP |  |
| ∗Top 15 enriched GO BP terms are showed in the bar plot of each disease state in each tissue. Each row represents a significant GO biological process which is colored according to the -log10(p.adjust). |
| Page: 1 2 3 4 5 6 7 8 9 |
| GO ID | Tissue | Disease Stage | Description | Gene Ratio | Bg Ratio | pvalue | p.adjust | Count |
| GO:004316119 | Prostate | Tumor | proteasome-mediated ubiquitin-dependent protein catabolic process | 130/3246 | 412/18723 | 7.97e-13 | 8.00e-11 | 130 |
| GO:000691316 | Prostate | Tumor | nucleocytoplasmic transport | 97/3246 | 301/18723 | 1.78e-10 | 1.05e-08 | 97 |
| GO:005116916 | Prostate | Tumor | nuclear transport | 97/3246 | 301/18723 | 1.78e-10 | 1.05e-08 | 97 |
| GO:000640317 | Prostate | Tumor | RNA localization | 70/3246 | 201/18723 | 1.58e-09 | 7.32e-08 | 70 |
| GO:000038015 | Prostate | Tumor | alternative mRNA splicing, via spliceosome | 35/3246 | 77/18723 | 9.41e-09 | 3.55e-07 | 35 |
| GO:000170115 | Prostate | Tumor | in utero embryonic development | 106/3246 | 367/18723 | 2.37e-08 | 8.09e-07 | 106 |
| GO:000038115 | Prostate | Tumor | regulation of alternative mRNA splicing, via spliceosome | 29/3246 | 60/18723 | 3.18e-08 | 1.02e-06 | 29 |
| GO:005123613 | Prostate | Tumor | establishment of RNA localization | 52/3246 | 166/18723 | 7.11e-06 | 1.07e-04 | 52 |
| GO:005065713 | Prostate | Tumor | nucleic acid transport | 51/3246 | 163/18723 | 8.99e-06 | 1.32e-04 | 51 |
| GO:005065813 | Prostate | Tumor | RNA transport | 51/3246 | 163/18723 | 8.99e-06 | 1.32e-04 | 51 |
| GO:005116816 | Prostate | Tumor | nuclear export | 48/3246 | 154/18723 | 1.82e-05 | 2.41e-04 | 48 |
| GO:003109815 | Prostate | Tumor | stress-activated protein kinase signaling cascade | 68/3246 | 247/18723 | 4.03e-05 | 4.62e-04 | 68 |
| GO:005140315 | Prostate | Tumor | stress-activated MAPK cascade | 66/3246 | 239/18723 | 4.69e-05 | 5.21e-04 | 66 |
| GO:003287215 | Prostate | Tumor | regulation of stress-activated MAPK cascade | 53/3246 | 192/18723 | 2.51e-04 | 2.11e-03 | 53 |
| GO:003150312 | Prostate | Tumor | protein-containing complex localization | 59/3246 | 220/18723 | 2.71e-04 | 2.24e-03 | 59 |
| GO:001593113 | Prostate | Tumor | nucleobase-containing compound transport | 59/3246 | 222/18723 | 3.49e-04 | 2.75e-03 | 59 |
| GO:007030215 | Prostate | Tumor | regulation of stress-activated protein kinase signaling cascade | 53/3246 | 195/18723 | 3.80e-04 | 2.95e-03 | 53 |
| GO:005102813 | Prostate | Tumor | mRNA transport | 38/3246 | 130/18723 | 5.44e-04 | 3.96e-03 | 38 |
| GO:000024512 | Prostate | Tumor | spliceosomal complex assembly | 26/3246 | 79/18723 | 5.68e-04 | 4.11e-03 | 26 |
| GO:004341012 | Prostate | Tumor | positive regulation of MAPK cascade | 110/3246 | 480/18723 | 9.41e-04 | 6.18e-03 | 110 |
| Page: 1 2 3 4 5 6 7 8 9 10 11 12 13 14 15 16 17 18 19 20 21 22 23 24 25 26 27 28 29 30 31 32 33 34 35 36 37 38 39 40 41 42 43 44 45 46 47 48 49 50 |
| Pathway ID | Tissue | Disease Stage | Description | Gene Ratio | Bg Ratio | pvalue | p.adjust | qvalue | Count |
| Page: 1 |
Top |
Cell-cell communication analysis |
| Identification of potential cell-cell interactions between two cell types and their ligand-receptor pairs for different disease states |
| Ligand | Receptor | LRpair | Pathway | Tissue | Disease Stage |
| Page: 1 |
Top |
Single-cell gene regulatory network inference analysis |
| Find out the significant the regulons (TFs) and the target genes of each regulon across cell types for different disease states |
| TF | Cell Type | Tissue | Disease Stage | Target Gene | RSS | Regulon Activity |
| ∗The dot plots of a searched regulon are shown for all cell subpopulations in each disease state of each tissue based on the regulon specific score inferred using pySCENIC and by calculating the average expression. |
| Page: 1 |
Top |
Somatic mutation of malignant transformation related genes |
| Annotation of somatic variants for genes involved in malignant transformation |
| Hugo Symbol | Variant Class | Variant Classification | dbSNP RS | HGVSc | HGVSp | HGVSp Short | SWISSPROT | BIOTYPE | SIFT | PolyPhen | Tumor Sample Barcode | Tissue | Histology | Sex | Age | Stage | Therapy Types | Drugs | Outcome |
| HDC | SNV | Missense_Mutation | rs370153946 | c.1073N>T | p.Arg358Leu | p.R358L | P19113 | protein_coding | deleterious(0) | probably_damaging(1) | TCGA-C8-A1HI-01 | Breast | breast invasive carcinoma | Female | <65 | III/IV | Unknown | Unknown | SD |
| HDC | SNV | Missense_Mutation | c.611C>G | p.Ser204Cys | p.S204C | P19113 | protein_coding | tolerated(0.11) | probably_damaging(0.99) | TCGA-C5-A1BF-01 | Cervix | cervical & endocervical cancer | Female | <65 | I/II | Chemotherapy | cisplatin | PD | |
| HDC | SNV | Missense_Mutation | rs749851294 | c.1234N>T | p.Arg412Cys | p.R412C | P19113 | protein_coding | tolerated(0.07) | probably_damaging(0.942) | TCGA-EA-A411-01 | Cervix | cervical & endocervical cancer | Female | <65 | I/II | Unknown | Unknown | SD |
| HDC | SNV | Missense_Mutation | novel | c.1902N>G | p.Ile634Met | p.I634M | P19113 | protein_coding | tolerated_low_confidence(0.08) | benign(0.317) | TCGA-VS-A9V1-01 | Cervix | cervical & endocervical cancer | Female | <65 | I/II | Chemotherapy | cisplatin | PD |
| HDC | SNV | Missense_Mutation | novel | c.1825T>G | p.Ser609Ala | p.S609A | P19113 | protein_coding | tolerated_low_confidence(0.3) | benign(0) | TCGA-A6-6780-01 | Colorectum | colon adenocarcinoma | Male | >=65 | I/II | Unknown | Unknown | SD |
| HDC | SNV | Missense_Mutation | c.1292N>A | p.Gly431Asp | p.G431D | P19113 | protein_coding | deleterious(0) | probably_damaging(1) | TCGA-AA-3811-01 | Colorectum | colon adenocarcinoma | Female | >=65 | III/IV | Unknown | Unknown | PD | |
| HDC | SNV | Missense_Mutation | novel | c.688N>A | p.Glu230Lys | p.E230K | P19113 | protein_coding | tolerated(0.14) | benign(0.194) | TCGA-AA-3818-01 | Colorectum | colon adenocarcinoma | Female | >=65 | I/II | Unknown | Unknown | PD |
| HDC | SNV | Missense_Mutation | rs777905414 | c.1748G>A | p.Arg583His | p.R583H | P19113 | protein_coding | deleterious_low_confidence(0) | probably_damaging(0.996) | TCGA-AA-3864-01 | Colorectum | colon adenocarcinoma | Male | >=65 | I/II | Unknown | Unknown | SD |
| HDC | SNV | Missense_Mutation | c.469G>T | p.Ala157Ser | p.A157S | P19113 | protein_coding | tolerated(0.29) | benign(0.292) | TCGA-CK-6746-01 | Colorectum | colon adenocarcinoma | Female | >=65 | I/II | Unknown | Unknown | SD | |
| HDC | SNV | Missense_Mutation | c.487A>C | p.Lys163Gln | p.K163Q | P19113 | protein_coding | tolerated(0.08) | probably_damaging(0.94) | TCGA-CM-6680-01 | Colorectum | colon adenocarcinoma | Female | >=65 | III/IV | Unknown | Unknown | SD |
| Page: 1 2 3 4 5 6 7 8 9 10 |
Top |
Related drugs of malignant transformation related genes |
| Identification of chemicals and drugs interact with genes involved in malignant transfromation |
| (DGIdb 4.0) |
| Entrez ID | Symbol | Category | Interaction Types | Drug Claim Name | Drug Name | PMIDs |
| 3067 | HDC | DRUGGABLE GENOME, ENZYME | BF-DERM1 | |||
| 3067 | HDC | DRUGGABLE GENOME, ENZYME | inhibitor | 178101877 | ||
| 3067 | HDC | DRUGGABLE GENOME, ENZYME | Lixivaptan | LIXIVAPTAN | ||
| 3067 | HDC | DRUGGABLE GENOME, ENZYME | inhibitor | 178101826 | ||
| 3067 | HDC | DRUGGABLE GENOME, ENZYME | OMEPRAZOLE | OMEPRAZOLE | 8187977 | |
| 3067 | HDC | DRUGGABLE GENOME, ENZYME | ALPHA-FMH |
| Page: 1 |

Copyright 2023-Present -The University of Texas Health Science Center at Houston |