
|
|||||
|
 | |
| |
| |
| |
| |
| |
|
Gene: AP3B1 |
Gene summary for AP3B1 |
| Gene information | Species | Human | Gene symbol | AP3B1 | Gene ID | 8546 |
| Gene name | adaptor related protein complex 3 subunit beta 1 | |
| Gene Alias | ADTB3 | |
| Cytomap | 5q14.1 | |
| Gene Type | protein-coding | GO ID | GO:0000003 | UniProtAcc | A0A0S2Z5J4 |
Top |
Malignant transformation analysis |
| Identification of the aberrant gene expression in precancerous and cancerous lesions by comparing the gene expression of stem-like cells in diseased tissues with normal stem cells |
| Entrez ID | Symbol | Replicates | Species | Organ | Tissue | Adj P-value | Log2FC | Malignancy |
| 8546 | AP3B1 | N_HPV_1 | Human | Cervix | N_HPV | 4.90e-02 | -8.42e-02 | 0.0079 |
| 8546 | AP3B1 | CCI_2 | Human | Cervix | CC | 1.14e-13 | 1.35e+00 | 0.5249 |
| 8546 | AP3B1 | CCI_3 | Human | Cervix | CC | 2.35e-09 | 7.92e-01 | 0.516 |
| 8546 | AP3B1 | HTA11_3410_2000001011 | Human | Colorectum | AD | 2.74e-15 | -6.38e-01 | 0.0155 |
| 8546 | AP3B1 | HTA11_3361_2000001011 | Human | Colorectum | AD | 1.33e-04 | -5.07e-01 | -0.1207 |
| 8546 | AP3B1 | HTA11_866_2000001011 | Human | Colorectum | AD | 5.74e-06 | -3.46e-01 | -0.1001 |
| 8546 | AP3B1 | HTA11_866_3004761011 | Human | Colorectum | AD | 7.62e-12 | -6.03e-01 | 0.096 |
| 8546 | AP3B1 | HTA11_10711_2000001011 | Human | Colorectum | AD | 6.23e-06 | -5.49e-01 | 0.0338 |
| 8546 | AP3B1 | HTA11_7696_3000711011 | Human | Colorectum | AD | 2.41e-09 | -4.07e-01 | 0.0674 |
| 8546 | AP3B1 | HTA11_99999970781_79442 | Human | Colorectum | MSS | 2.34e-06 | -2.96e-01 | 0.294 |
| 8546 | AP3B1 | HTA11_99999971662_82457 | Human | Colorectum | MSS | 1.03e-05 | -3.05e-01 | 0.3859 |
| 8546 | AP3B1 | HTA11_99999974143_84620 | Human | Colorectum | MSS | 8.77e-31 | -6.71e-01 | 0.3005 |
| 8546 | AP3B1 | A015-C-203 | Human | Colorectum | FAP | 1.84e-38 | -4.60e-01 | -0.1294 |
| 8546 | AP3B1 | A015-C-204 | Human | Colorectum | FAP | 1.25e-02 | -2.52e-01 | -0.0228 |
| 8546 | AP3B1 | A014-C-040 | Human | Colorectum | FAP | 9.50e-03 | -2.96e-01 | -0.1184 |
| 8546 | AP3B1 | A002-C-201 | Human | Colorectum | FAP | 1.70e-13 | -3.77e-01 | 0.0324 |
| 8546 | AP3B1 | A002-C-203 | Human | Colorectum | FAP | 3.61e-08 | -1.99e-01 | 0.2786 |
| 8546 | AP3B1 | A001-C-119 | Human | Colorectum | FAP | 3.74e-03 | -2.52e-01 | -0.1557 |
| 8546 | AP3B1 | A001-C-108 | Human | Colorectum | FAP | 9.69e-21 | -2.00e-01 | -0.0272 |
| 8546 | AP3B1 | A002-C-205 | Human | Colorectum | FAP | 3.60e-19 | -2.84e-01 | -0.1236 |
| Page: 1 2 3 4 5 6 7 8 9 |
| Tissue | Expression Dynamics | Abbreviation |
| Cervix | 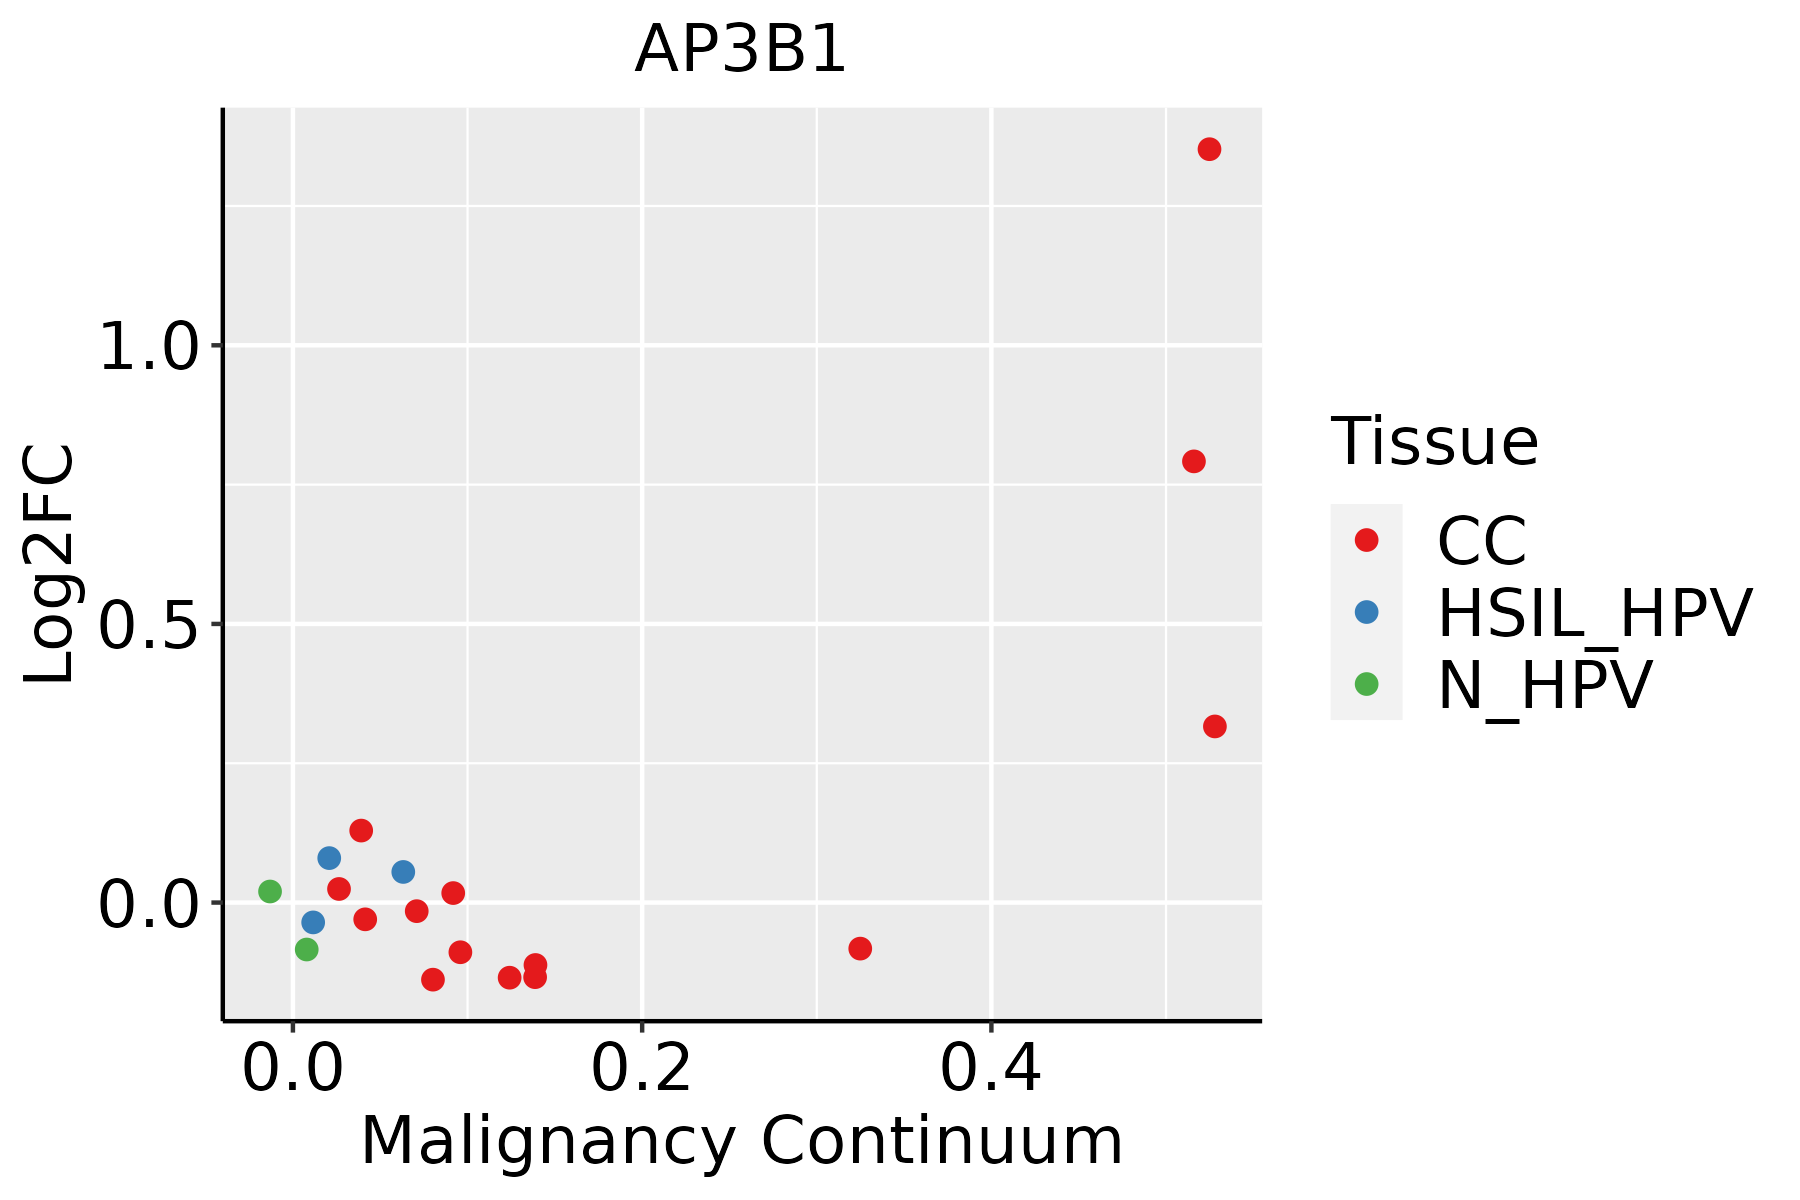 | CC: Cervix cancer |
| HSIL_HPV: HPV-infected high-grade squamous intraepithelial lesions | ||
| N_HPV: HPV-infected normal cervix | ||
| Colorectum (GSE201348) |  | FAP: Familial adenomatous polyposis |
| CRC: Colorectal cancer | ||
| Colorectum (HTA11) |  | AD: Adenomas |
| SER: Sessile serrated lesions | ||
| MSI-H: Microsatellite-high colorectal cancer | ||
| MSS: Microsatellite stable colorectal cancer | ||
| Endometrium | 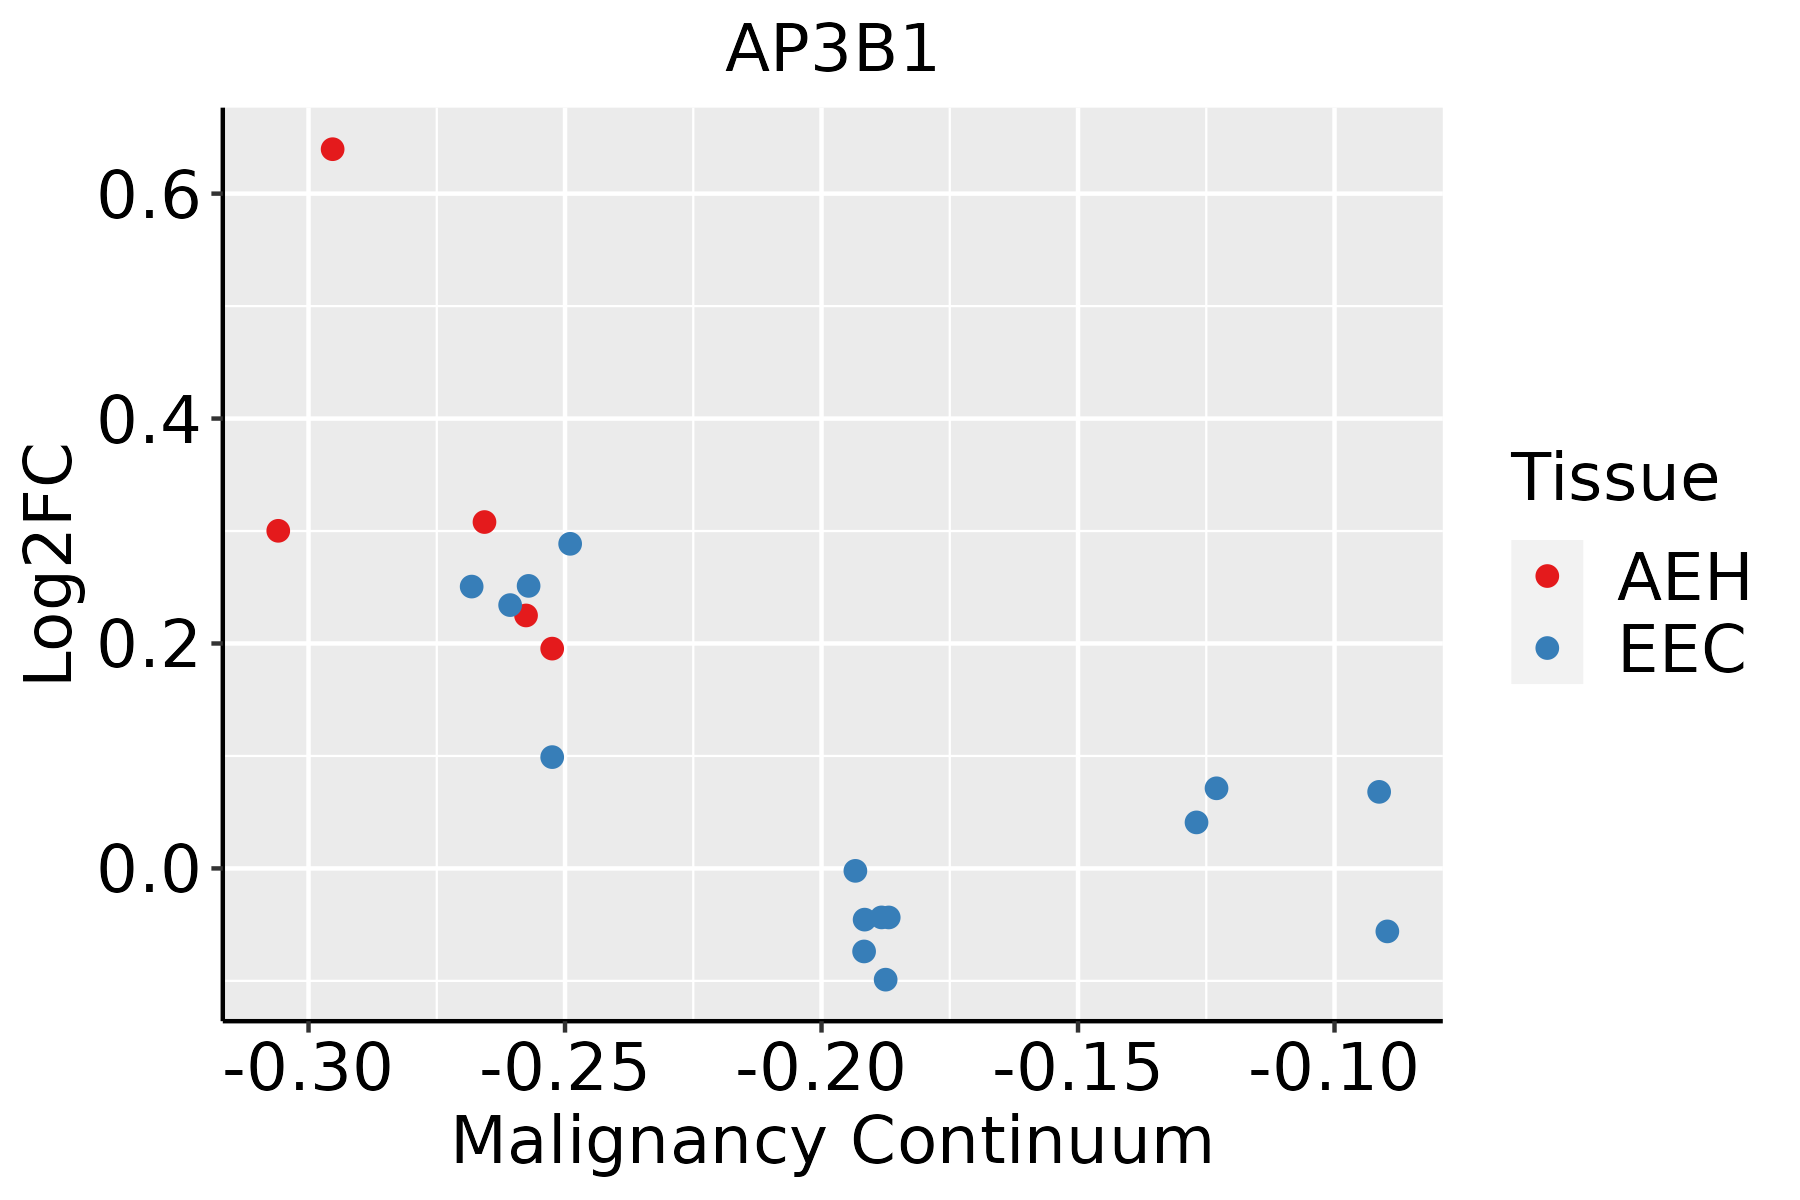 | AEH: Atypical endometrial hyperplasia |
| EEC: Endometrioid Cancer | ||
| Esophagus |  | ESCC: Esophageal squamous cell carcinoma |
| HGIN: High-grade intraepithelial neoplasias | ||
| LGIN: Low-grade intraepithelial neoplasias | ||
| Liver | 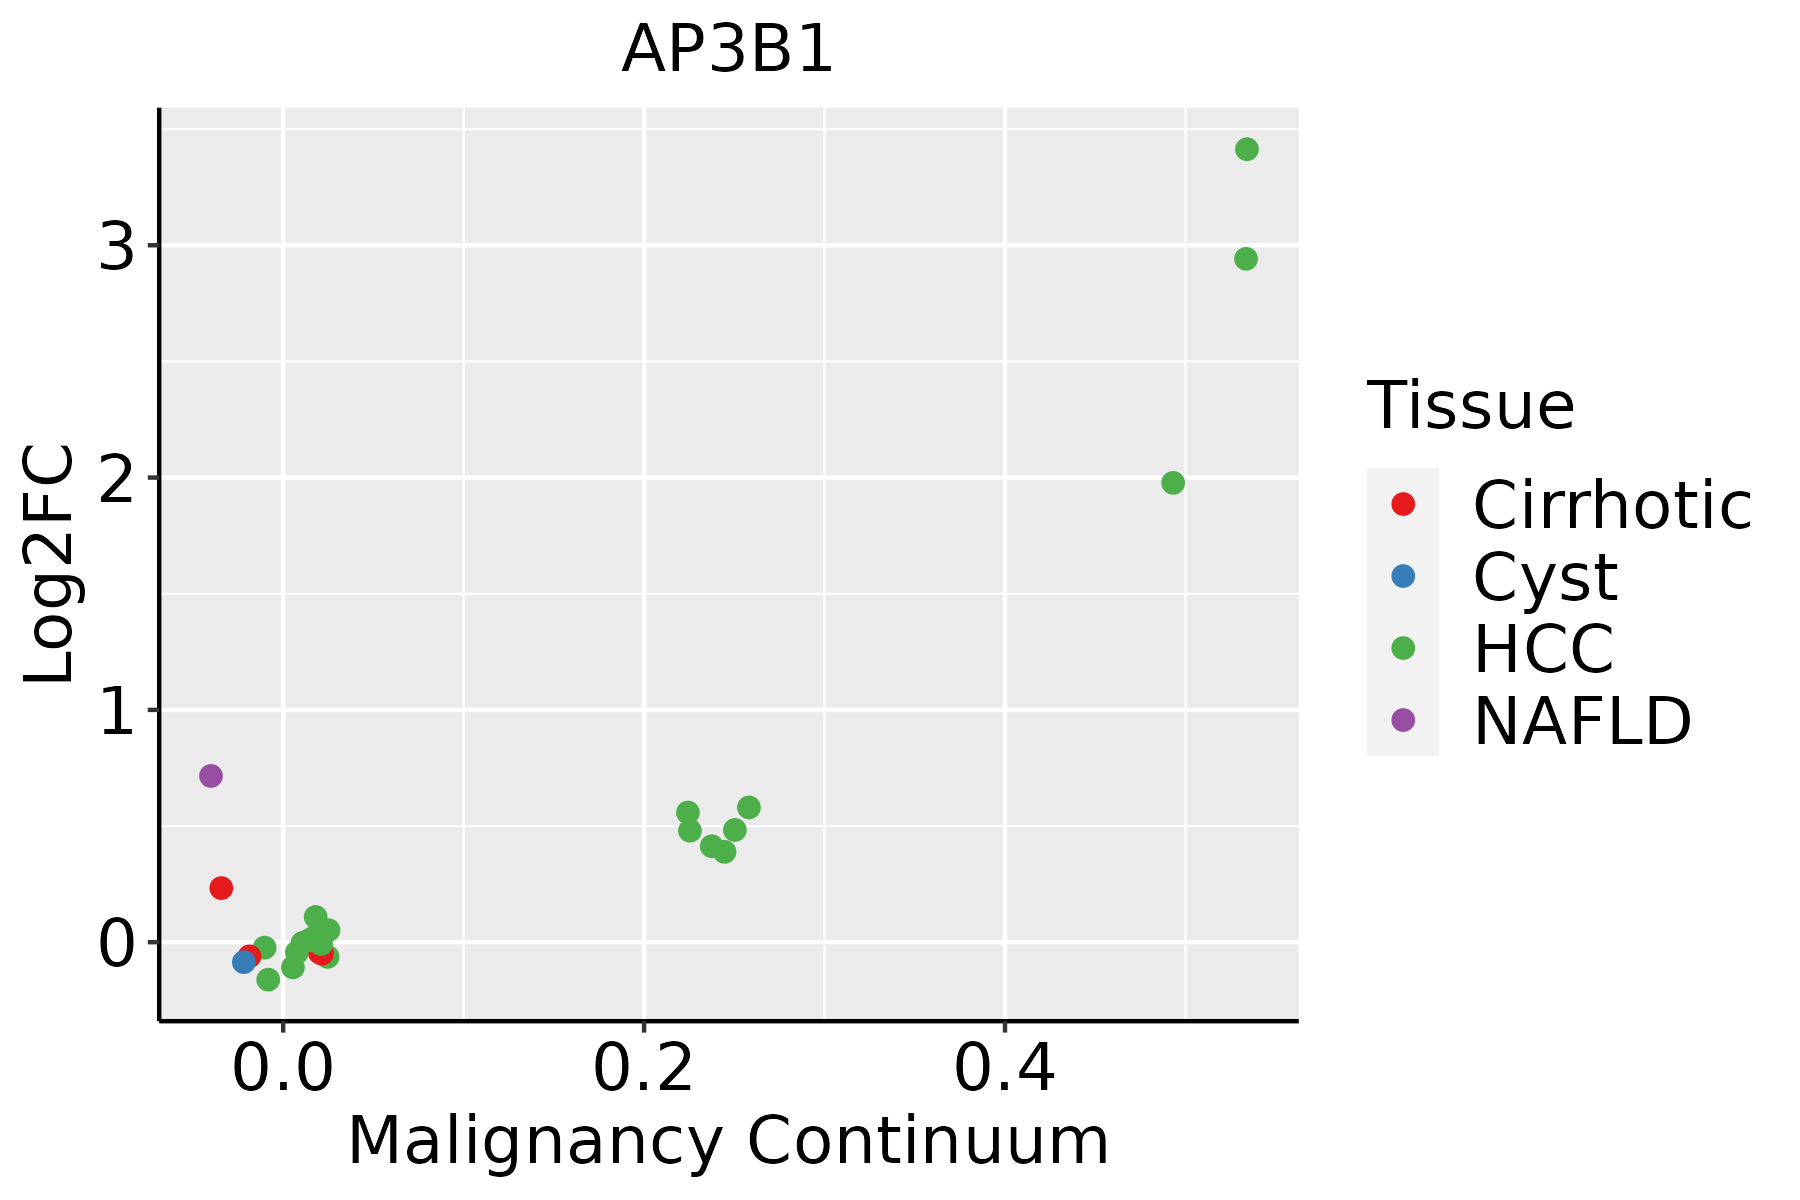 | HCC: Hepatocellular carcinoma |
| NAFLD: Non-alcoholic fatty liver disease | ||
| Lung | 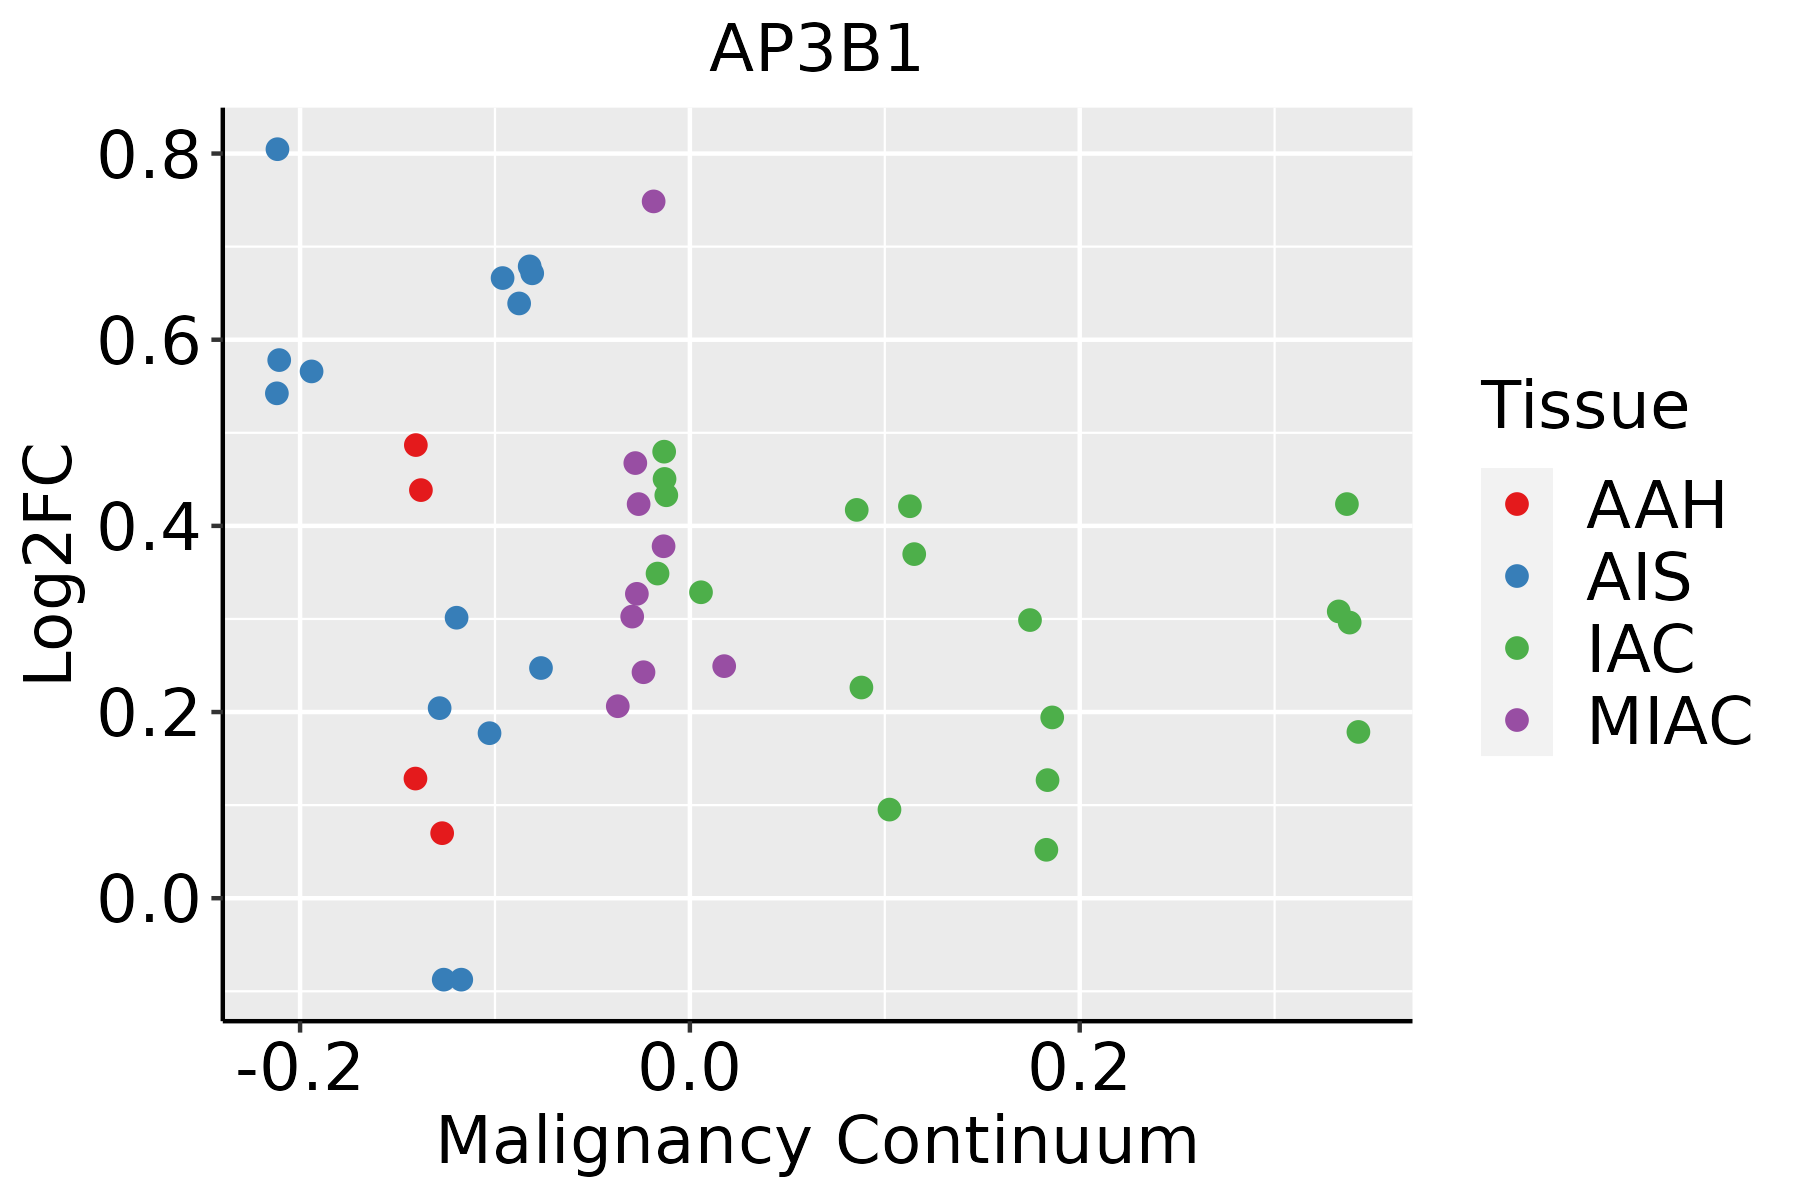 | AAH: Atypical adenomatous hyperplasia |
| AIS: Adenocarcinoma in situ | ||
| IAC: Invasive lung adenocarcinoma | ||
| MIA: Minimally invasive adenocarcinoma | ||
| Oral Cavity | 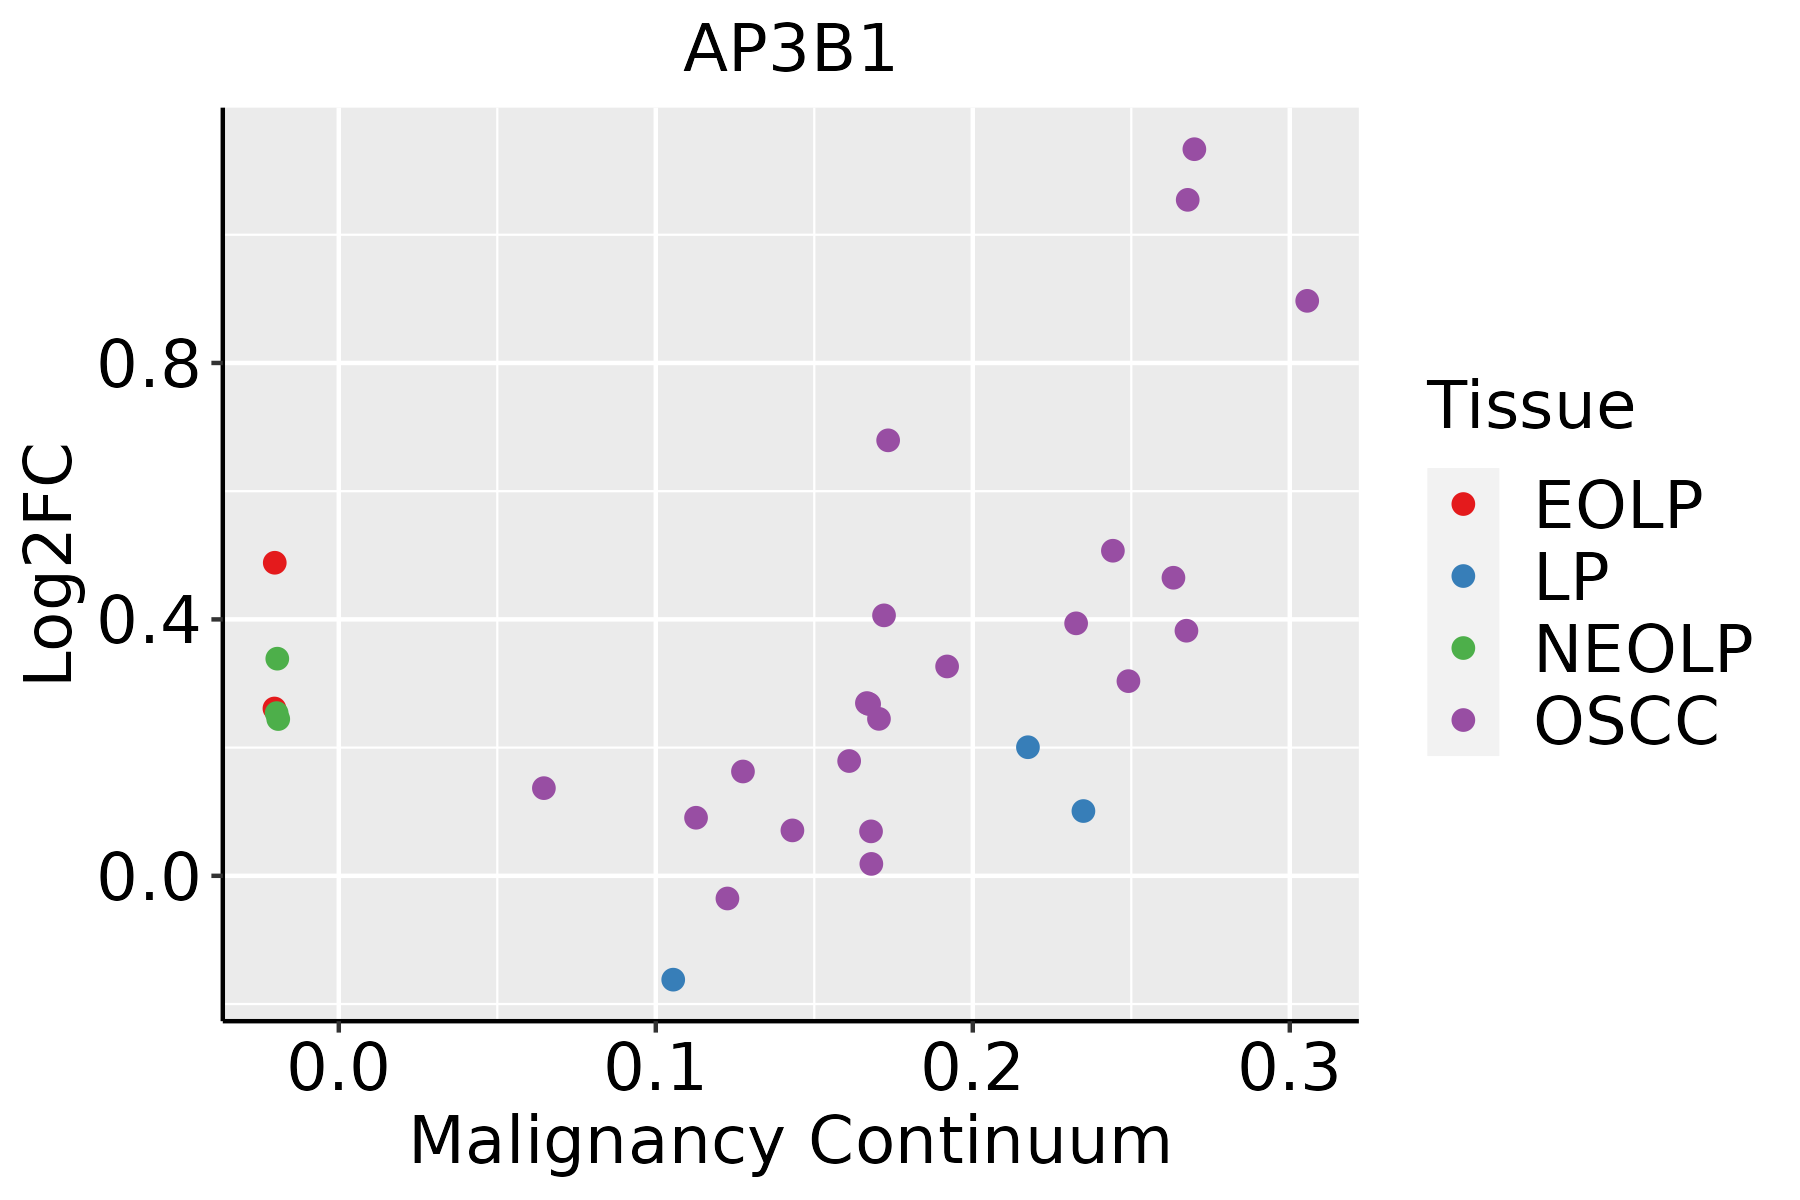 | EOLP: Erosive Oral lichen planus |
| LP: leukoplakia | ||
| NEOLP: Non-erosive oral lichen planus | ||
| OSCC: Oral squamous cell carcinoma | ||
| Skin | 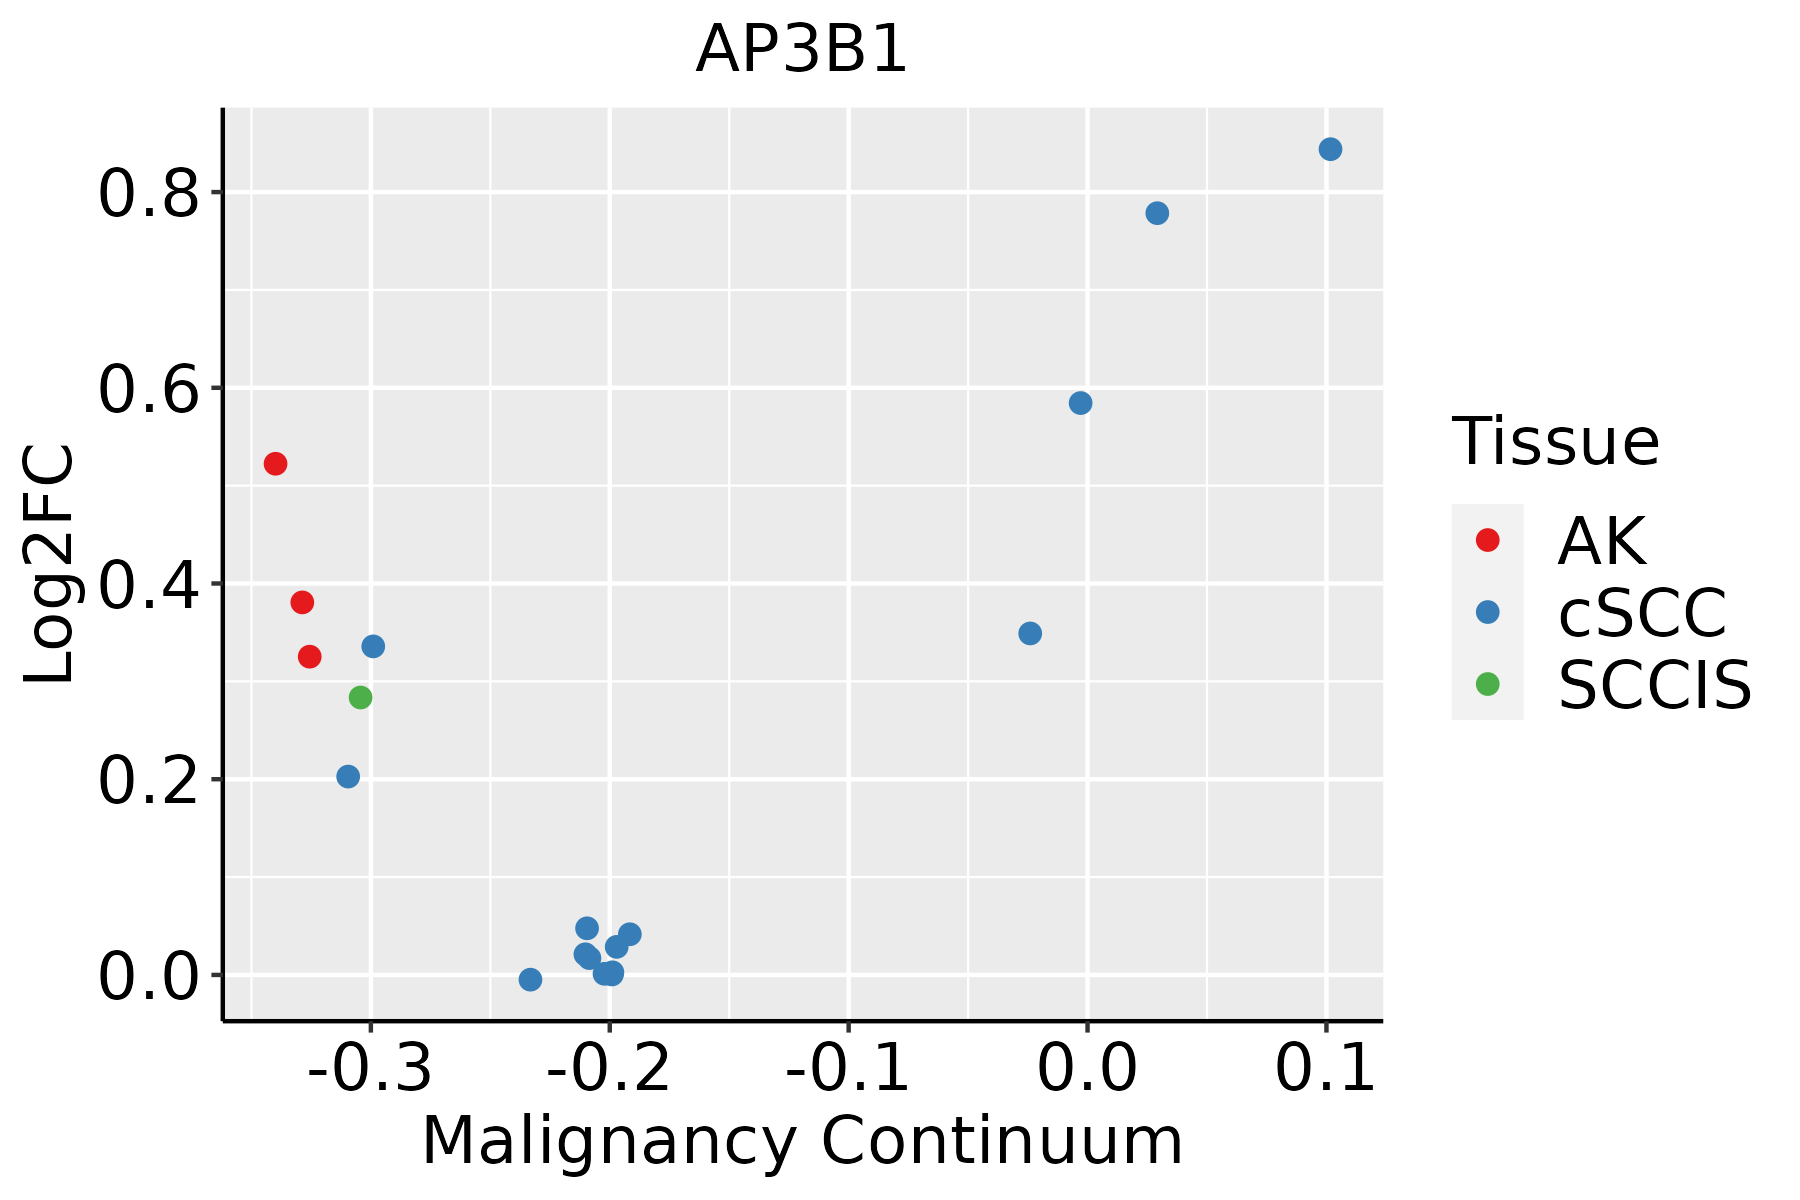 | AK: Actinic keratosis |
| cSCC: Cutaneous squamous cell carcinoma | ||
| SCCIS:squamous cell carcinoma in situ | ||
| Thyroid | 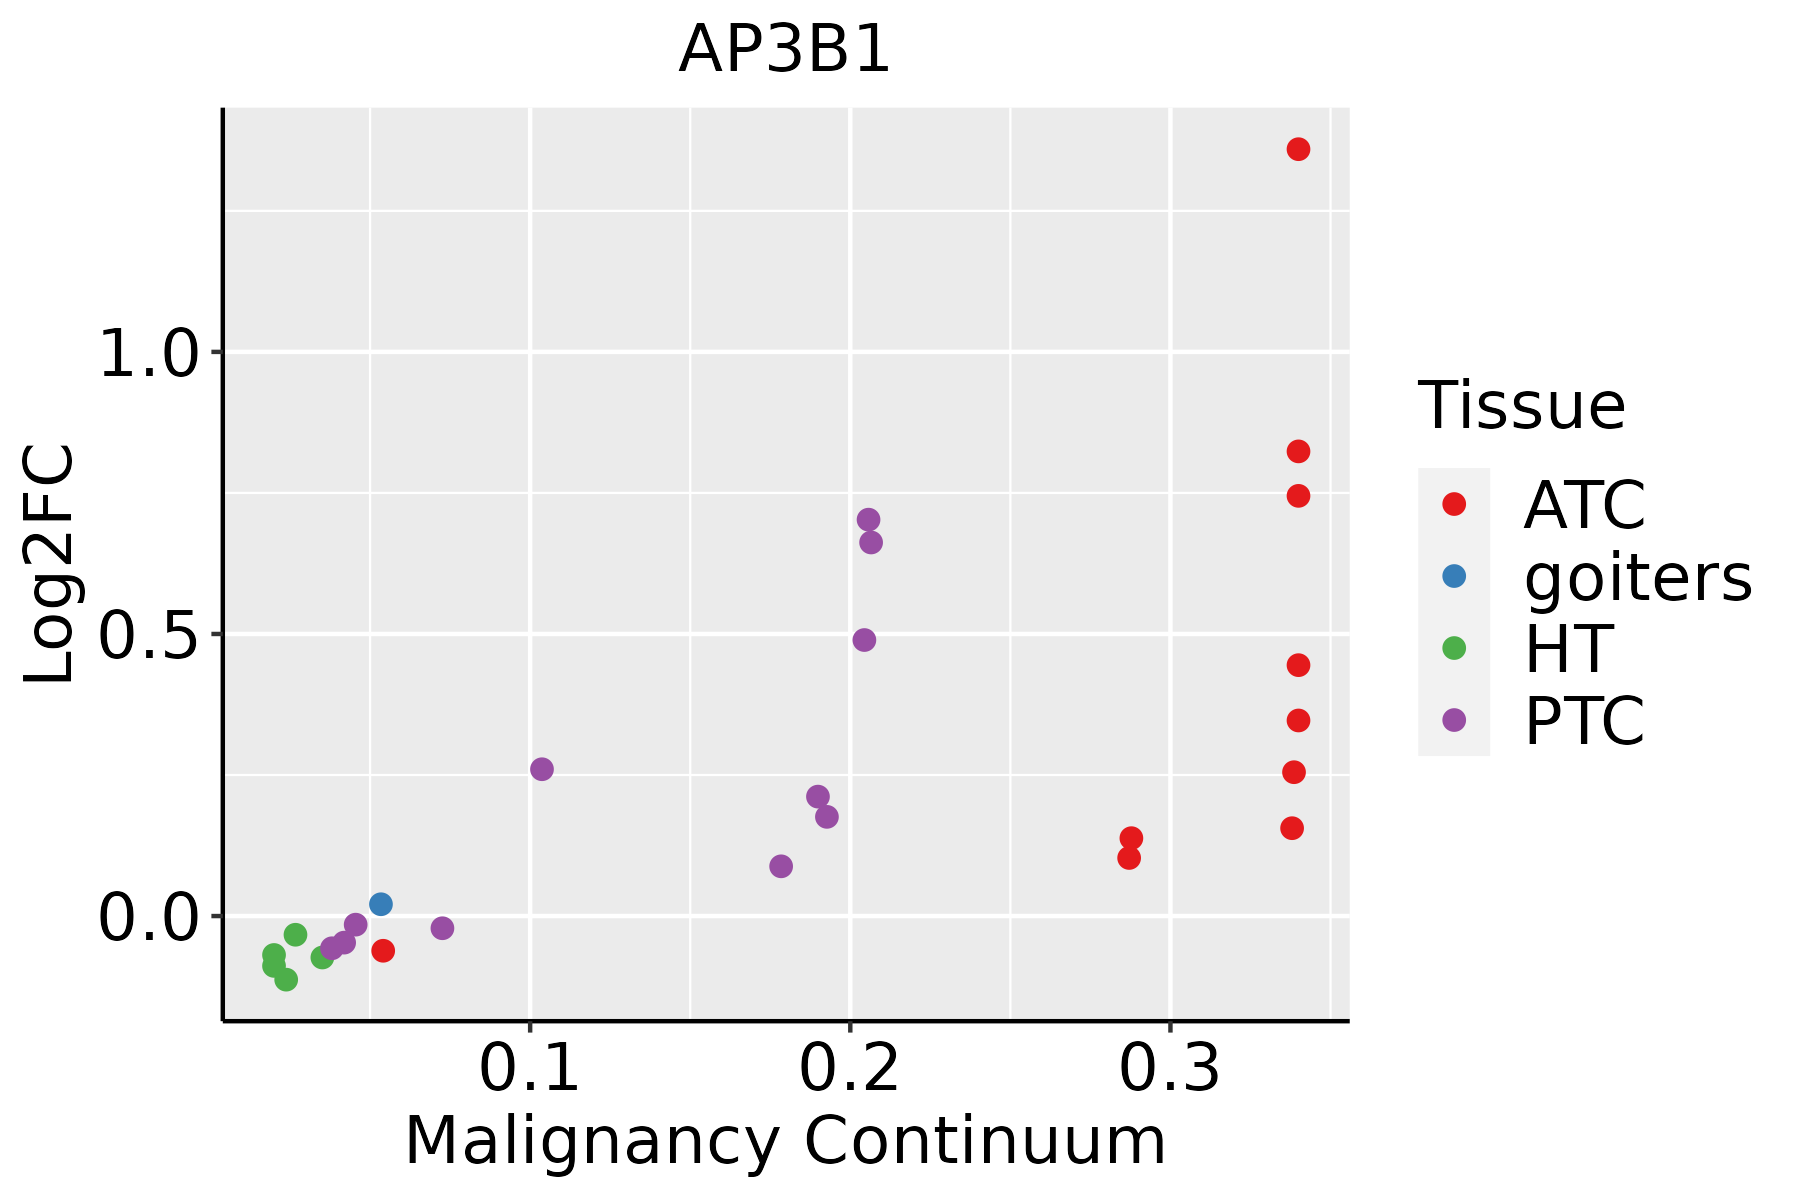 | ATC: Anaplastic thyroid cancer |
| HT: Hashimoto's thyroiditis | ||
| PTC: Papillary thyroid cancer |
| ∗log2FC in expression of this searched gene in stem-like cells from each diseased tissue sample relative to stem-like cells in normal samples in each tissue plotted against the malignancy continuum. Samples are colored based on if they are from different disease stage. |
Top |
Malignant transformation related pathway analysis |
| Find out the enriched GO biological processes and KEGG pathways involved in transition from healthy to precancer to cancer |
| Tissue | Disease Stage | Enriched GO biological Processes |
| Colorectum | AD |  |
| Colorectum | SER |  |
| Colorectum | MSS |  |
| Colorectum | MSI-H |  |
| Colorectum | FAP |  |
| ∗Top 15 enriched GO BP terms are showed in the bar plot of each disease state in each tissue. Each row represents a significant GO biological process which is colored according to the -log10(p.adjust). |
| Page: 1 2 3 4 5 6 7 8 9 |
| GO ID | Tissue | Disease Stage | Description | Gene Ratio | Bg Ratio | pvalue | p.adjust | Count |
| GO:003032315 | Oral cavity | NEOLP | respiratory tube development | 33/2005 | 181/18723 | 1.58e-03 | 1.11e-02 | 33 |
| GO:009911111 | Oral cavity | NEOLP | microtubule-based transport | 34/2005 | 190/18723 | 1.87e-03 | 1.28e-02 | 34 |
| GO:190210523 | Oral cavity | NEOLP | regulation of leukocyte differentiation | 46/2005 | 279/18723 | 1.98e-03 | 1.33e-02 | 46 |
| GO:003021721 | Oral cavity | NEOLP | T cell differentiation | 43/2005 | 257/18723 | 2.05e-03 | 1.36e-02 | 43 |
| GO:00022242 | Oral cavity | NEOLP | toll-like receptor signaling pathway | 24/2005 | 121/18723 | 2.08e-03 | 1.38e-02 | 24 |
| GO:190210721 | Oral cavity | NEOLP | positive regulation of leukocyte differentiation | 29/2005 | 157/18723 | 2.40e-03 | 1.53e-02 | 29 |
| GO:190370821 | Oral cavity | NEOLP | positive regulation of hemopoiesis | 29/2005 | 157/18723 | 2.40e-03 | 1.53e-02 | 29 |
| GO:00456211 | Oral cavity | NEOLP | positive regulation of lymphocyte differentiation | 21/2005 | 104/18723 | 3.07e-03 | 1.87e-02 | 21 |
| GO:006054114 | Oral cavity | NEOLP | respiratory system development | 35/2005 | 203/18723 | 3.08e-03 | 1.88e-02 | 35 |
| GO:004561921 | Oral cavity | NEOLP | regulation of lymphocyte differentiation | 31/2005 | 174/18723 | 3.10e-03 | 1.89e-02 | 31 |
| GO:007238431 | Oral cavity | NEOLP | organelle transport along microtubule | 18/2005 | 85/18723 | 3.45e-03 | 2.05e-02 | 18 |
| GO:003032416 | Oral cavity | NEOLP | lung development | 31/2005 | 177/18723 | 4.04e-03 | 2.30e-02 | 31 |
| GO:000704131 | Oral cavity | NEOLP | lysosomal transport | 22/2005 | 114/18723 | 4.42e-03 | 2.49e-02 | 22 |
| GO:007058532 | Oral cavity | NEOLP | protein localization to mitochondrion | 23/2005 | 125/18723 | 6.70e-03 | 3.42e-02 | 23 |
| GO:009893021 | Oral cavity | NEOLP | axonal transport | 14/2005 | 64/18723 | 6.92e-03 | 3.51e-02 | 14 |
| GO:000660532 | Oral cavity | NEOLP | protein targeting | 48/2005 | 314/18723 | 7.23e-03 | 3.66e-02 | 48 |
| GO:005125113 | Oral cavity | NEOLP | positive regulation of lymphocyte activation | 54/2005 | 362/18723 | 7.55e-03 | 3.77e-02 | 54 |
| GO:006146221 | Oral cavity | NEOLP | protein localization to lysosome | 11/2005 | 46/18723 | 7.99e-03 | 3.95e-02 | 11 |
| GO:007265532 | Oral cavity | NEOLP | establishment of protein localization to mitochondrion | 22/2005 | 120/18723 | 8.23e-03 | 4.04e-02 | 22 |
| GO:009951821 | Oral cavity | NEOLP | vesicle cytoskeletal trafficking | 15/2005 | 73/18723 | 9.60e-03 | 4.53e-02 | 15 |
| Page: 1 2 3 4 5 6 7 8 9 10 11 12 13 14 15 16 17 18 19 20 21 22 23 24 25 26 27 28 29 30 31 32 33 34 35 36 37 38 39 40 41 42 43 44 45 46 47 48 49 50 51 52 |
| Pathway ID | Tissue | Disease Stage | Description | Gene Ratio | Bg Ratio | pvalue | p.adjust | qvalue | Count |
| hsa0414222 | Esophagus | ESCC | Lysosome | 102/4205 | 132/8465 | 5.11e-11 | 7.13e-10 | 3.65e-10 | 102 |
| hsa0414232 | Esophagus | ESCC | Lysosome | 102/4205 | 132/8465 | 5.11e-11 | 7.13e-10 | 3.65e-10 | 102 |
| hsa041422 | Liver | HCC | Lysosome | 100/4020 | 132/8465 | 2.32e-11 | 4.31e-10 | 2.40e-10 | 100 |
| hsa041423 | Liver | HCC | Lysosome | 100/4020 | 132/8465 | 2.32e-11 | 4.31e-10 | 2.40e-10 | 100 |
| hsa041425 | Oral cavity | OSCC | Lysosome | 87/3704 | 132/8465 | 1.97e-07 | 1.35e-06 | 6.86e-07 | 87 |
| hsa0414212 | Oral cavity | OSCC | Lysosome | 87/3704 | 132/8465 | 1.97e-07 | 1.35e-06 | 6.86e-07 | 87 |
| Page: 1 |
Top |
Cell-cell communication analysis |
| Identification of potential cell-cell interactions between two cell types and their ligand-receptor pairs for different disease states |
| Ligand | Receptor | LRpair | Pathway | Tissue | Disease Stage |
| Page: 1 |
Top |
Single-cell gene regulatory network inference analysis |
| Find out the significant the regulons (TFs) and the target genes of each regulon across cell types for different disease states |
| TF | Cell Type | Tissue | Disease Stage | Target Gene | RSS | Regulon Activity |
| ∗The dot plots of a searched regulon are shown for all cell subpopulations in each disease state of each tissue based on the regulon specific score inferred using pySCENIC and by calculating the average expression. |
| Page: 1 |
Top |
Somatic mutation of malignant transformation related genes |
| Annotation of somatic variants for genes involved in malignant transformation |
| Hugo Symbol | Variant Class | Variant Classification | dbSNP RS | HGVSc | HGVSp | HGVSp Short | SWISSPROT | BIOTYPE | SIFT | PolyPhen | Tumor Sample Barcode | Tissue | Histology | Sex | Age | Stage | Therapy Types | Drugs | Outcome |
| AP3B1 | SNV | Missense_Mutation | rs757690159 | c.3085N>T | p.Val1029Leu | p.V1029L | O00203 | protein_coding | tolerated(0.12) | benign(0.007) | TCGA-A8-A09V-01 | Breast | breast invasive carcinoma | Female | <65 | I/II | Hormone Therapy | tamoxiphen | SD |
| AP3B1 | SNV | Missense_Mutation | rs758805835 | c.1331A>G | p.Asn444Ser | p.N444S | O00203 | protein_coding | tolerated(0.28) | benign(0.006) | TCGA-A8-A0A2-01 | Breast | breast invasive carcinoma | Female | >=65 | I/II | Hormone Therapy | tamoxiphen | SD |
| AP3B1 | SNV | Missense_Mutation | c.356N>G | p.Thr119Ser | p.T119S | O00203 | protein_coding | tolerated(0.05) | benign(0.19) | TCGA-B6-A0X5-01 | Breast | breast invasive carcinoma | Female | <65 | I/II | Unknown | Unknown | PD | |
| AP3B1 | SNV | Missense_Mutation | c.1846C>T | p.His616Tyr | p.H616Y | O00203 | protein_coding | deleterious(0) | possibly_damaging(0.474) | TCGA-BH-A0DK-01 | Breast | breast invasive carcinoma | Female | <65 | I/II | Hormone Therapy | tamoxiphen | SD | |
| AP3B1 | SNV | Missense_Mutation | novel | c.2479N>T | p.Val827Leu | p.V827L | O00203 | protein_coding | tolerated(0.23) | benign(0.017) | TCGA-BH-A0DQ-01 | Breast | breast invasive carcinoma | Female | <65 | I/II | Chemotherapy | doxorubicin | SD |
| AP3B1 | SNV | Missense_Mutation | novel | c.334N>T | p.Leu112Phe | p.L112F | O00203 | protein_coding | deleterious(0.01) | probably_damaging(0.979) | TCGA-D8-A1XM-01 | Breast | breast invasive carcinoma | Female | <65 | I/II | Unknown | Unknown | SD |
| AP3B1 | SNV | Missense_Mutation | rs367631130 | c.680N>A | p.Arg227His | p.R227H | O00203 | protein_coding | deleterious(0) | probably_damaging(0.969) | TCGA-D8-A1XY-01 | Breast | breast invasive carcinoma | Female | >=65 | I/II | Chemotherapy | tamoxiphen | SD |
| AP3B1 | SNV | Missense_Mutation | novel | c.3248T>C | p.Leu1083Pro | p.L1083P | O00203 | protein_coding | deleterious(0) | probably_damaging(0.998) | TCGA-2W-A8YY-01 | Cervix | cervical & endocervical cancer | Female | <65 | I/II | Chemotherapy | cisplatin | CR |
| AP3B1 | SNV | Missense_Mutation | novel | c.2543G>A | p.Gly848Asp | p.G848D | O00203 | protein_coding | deleterious(0.03) | probably_damaging(0.998) | TCGA-2W-A8YY-01 | Cervix | cervical & endocervical cancer | Female | <65 | I/II | Chemotherapy | cisplatin | CR |
| AP3B1 | SNV | Missense_Mutation | novel | c.2294N>T | p.Ser765Leu | p.S765L | O00203 | protein_coding | deleterious(0.01) | benign(0.011) | TCGA-C5-A2LZ-01 | Cervix | cervical & endocervical cancer | Female | >=65 | III/IV | Unknown | Unknown | PD |
| Page: 1 2 3 4 5 6 7 8 9 10 11 12 |
Top |
Related drugs of malignant transformation related genes |
| Identification of chemicals and drugs interact with genes involved in malignant transfromation |
| (DGIdb 4.0) |
| Entrez ID | Symbol | Category | Interaction Types | Drug Claim Name | Drug Name | PMIDs |
| Page: 1 |

Copyright 2023-Present -The University of Texas Health Science Center at Houston |