
|
|||||
|
 | |
| |
| |
| |
| |
| |
|
Gene: YWHAE |
Gene summary for YWHAE |
| Gene information | Species | Human | Gene symbol | YWHAE | Gene ID | 7531 |
| Gene name | tyrosine 3-monooxygenase/tryptophan 5-monooxygenase activation protein epsilon | |
| Gene Alias | 14-3-3E | |
| Cytomap | 17p13.3 | |
| Gene Type | protein-coding | GO ID | GO:0000165 | UniProtAcc | P62258 |
Top |
Malignant transformation analysis |
| Identification of the aberrant gene expression in precancerous and cancerous lesions by comparing the gene expression of stem-like cells in diseased tissues with normal stem cells |
| Entrez ID | Symbol | Replicates | Species | Organ | Tissue | Adj P-value | Log2FC | Malignancy |
| 7531 | YWHAE | GSM4909280 | Human | Breast | Precancer | 1.65e-02 | -5.49e-01 | 0.0305 |
| 7531 | YWHAE | GSM4909282 | Human | Breast | IDC | 3.31e-02 | -2.85e-01 | -0.0288 |
| 7531 | YWHAE | GSM4909285 | Human | Breast | IDC | 3.75e-14 | -3.63e-01 | 0.21 |
| 7531 | YWHAE | GSM4909286 | Human | Breast | IDC | 6.26e-24 | -4.76e-01 | 0.1081 |
| 7531 | YWHAE | GSM4909288 | Human | Breast | IDC | 4.07e-04 | -4.82e-01 | 0.0988 |
| 7531 | YWHAE | GSM4909291 | Human | Breast | IDC | 1.10e-07 | -4.61e-01 | 0.1753 |
| 7531 | YWHAE | GSM4909294 | Human | Breast | IDC | 1.78e-10 | -2.63e-01 | 0.2022 |
| 7531 | YWHAE | GSM4909296 | Human | Breast | IDC | 1.17e-26 | -5.40e-01 | 0.1524 |
| 7531 | YWHAE | GSM4909297 | Human | Breast | IDC | 1.32e-33 | 2.75e-02 | 0.1517 |
| 7531 | YWHAE | GSM4909301 | Human | Breast | IDC | 3.11e-05 | 3.55e-02 | 0.1577 |
| 7531 | YWHAE | GSM4909302 | Human | Breast | IDC | 2.89e-03 | -2.37e-01 | 0.1545 |
| 7531 | YWHAE | GSM4909309 | Human | Breast | IDC | 5.79e-07 | -3.23e-01 | 0.0483 |
| 7531 | YWHAE | GSM4909311 | Human | Breast | IDC | 4.61e-66 | -6.98e-01 | 0.1534 |
| 7531 | YWHAE | GSM4909312 | Human | Breast | IDC | 1.28e-18 | -3.39e-01 | 0.1552 |
| 7531 | YWHAE | GSM4909313 | Human | Breast | IDC | 2.59e-05 | 9.75e-03 | 0.0391 |
| 7531 | YWHAE | GSM4909315 | Human | Breast | IDC | 3.81e-03 | -1.25e-01 | 0.21 |
| 7531 | YWHAE | GSM4909316 | Human | Breast | IDC | 1.88e-02 | -2.34e-01 | 0.21 |
| 7531 | YWHAE | GSM4909318 | Human | Breast | IDC | 2.96e-03 | 2.02e-01 | 0.2031 |
| 7531 | YWHAE | GSM4909319 | Human | Breast | IDC | 1.56e-81 | -7.43e-01 | 0.1563 |
| 7531 | YWHAE | GSM4909320 | Human | Breast | IDC | 3.62e-09 | -4.48e-01 | 0.1575 |
| Page: 1 2 3 4 5 6 7 8 9 10 11 12 13 14 15 |
| Tissue | Expression Dynamics | Abbreviation |
| Breast | 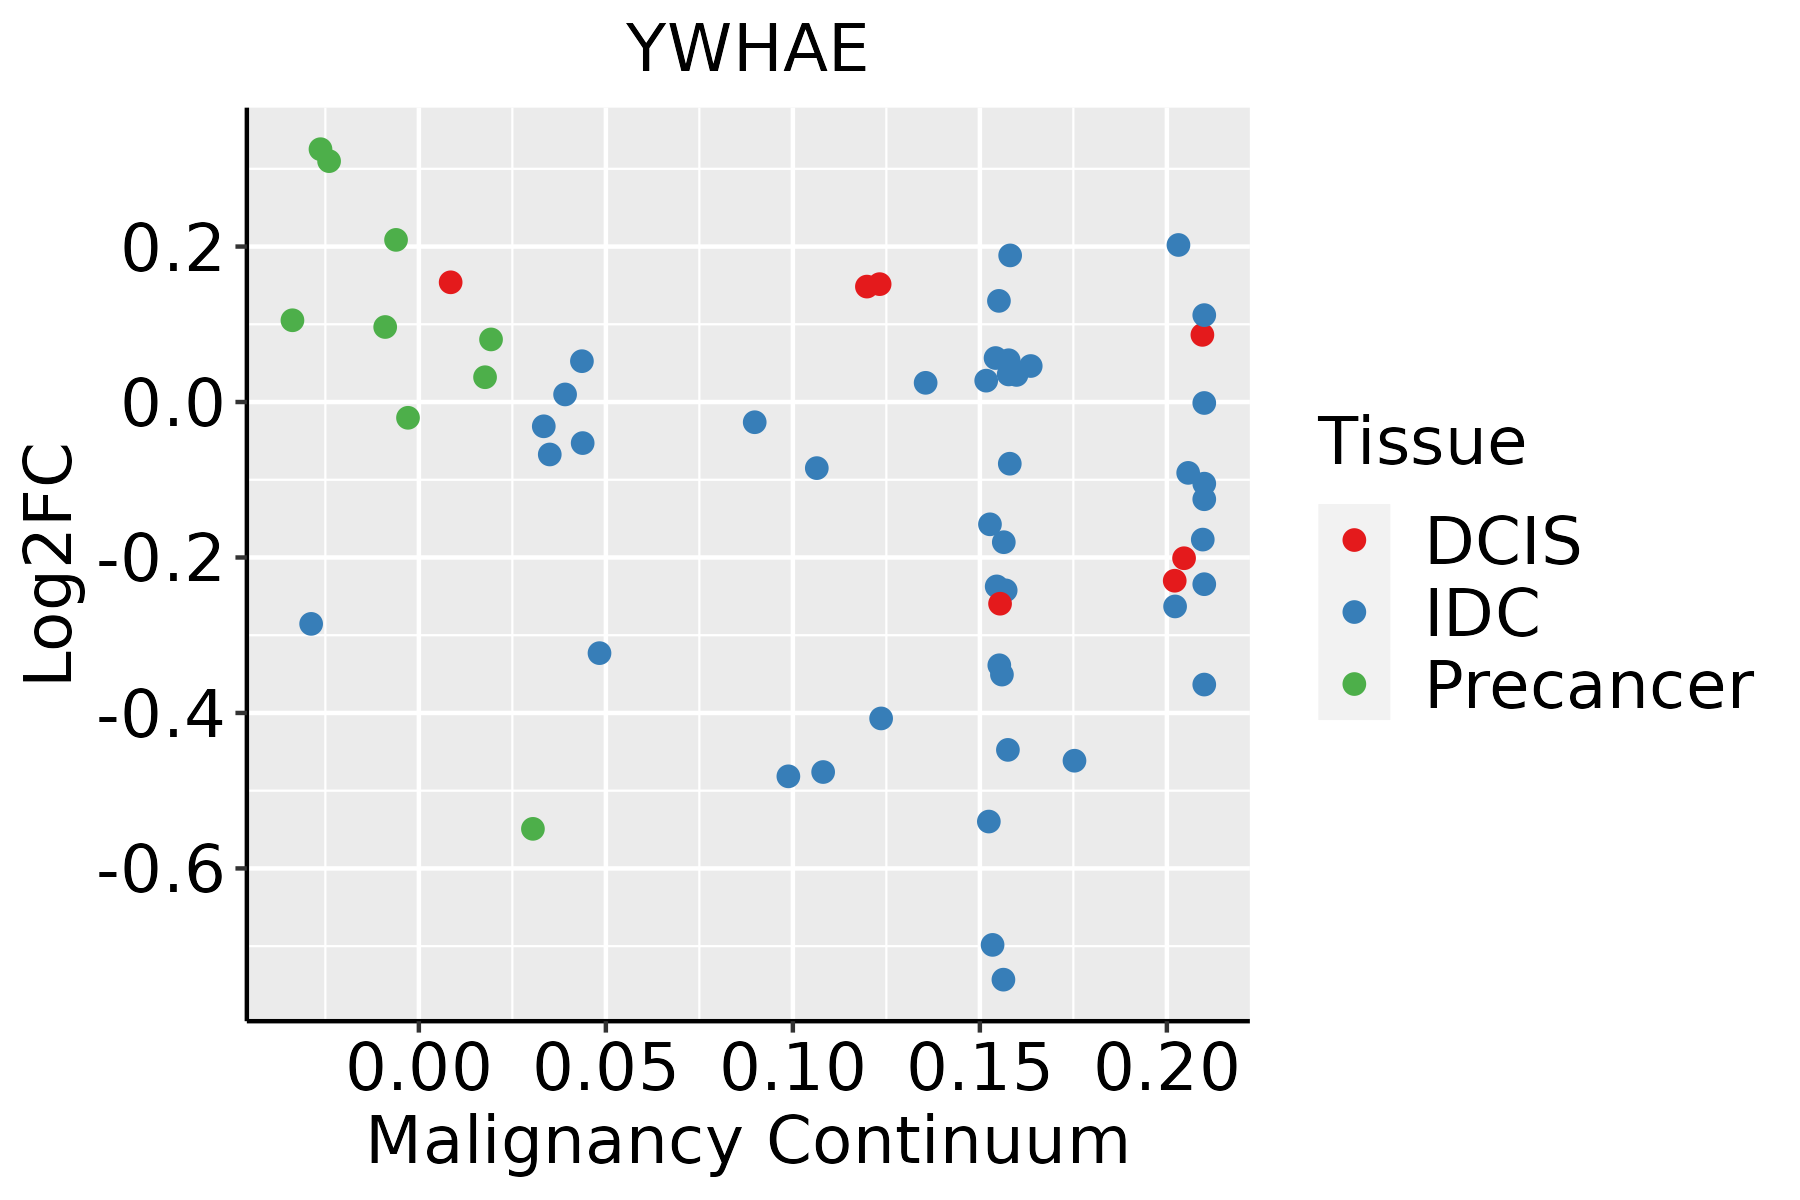 | IDC: Invasive ductal carcinoma |
| DCIS: Ductal carcinoma in situ | ||
| Precancer(BRCA1-mut): Precancerous lesion from BRCA1 mutation carriers | ||
| Colorectum (GSE201348) |  | FAP: Familial adenomatous polyposis |
| CRC: Colorectal cancer | ||
| Colorectum (HTA11) |  | AD: Adenomas |
| SER: Sessile serrated lesions | ||
| MSI-H: Microsatellite-high colorectal cancer | ||
| MSS: Microsatellite stable colorectal cancer | ||
| Endometrium |  | AEH: Atypical endometrial hyperplasia |
| EEC: Endometrioid Cancer | ||
| Esophagus |  | ESCC: Esophageal squamous cell carcinoma |
| HGIN: High-grade intraepithelial neoplasias | ||
| LGIN: Low-grade intraepithelial neoplasias | ||
| Liver | 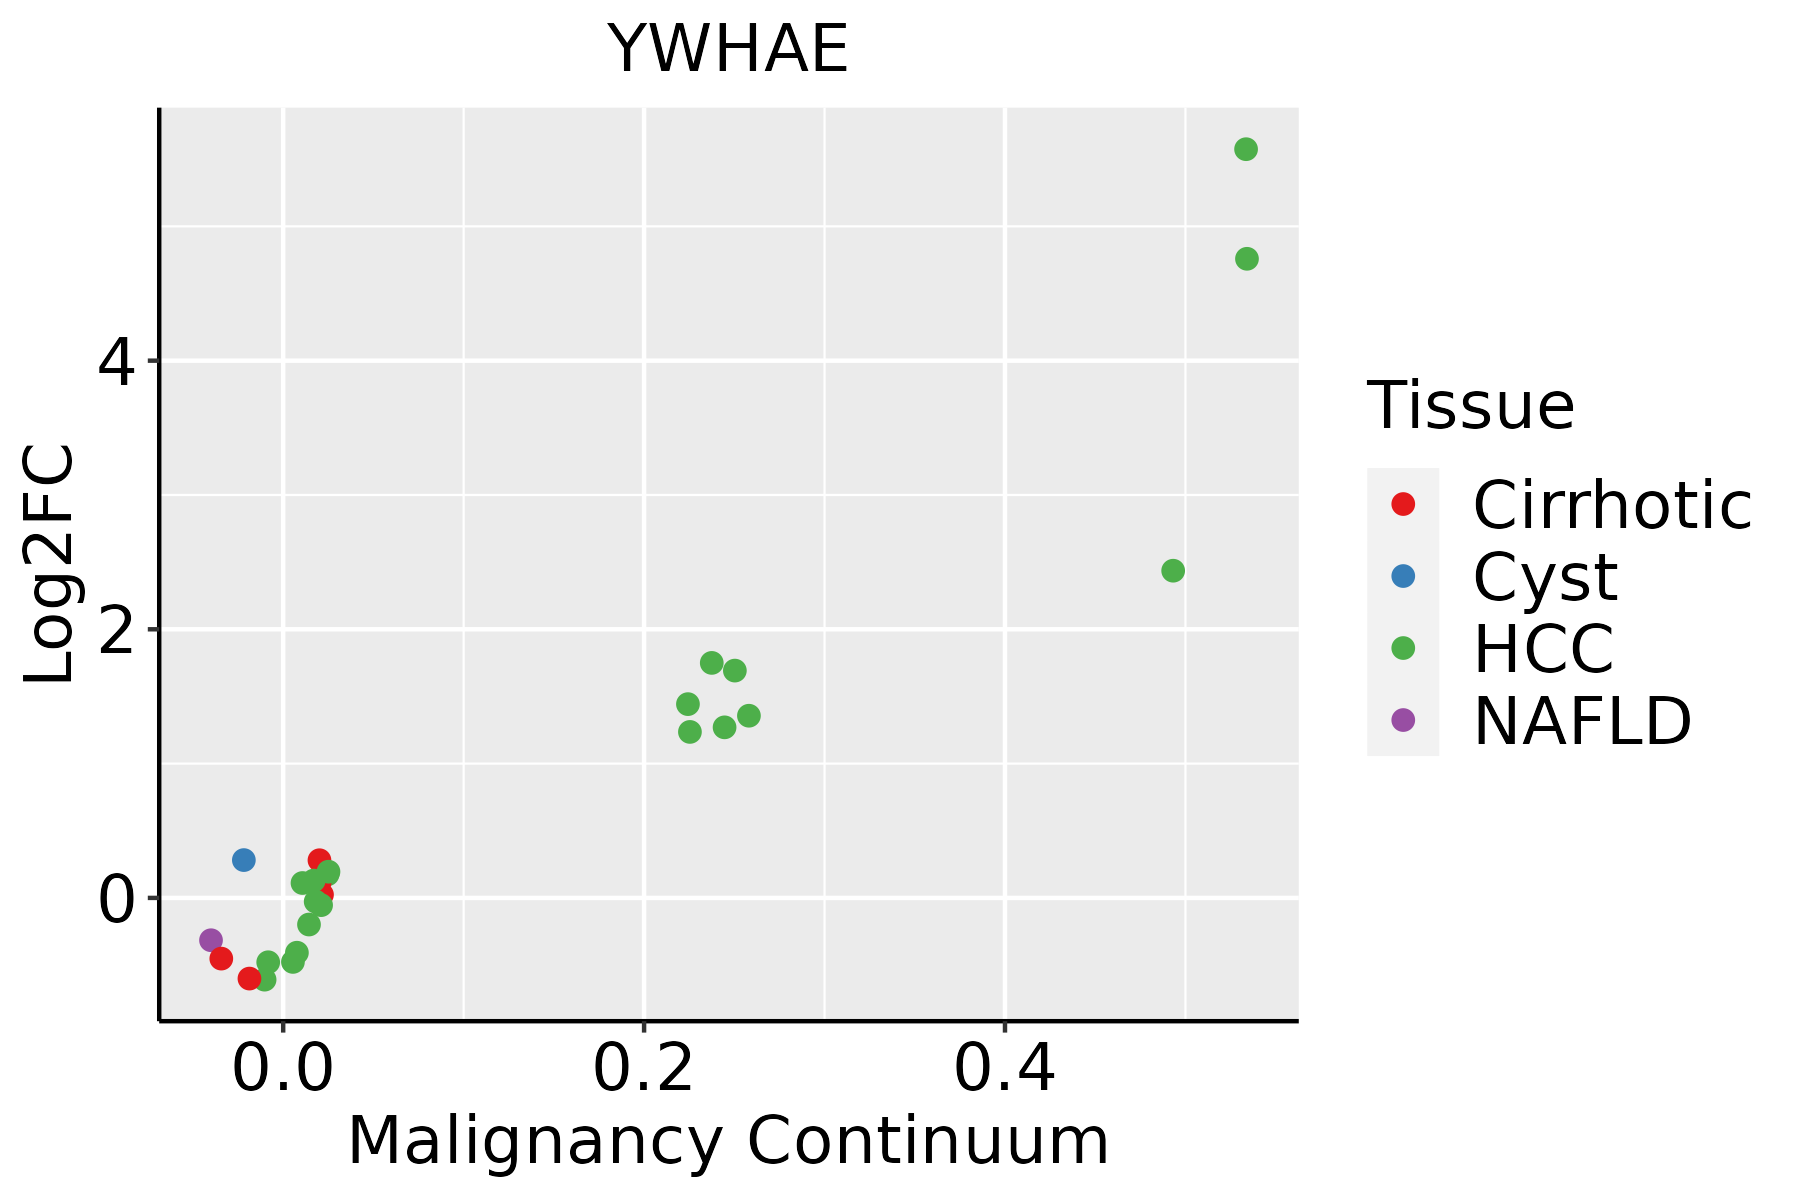 | HCC: Hepatocellular carcinoma |
| NAFLD: Non-alcoholic fatty liver disease | ||
| Lung | 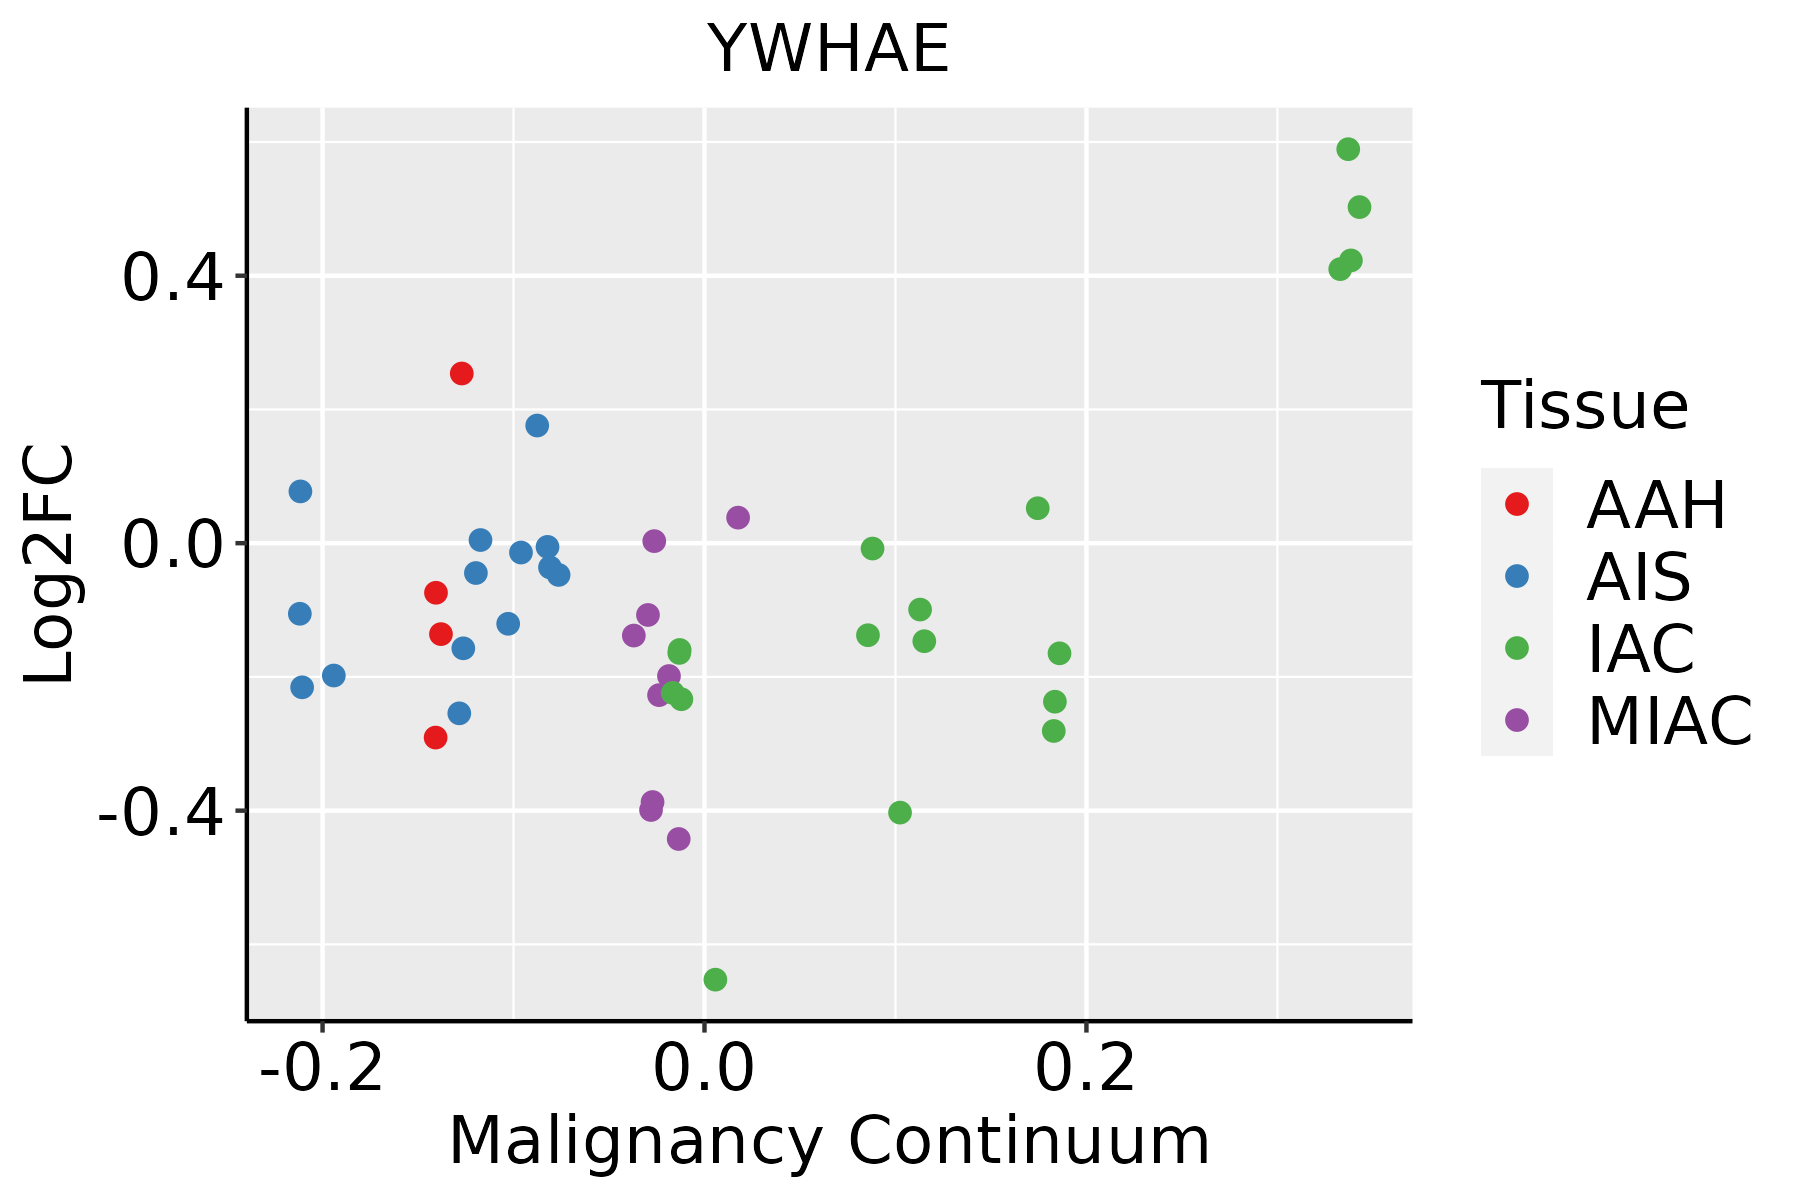 | AAH: Atypical adenomatous hyperplasia |
| AIS: Adenocarcinoma in situ | ||
| IAC: Invasive lung adenocarcinoma | ||
| MIA: Minimally invasive adenocarcinoma | ||
| Oral Cavity | 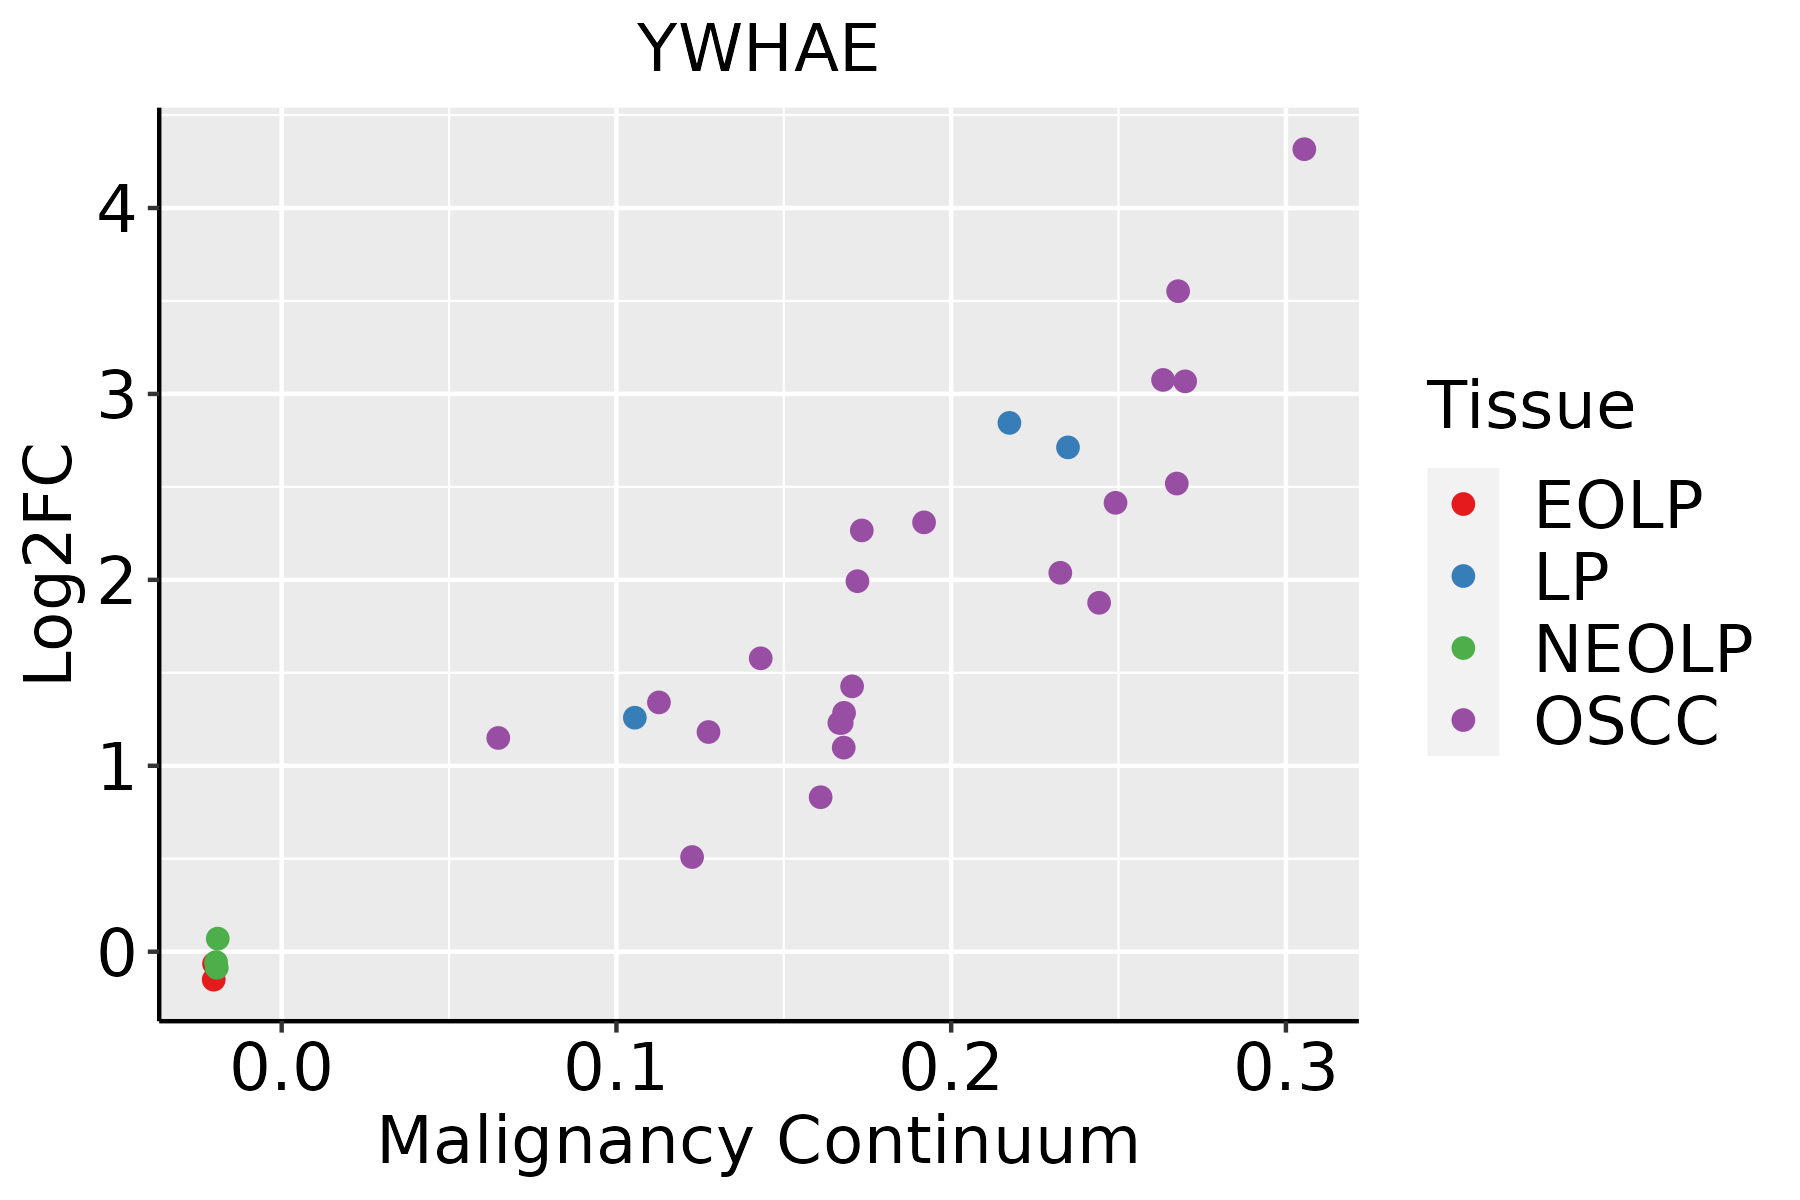 | EOLP: Erosive Oral lichen planus |
| LP: leukoplakia | ||
| NEOLP: Non-erosive oral lichen planus | ||
| OSCC: Oral squamous cell carcinoma | ||
| Prostate | 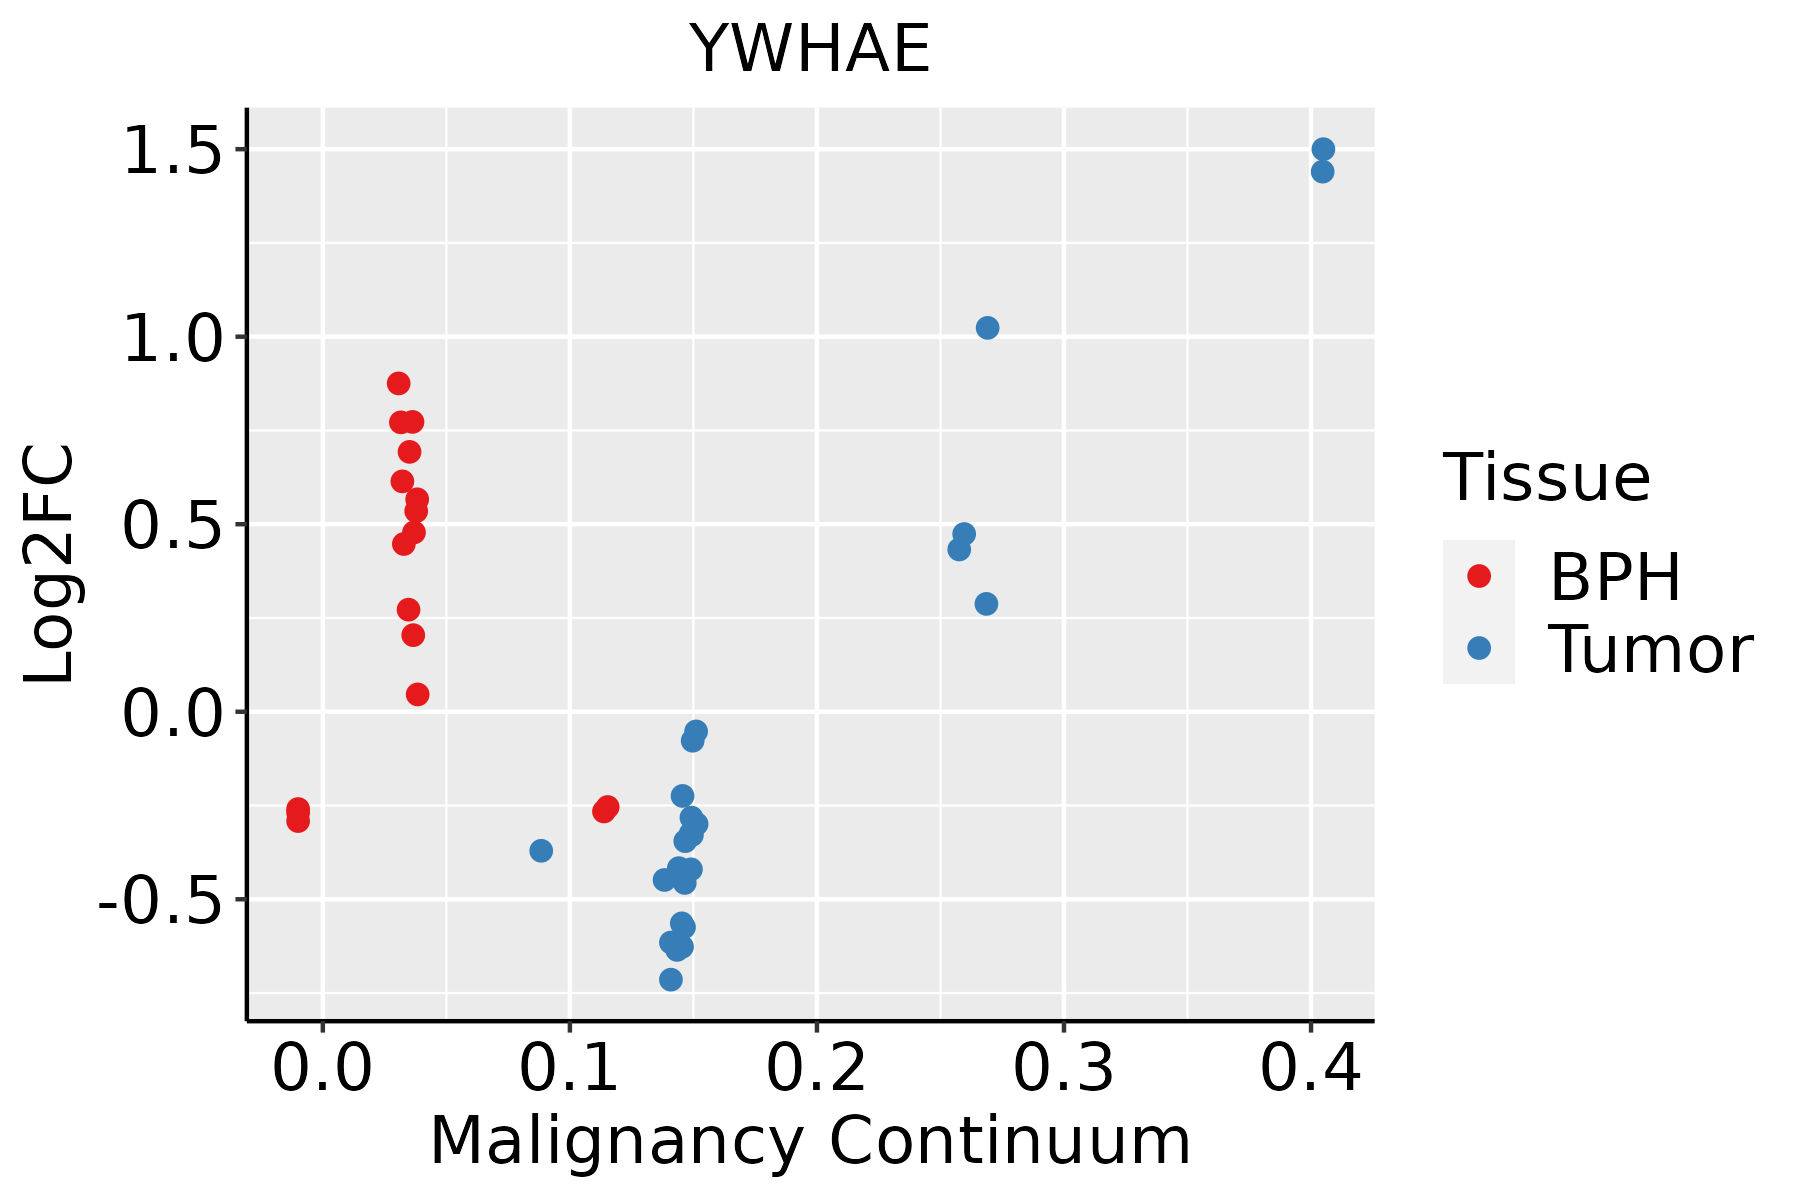 | BPH: Benign Prostatic Hyperplasia |
| Skin | 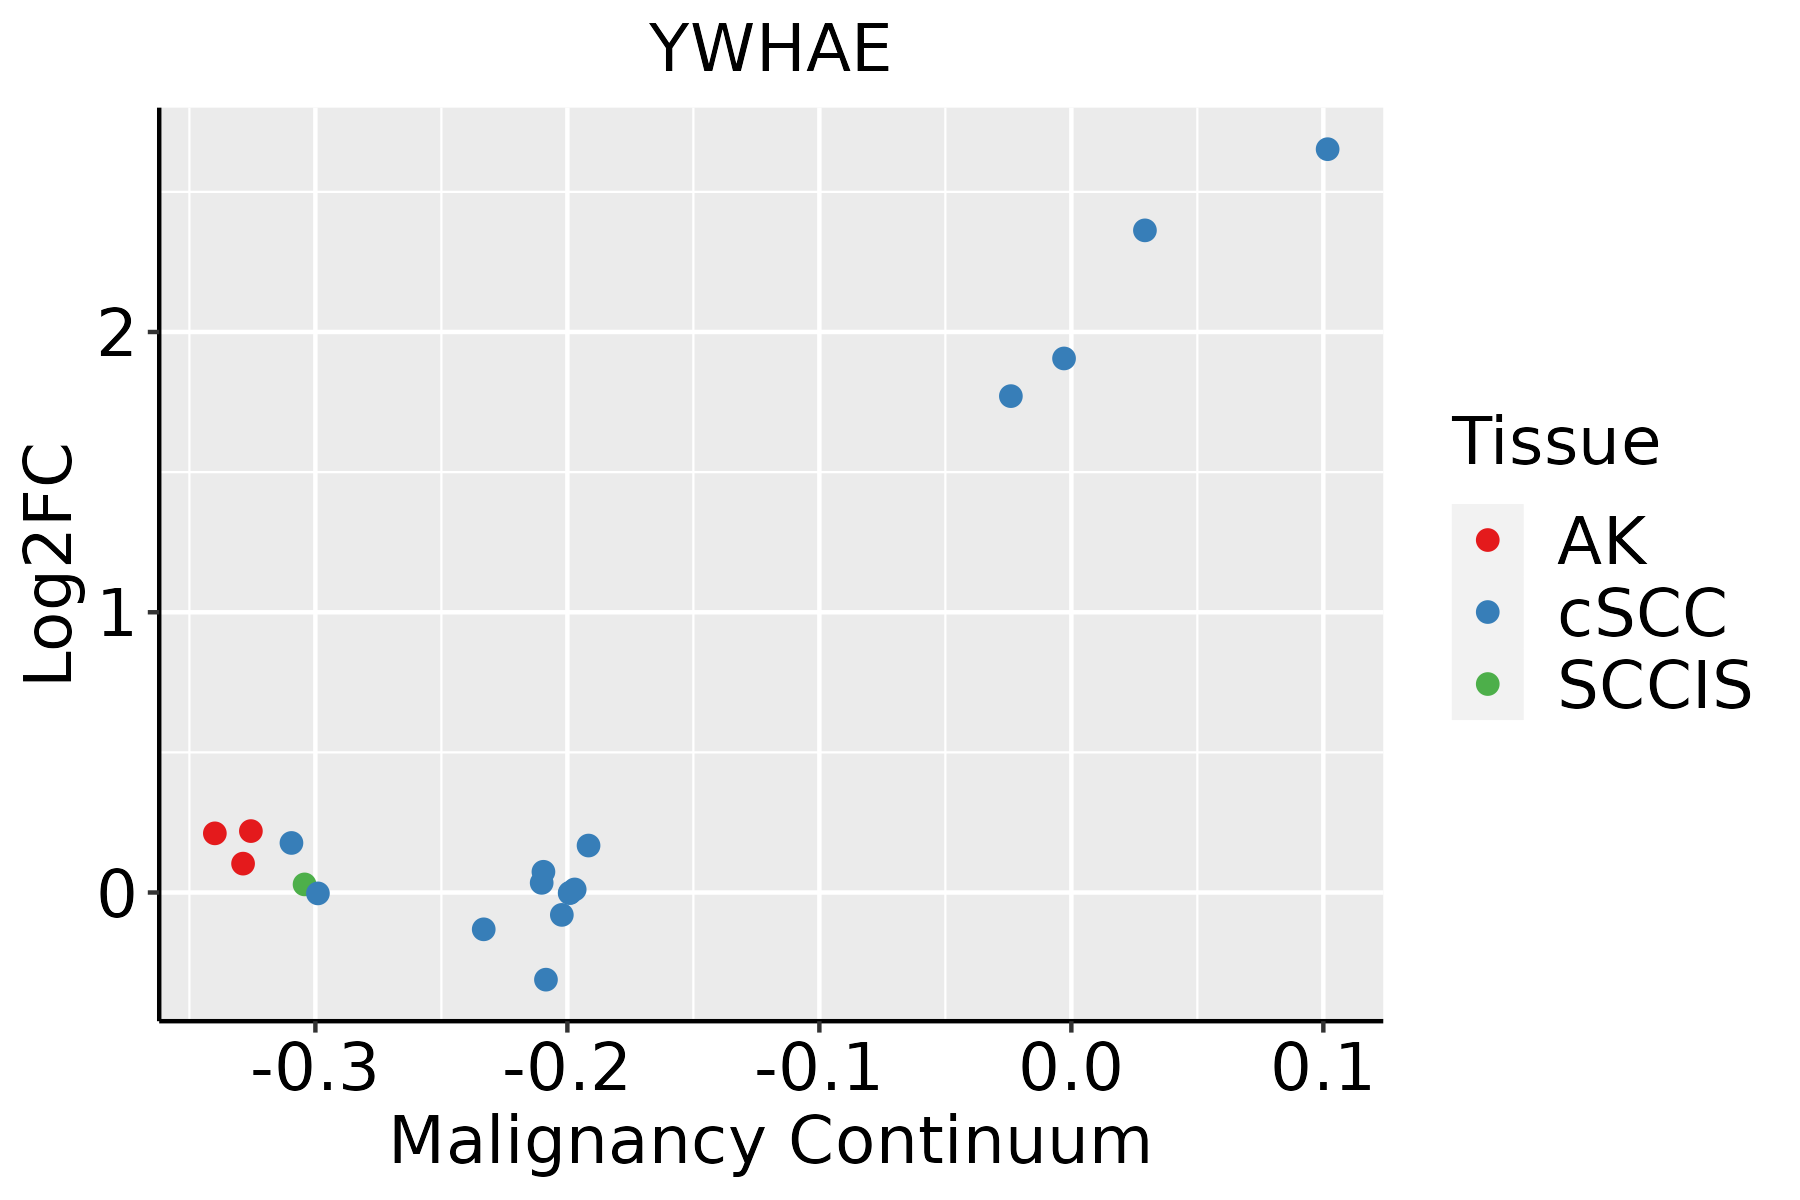 | AK: Actinic keratosis |
| cSCC: Cutaneous squamous cell carcinoma | ||
| SCCIS:squamous cell carcinoma in situ | ||
| Thyroid |  | ATC: Anaplastic thyroid cancer |
| HT: Hashimoto's thyroiditis | ||
| PTC: Papillary thyroid cancer |
| ∗log2FC in expression of this searched gene in stem-like cells from each diseased tissue sample relative to stem-like cells in normal samples in each tissue plotted against the malignancy continuum. Samples are colored based on if they are from different disease stage. |
Top |
Malignant transformation related pathway analysis |
| Find out the enriched GO biological processes and KEGG pathways involved in transition from healthy to precancer to cancer |
| Tissue | Disease Stage | Enriched GO biological Processes |
| Colorectum | AD |  |
| Colorectum | SER |  |
| Colorectum | MSS |  |
| Colorectum | MSI-H |  |
| Colorectum | FAP |  |
| ∗Top 15 enriched GO BP terms are showed in the bar plot of each disease state in each tissue. Each row represents a significant GO biological process which is colored according to the -log10(p.adjust). |
| Page: 1 2 3 4 5 6 7 8 9 |
| GO ID | Tissue | Disease Stage | Description | Gene Ratio | Bg Ratio | pvalue | p.adjust | Count |
| GO:190495127 | Thyroid | HT | positive regulation of establishment of protein localization | 41/1272 | 319/18723 | 6.22e-05 | 1.16e-03 | 41 |
| GO:000691325 | Thyroid | HT | nucleocytoplasmic transport | 39/1272 | 301/18723 | 7.81e-05 | 1.38e-03 | 39 |
| GO:005116925 | Thyroid | HT | nuclear transport | 39/1272 | 301/18723 | 7.81e-05 | 1.38e-03 | 39 |
| GO:002176226 | Thyroid | HT | substantia nigra development | 11/1272 | 44/18723 | 1.30e-04 | 2.07e-03 | 11 |
| GO:005122227 | Thyroid | HT | positive regulation of protein transport | 38/1272 | 303/18723 | 1.90e-04 | 2.78e-03 | 38 |
| GO:003238824 | Thyroid | HT | positive regulation of intracellular transport | 28/1272 | 202/18723 | 2.51e-04 | 3.50e-03 | 28 |
| GO:004885720 | Thyroid | HT | neural nucleus development | 13/1272 | 64/18723 | 3.12e-04 | 4.13e-03 | 13 |
| GO:003090120 | Thyroid | HT | midbrain development | 16/1272 | 90/18723 | 3.37e-04 | 4.32e-03 | 16 |
| GO:000661120 | Thyroid | HT | protein export from nucleus | 12/1272 | 57/18723 | 3.72e-04 | 4.72e-03 | 12 |
| GO:005116825 | Thyroid | HT | nuclear export | 22/1272 | 154/18723 | 7.34e-04 | 8.21e-03 | 22 |
| GO:003238620 | Thyroid | HT | regulation of intracellular transport | 39/1272 | 337/18723 | 7.92e-04 | 8.65e-03 | 39 |
| GO:004682524 | Thyroid | HT | regulation of protein export from nucleus | 7/1272 | 30/18723 | 3.35e-03 | 2.60e-02 | 7 |
| GO:003315725 | Thyroid | HT | regulation of intracellular protein transport | 27/1272 | 229/18723 | 3.66e-03 | 2.75e-02 | 27 |
| GO:009031620 | Thyroid | HT | positive regulation of intracellular protein transport | 20/1272 | 160/18723 | 6.03e-03 | 3.79e-02 | 20 |
| GO:00702626 | Thyroid | HT | peptidyl-serine dephosphorylation | 5/1272 | 19/18723 | 7.48e-03 | 4.44e-02 | 5 |
| GO:000734618 | Thyroid | HT | regulation of mitotic cell cycle | 45/1272 | 457/18723 | 7.86e-03 | 4.61e-02 | 45 |
| GO:0032386111 | Thyroid | PTC | regulation of intracellular transport | 202/5968 | 337/18723 | 1.12e-26 | 3.93e-24 | 202 |
| GO:0033157112 | Thyroid | PTC | regulation of intracellular protein transport | 149/5968 | 229/18723 | 3.83e-25 | 1.15e-22 | 149 |
| GO:0006913112 | Thyroid | PTC | nucleocytoplasmic transport | 181/5968 | 301/18723 | 2.93e-24 | 7.69e-22 | 181 |
| GO:0051169112 | Thyroid | PTC | nuclear transport | 181/5968 | 301/18723 | 2.93e-24 | 7.69e-22 | 181 |
| Page: 1 2 3 4 5 6 7 8 9 10 11 12 13 14 15 16 17 18 19 20 21 22 23 24 25 26 27 28 29 30 31 32 33 34 35 36 37 38 39 40 41 |
| Pathway ID | Tissue | Disease Stage | Description | Gene Ratio | Bg Ratio | pvalue | p.adjust | qvalue | Count |
| hsa052036 | Breast | Precancer | Viral carcinogenesis | 27/684 | 204/8465 | 7.19e-03 | 4.06e-02 | 3.11e-02 | 27 |
| hsa0520312 | Breast | Precancer | Viral carcinogenesis | 27/684 | 204/8465 | 7.19e-03 | 4.06e-02 | 3.11e-02 | 27 |
| hsa0520322 | Breast | IDC | Viral carcinogenesis | 34/867 | 204/8465 | 2.82e-03 | 1.86e-02 | 1.39e-02 | 34 |
| hsa0520332 | Breast | IDC | Viral carcinogenesis | 34/867 | 204/8465 | 2.82e-03 | 1.86e-02 | 1.39e-02 | 34 |
| hsa0520341 | Breast | DCIS | Viral carcinogenesis | 34/846 | 204/8465 | 1.88e-03 | 1.27e-02 | 9.33e-03 | 34 |
| hsa052035 | Breast | DCIS | Viral carcinogenesis | 34/846 | 204/8465 | 1.88e-03 | 1.27e-02 | 9.33e-03 | 34 |
| hsa04722 | Colorectum | AD | Neurotrophin signaling pathway | 50/2092 | 119/8465 | 2.28e-05 | 2.24e-04 | 1.43e-04 | 50 |
| hsa05160 | Colorectum | AD | Hepatitis C | 54/2092 | 157/8465 | 3.87e-03 | 1.96e-02 | 1.25e-02 | 54 |
| hsa047221 | Colorectum | AD | Neurotrophin signaling pathway | 50/2092 | 119/8465 | 2.28e-05 | 2.24e-04 | 1.43e-04 | 50 |
| hsa051601 | Colorectum | AD | Hepatitis C | 54/2092 | 157/8465 | 3.87e-03 | 1.96e-02 | 1.25e-02 | 54 |
| hsa047222 | Colorectum | SER | Neurotrophin signaling pathway | 35/1580 | 119/8465 | 2.80e-03 | 2.02e-02 | 1.47e-02 | 35 |
| hsa047223 | Colorectum | SER | Neurotrophin signaling pathway | 35/1580 | 119/8465 | 2.80e-03 | 2.02e-02 | 1.47e-02 | 35 |
| hsa047224 | Colorectum | MSS | Neurotrophin signaling pathway | 45/1875 | 119/8465 | 7.04e-05 | 6.55e-04 | 4.02e-04 | 45 |
| hsa051602 | Colorectum | MSS | Hepatitis C | 52/1875 | 157/8465 | 9.29e-04 | 5.58e-03 | 3.42e-03 | 52 |
| hsa04390 | Colorectum | MSS | Hippo signaling pathway | 48/1875 | 157/8465 | 8.32e-03 | 3.10e-02 | 1.90e-02 | 48 |
| hsa047225 | Colorectum | MSS | Neurotrophin signaling pathway | 45/1875 | 119/8465 | 7.04e-05 | 6.55e-04 | 4.02e-04 | 45 |
| hsa051603 | Colorectum | MSS | Hepatitis C | 52/1875 | 157/8465 | 9.29e-04 | 5.58e-03 | 3.42e-03 | 52 |
| hsa043901 | Colorectum | MSS | Hippo signaling pathway | 48/1875 | 157/8465 | 8.32e-03 | 3.10e-02 | 1.90e-02 | 48 |
| hsa047226 | Colorectum | FAP | Neurotrophin signaling pathway | 38/1404 | 119/8465 | 2.49e-05 | 2.78e-04 | 1.69e-04 | 38 |
| hsa043902 | Colorectum | FAP | Hippo signaling pathway | 41/1404 | 157/8465 | 1.49e-03 | 7.91e-03 | 4.81e-03 | 41 |
| Page: 1 2 3 4 5 6 7 8 9 |
Top |
Cell-cell communication analysis |
| Identification of potential cell-cell interactions between two cell types and their ligand-receptor pairs for different disease states |
| Ligand | Receptor | LRpair | Pathway | Tissue | Disease Stage |
| Page: 1 |
Top |
Single-cell gene regulatory network inference analysis |
| Find out the significant the regulons (TFs) and the target genes of each regulon across cell types for different disease states |
| TF | Cell Type | Tissue | Disease Stage | Target Gene | RSS | Regulon Activity |
| ∗The dot plots of a searched regulon are shown for all cell subpopulations in each disease state of each tissue based on the regulon specific score inferred using pySCENIC and by calculating the average expression. |
| Page: 1 |
Top |
Somatic mutation of malignant transformation related genes |
| Annotation of somatic variants for genes involved in malignant transformation |
| Hugo Symbol | Variant Class | Variant Classification | dbSNP RS | HGVSc | HGVSp | HGVSp Short | SWISSPROT | BIOTYPE | SIFT | PolyPhen | Tumor Sample Barcode | Tissue | Histology | Sex | Age | Stage | Therapy Types | Drugs | Outcome |
| YWHAE | SNV | Missense_Mutation | novel | c.496N>G | p.Thr166Ala | p.T166A | P62258 | protein_coding | deleterious_low_confidence(0) | benign(0.027) | TCGA-C5-A7CG-01 | Cervix | cervical & endocervical cancer | Female | <65 | I/II | Unknown | Unknown | SD |
| YWHAE | SNV | Missense_Mutation | c.360N>G | p.Phe120Leu | p.F120L | P62258 | protein_coding | deleterious_low_confidence(0.02) | probably_damaging(0.99) | TCGA-Q1-A73O-01 | Cervix | cervical & endocervical cancer | Female | <65 | I/II | Chemotherapy | cisplatin | CR | |
| YWHAE | SNV | Missense_Mutation | rs777592060 | c.32C>T | p.Ala11Val | p.A11V | P62258 | protein_coding | deleterious_low_confidence(0.02) | probably_damaging(1) | TCGA-AA-3821-01 | Colorectum | colon adenocarcinoma | Female | >=65 | I/II | Unknown | Unknown | SD |
| YWHAE | SNV | Missense_Mutation | c.125N>T | p.Arg42Ile | p.R42I | P62258 | protein_coding | deleterious_low_confidence(0.02) | probably_damaging(0.953) | TCGA-AA-A00N-01 | Colorectum | colon adenocarcinoma | Male | >=65 | I/II | Unknown | Unknown | PD | |
| YWHAE | SNV | Missense_Mutation | novel | c.374N>C | p.Lys125Thr | p.K125T | P62258 | protein_coding | deleterious_low_confidence(0) | probably_damaging(0.995) | TCGA-CA-6717-01 | Colorectum | colon adenocarcinoma | Male | <65 | I/II | Chemotherapy | oxaliplatin | CR |
| YWHAE | SNV | Missense_Mutation | c.347A>T | p.Glu116Val | p.E116V | P62258 | protein_coding | deleterious_low_confidence(0) | probably_damaging(0.977) | TCGA-A5-A0GI-01 | Endometrium | uterine corpus endometrioid carcinoma | Female | <65 | I/II | Unknown | Unknown | SD | |
| YWHAE | SNV | Missense_Mutation | rs754262216 | c.737N>T | p.Ala246Val | p.A246V | P62258 | protein_coding | deleterious_low_confidence(0.02) | benign(0.001) | TCGA-AP-A056-01 | Endometrium | uterine corpus endometrioid carcinoma | Female | <65 | I/II | Unknown | Unknown | SD |
| YWHAE | SNV | Missense_Mutation | novel | c.757N>A | p.Glu253Lys | p.E253K | P62258 | protein_coding | deleterious_low_confidence(0.02) | benign(0.003) | TCGA-AX-A1CE-01 | Endometrium | uterine corpus endometrioid carcinoma | Female | <65 | I/II | Unspecific | Paclitaxel | SD |
| YWHAE | SNV | Missense_Mutation | novel | c.172N>A | p.Ala58Thr | p.A58T | P62258 | protein_coding | deleterious_low_confidence(0) | benign(0.249) | TCGA-AX-A1CE-01 | Endometrium | uterine corpus endometrioid carcinoma | Female | <65 | I/II | Unspecific | Paclitaxel | SD |
| YWHAE | SNV | Missense_Mutation | c.43N>A | p.Glu15Lys | p.E15K | P62258 | protein_coding | deleterious_low_confidence(0.02) | benign(0.233) | TCGA-EO-A2CG-01 | Endometrium | uterine corpus endometrioid carcinoma | Female | >=65 | I/II | Chemotherapy | carboplatin | CR |
| Page: 1 2 3 |
Top |
Related drugs of malignant transformation related genes |
| Identification of chemicals and drugs interact with genes involved in malignant transfromation |
| (DGIdb 4.0) |
| Entrez ID | Symbol | Category | Interaction Types | Drug Claim Name | Drug Name | PMIDs |
| 7531 | YWHAE | CLINICALLY ACTIONABLE | INSULIN | INSULIN | 16216880 |
| Page: 1 |

Copyright 2023-Present -The University of Texas Health Science Center at Houston |