| Tissue | Expression Dynamics | Abbreviation |
| Cervix | 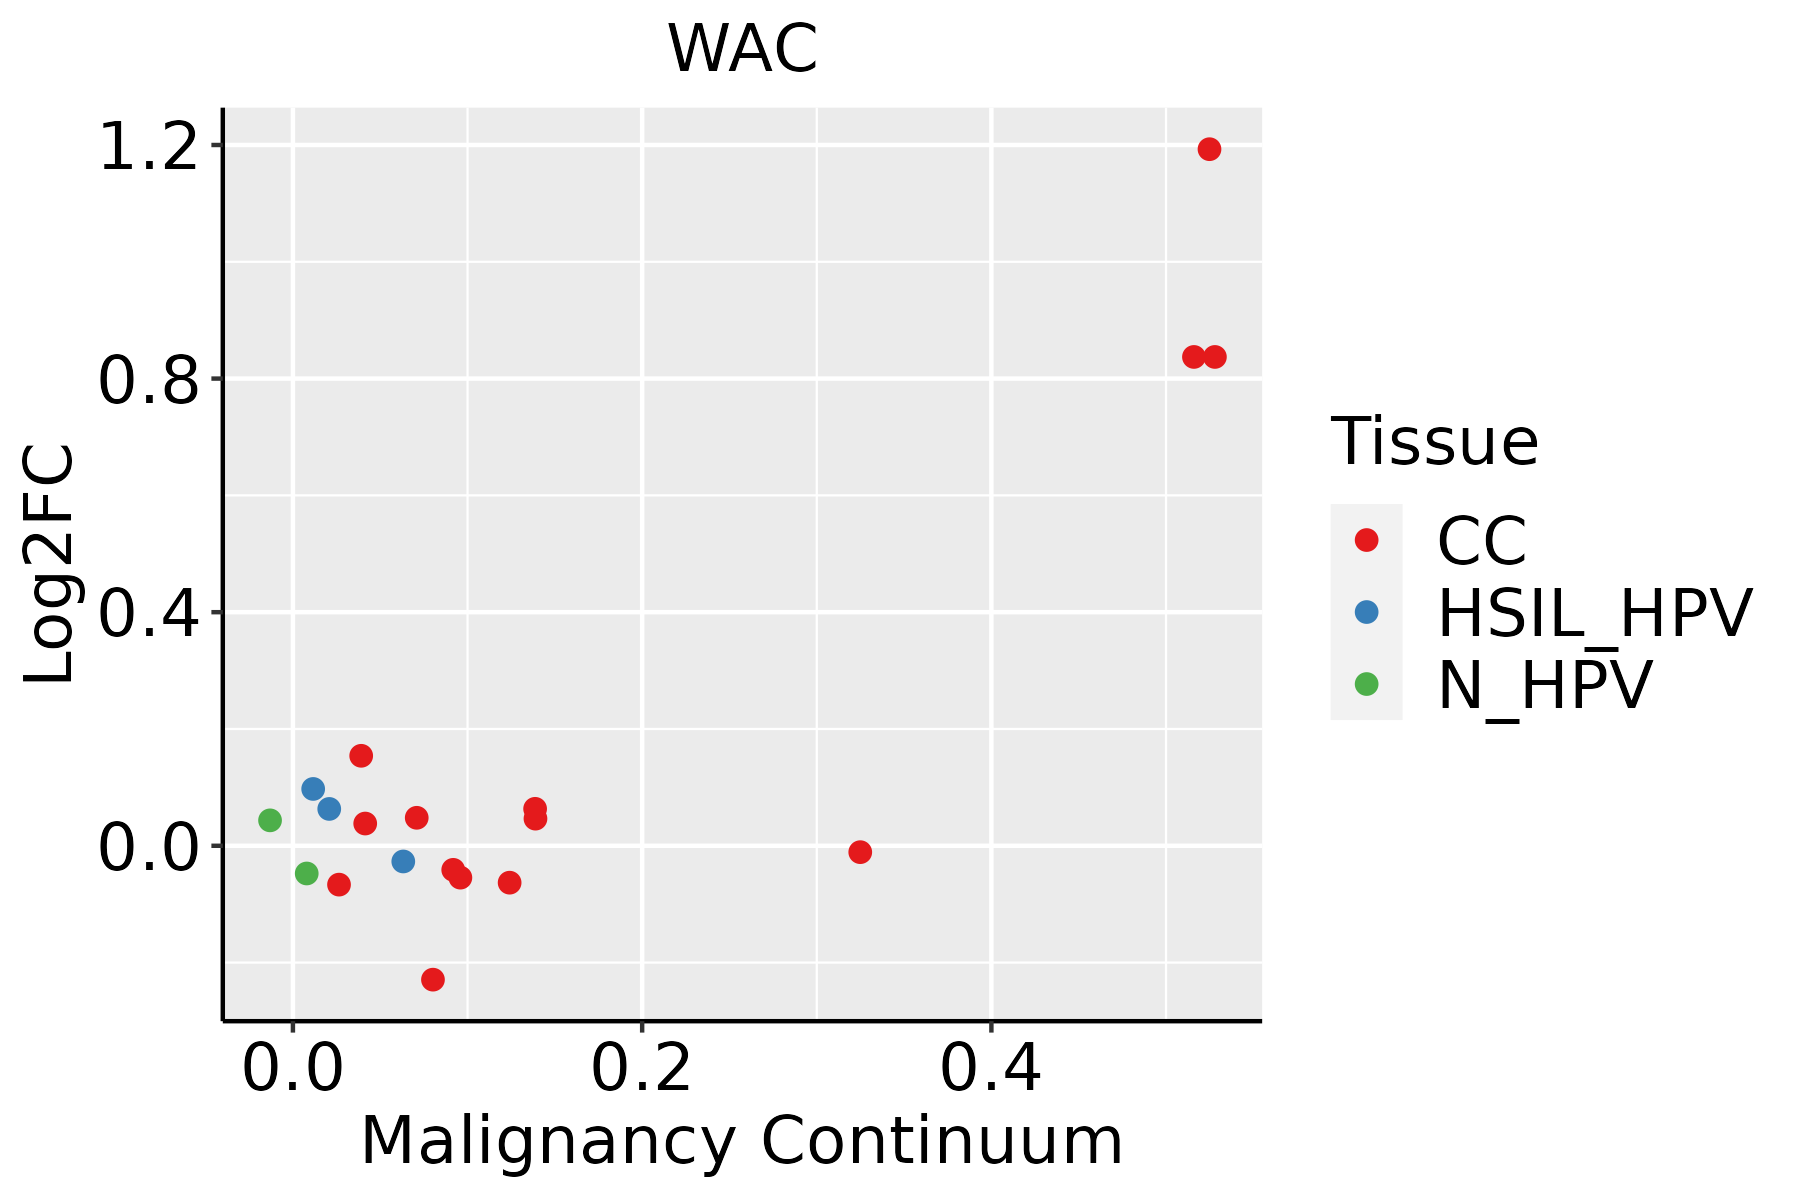 | CC: Cervix cancer |
| HSIL_HPV: HPV-infected high-grade squamous intraepithelial lesions |
| N_HPV: HPV-infected normal cervix |
| Colorectum (GSE201348) |  | FAP: Familial adenomatous polyposis |
| CRC: Colorectal cancer |
| Colorectum (HTA11) |  | AD: Adenomas |
| SER: Sessile serrated lesions |
| MSI-H: Microsatellite-high colorectal cancer |
| MSS: Microsatellite stable colorectal cancer |
| Endometrium | 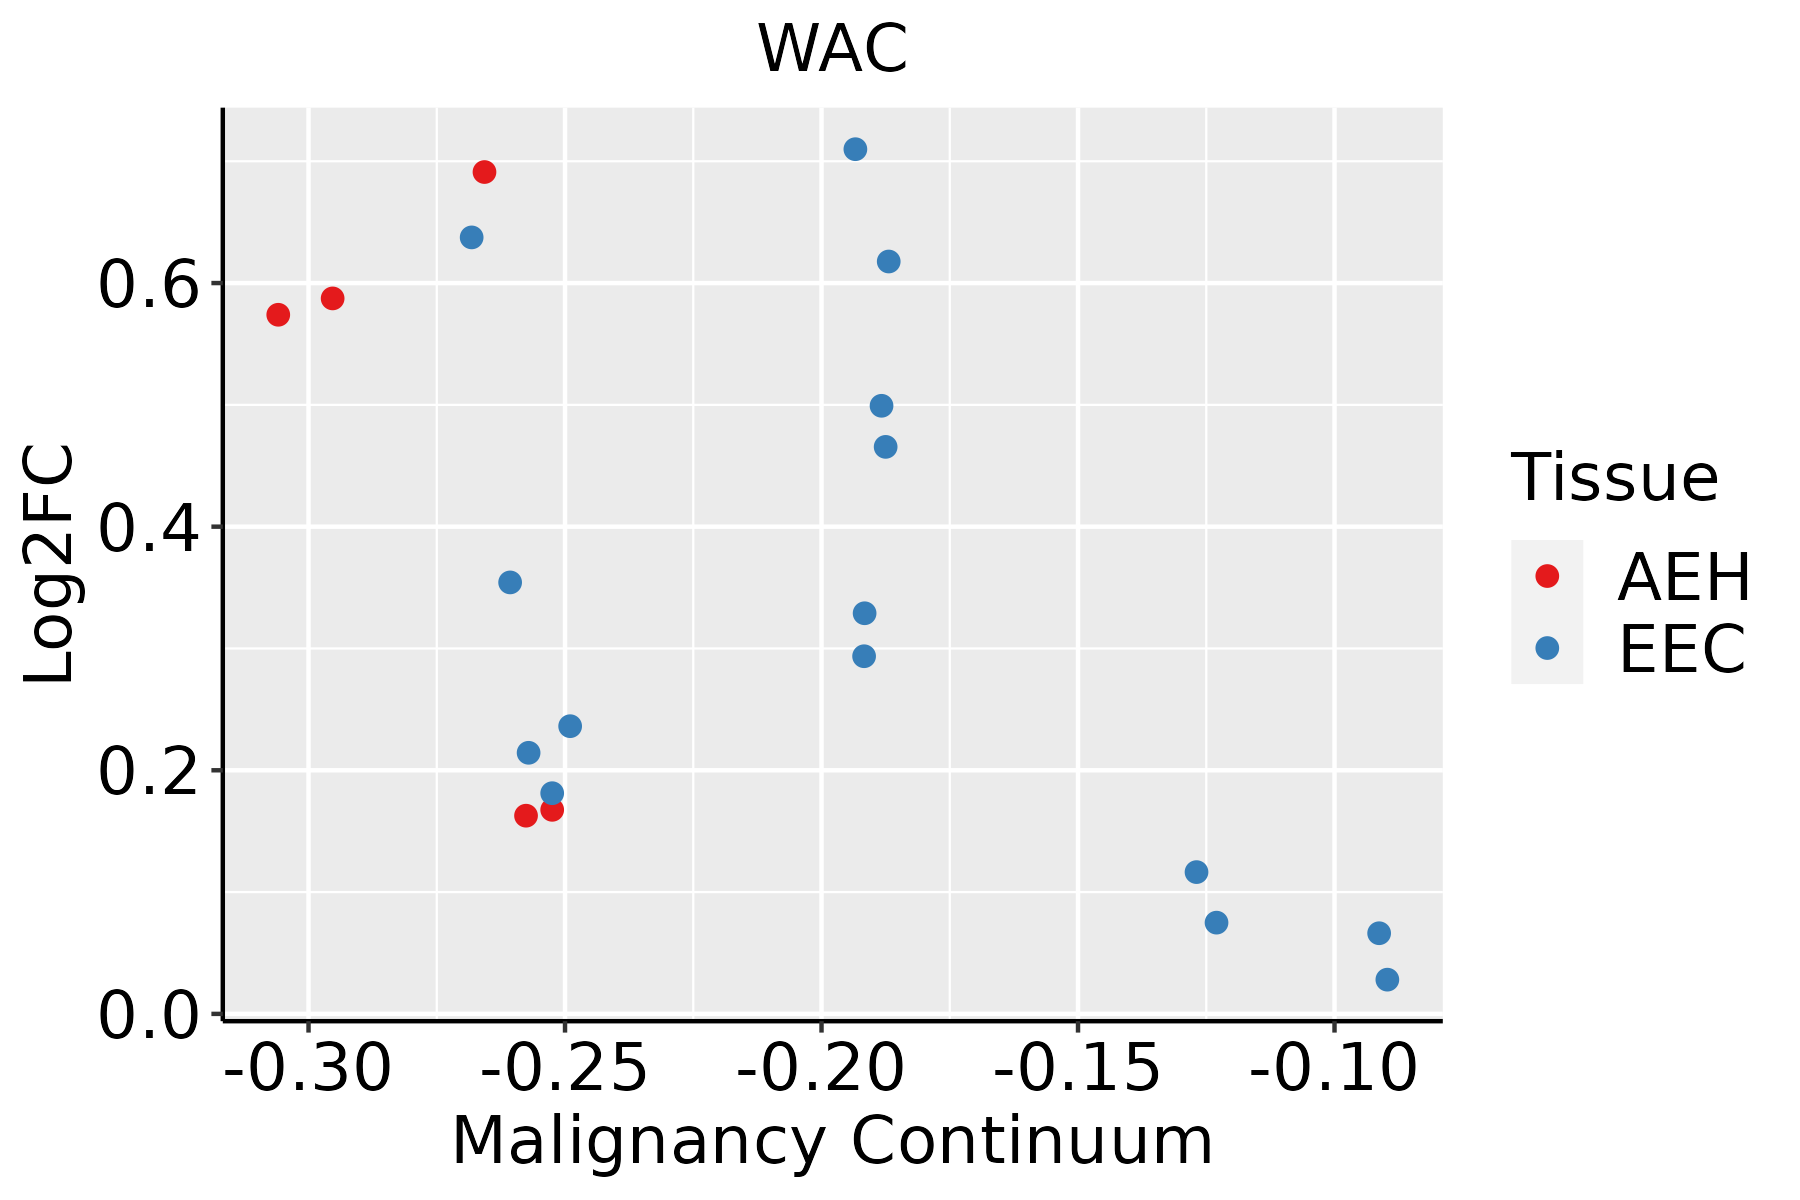 | AEH: Atypical endometrial hyperplasia |
| EEC: Endometrioid Cancer |
| Esophagus | 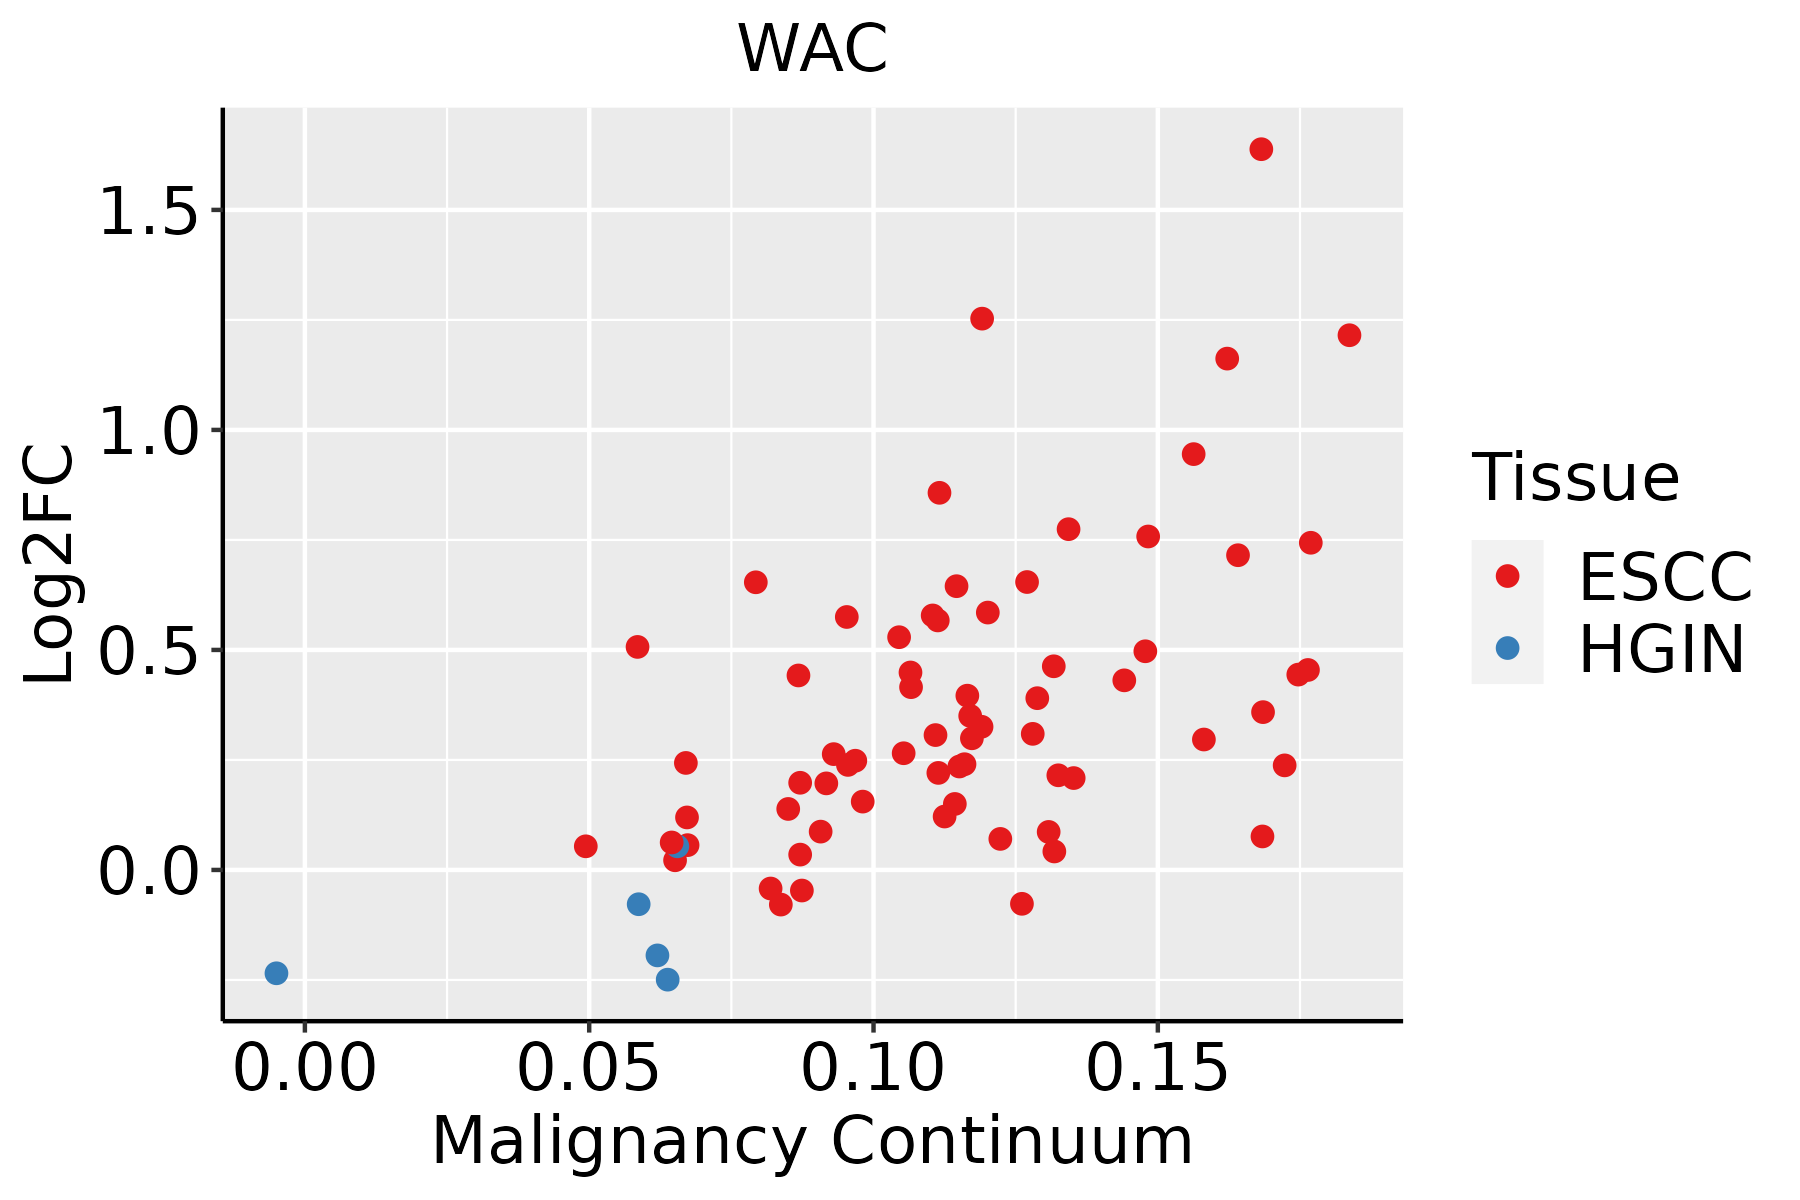 | ESCC: Esophageal squamous cell carcinoma |
| HGIN: High-grade intraepithelial neoplasias |
| LGIN: Low-grade intraepithelial neoplasias |
| Liver | 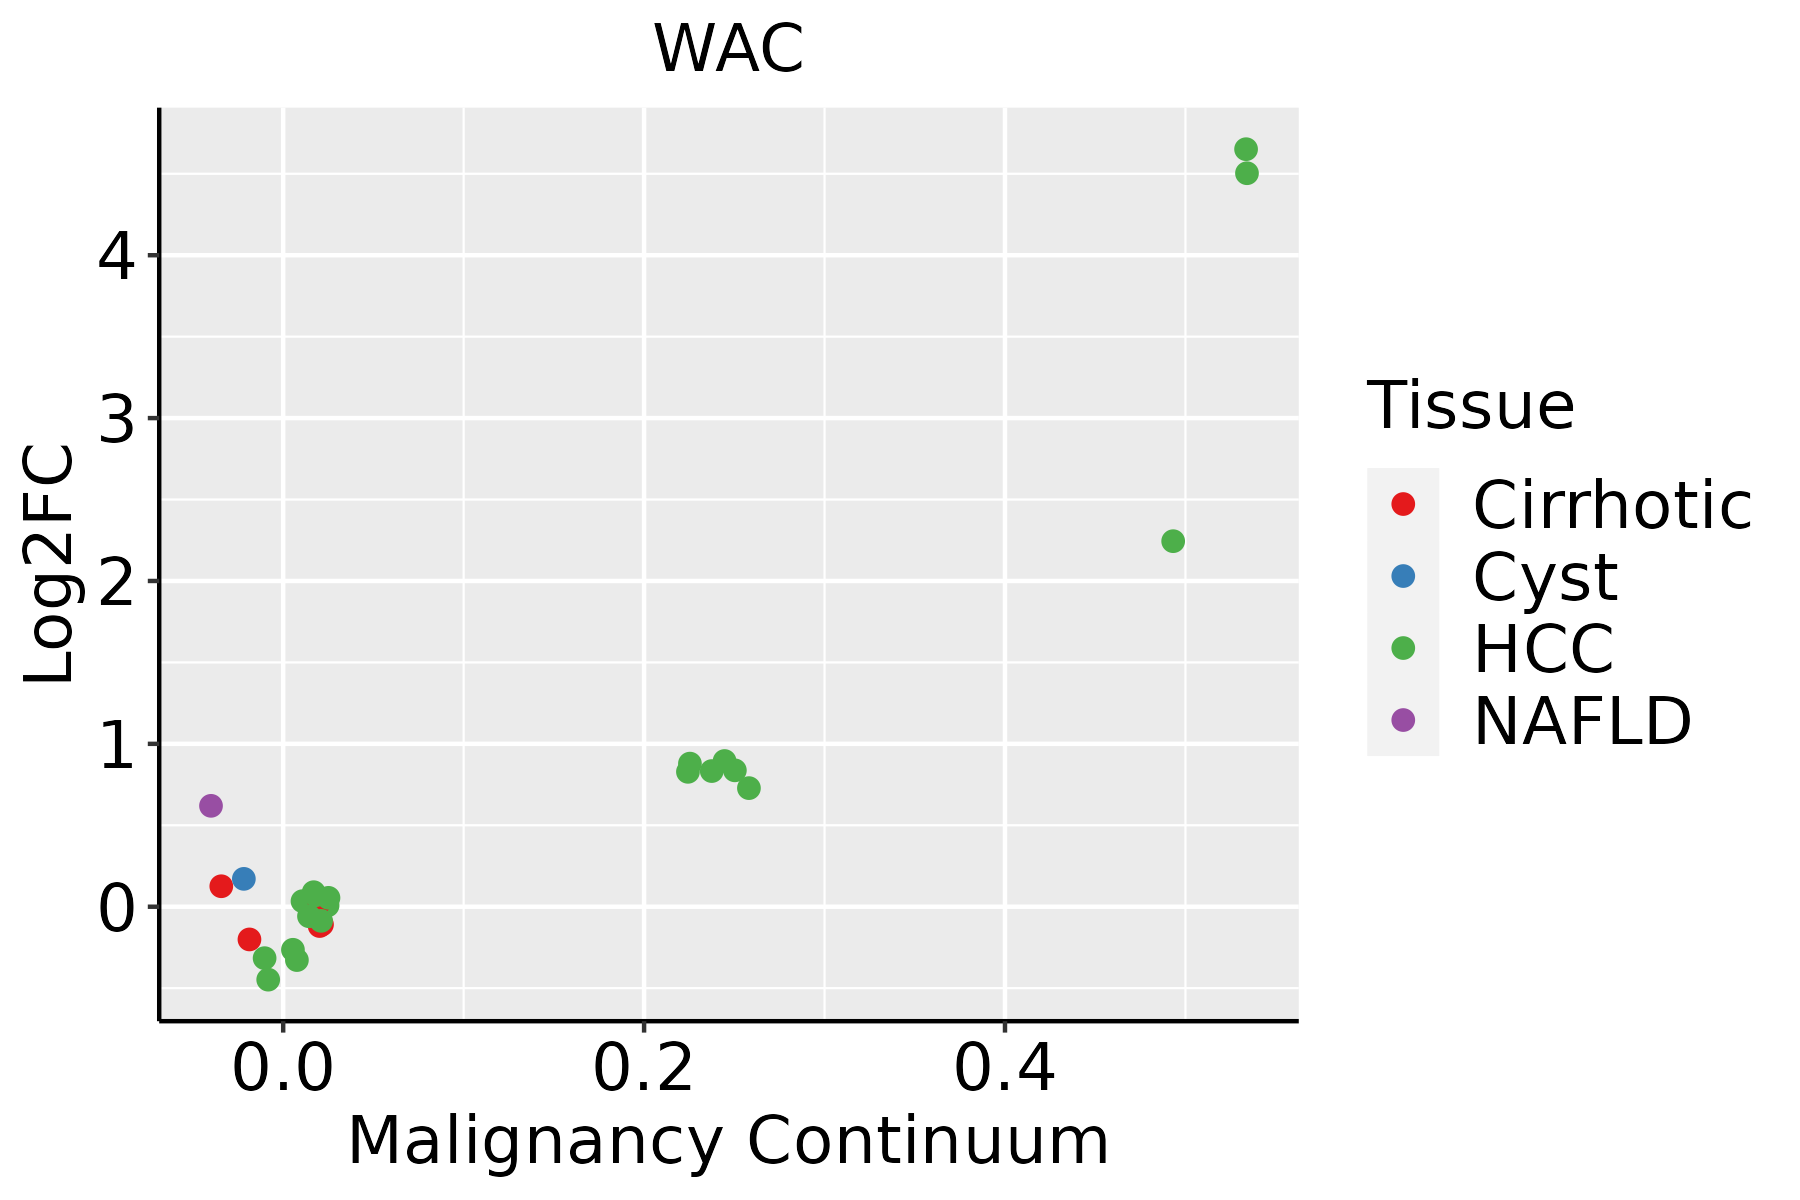 | HCC: Hepatocellular carcinoma |
| NAFLD: Non-alcoholic fatty liver disease |
| Lung | 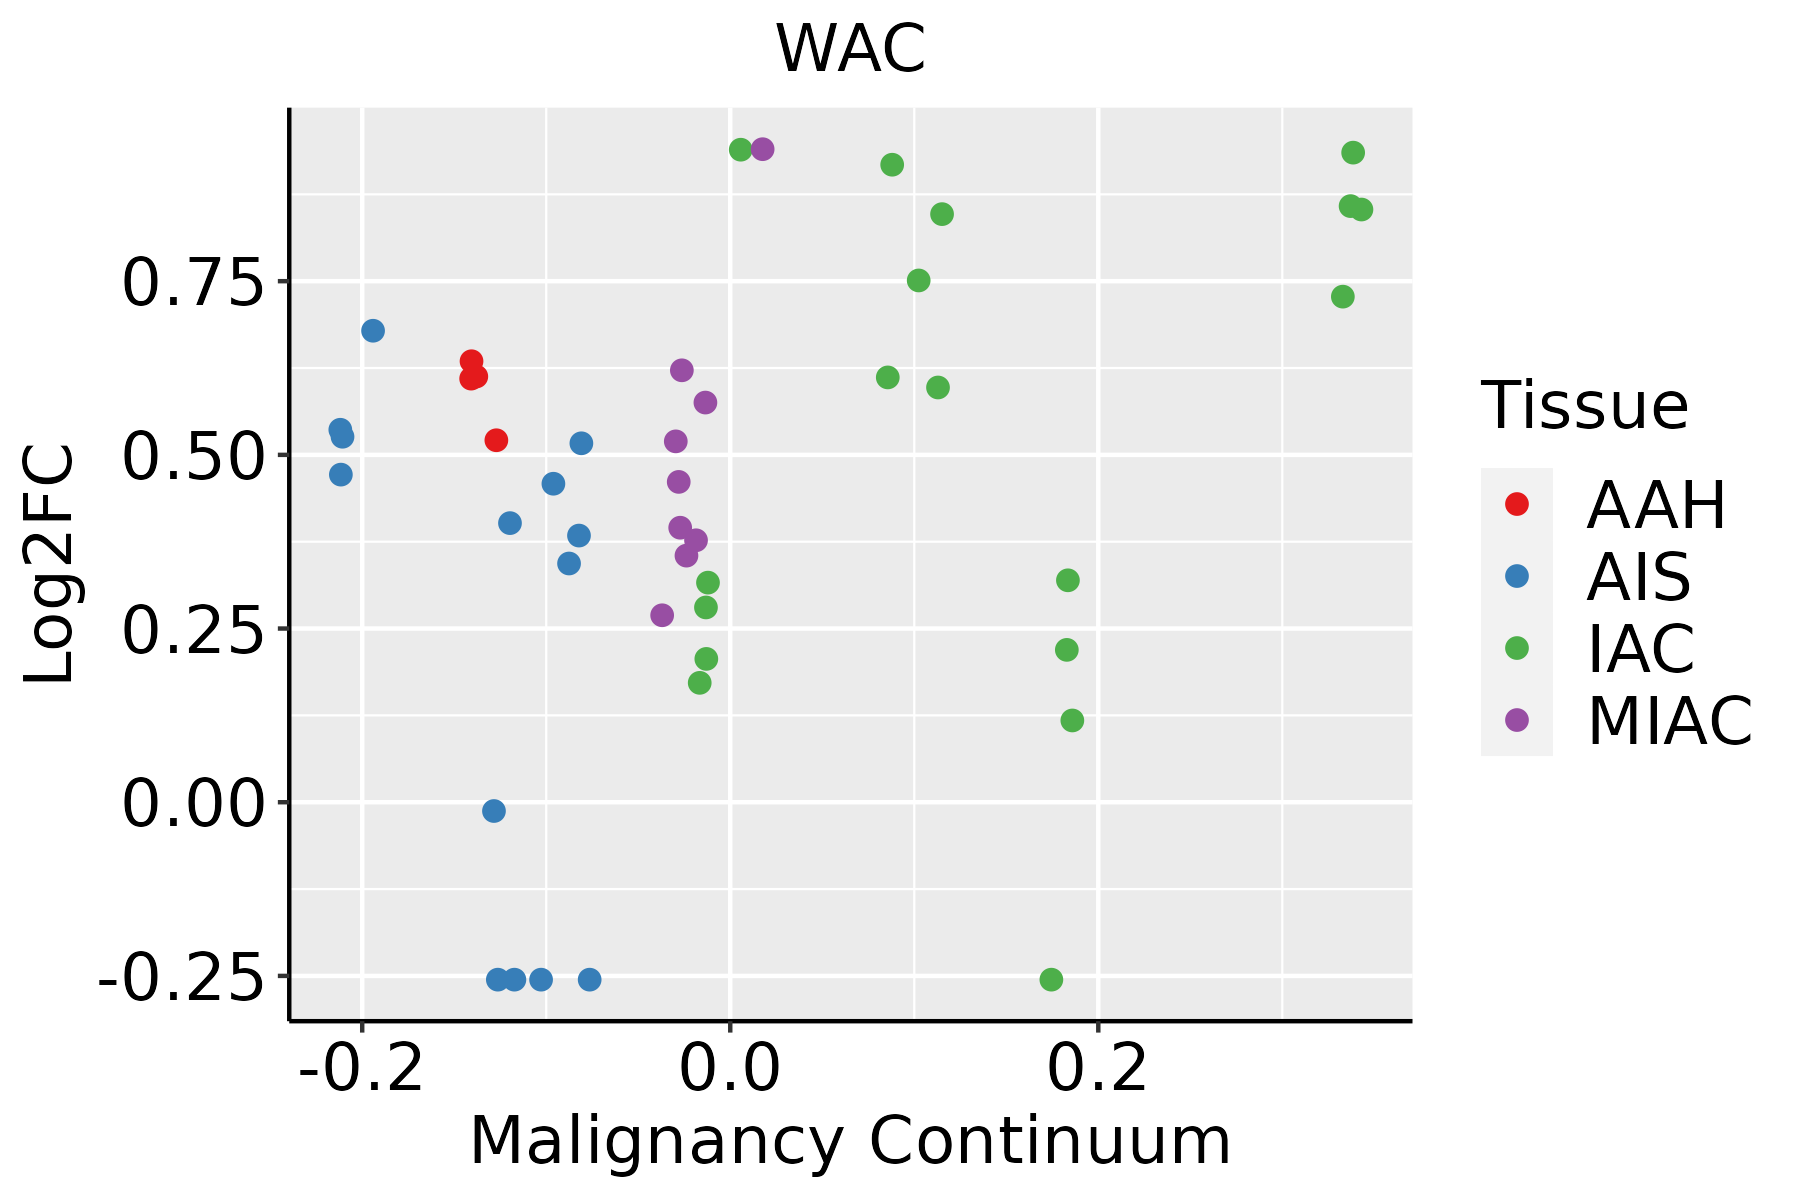 | AAH: Atypical adenomatous hyperplasia |
| AIS: Adenocarcinoma in situ |
| IAC: Invasive lung adenocarcinoma |
| MIA: Minimally invasive adenocarcinoma |
| Oral Cavity | 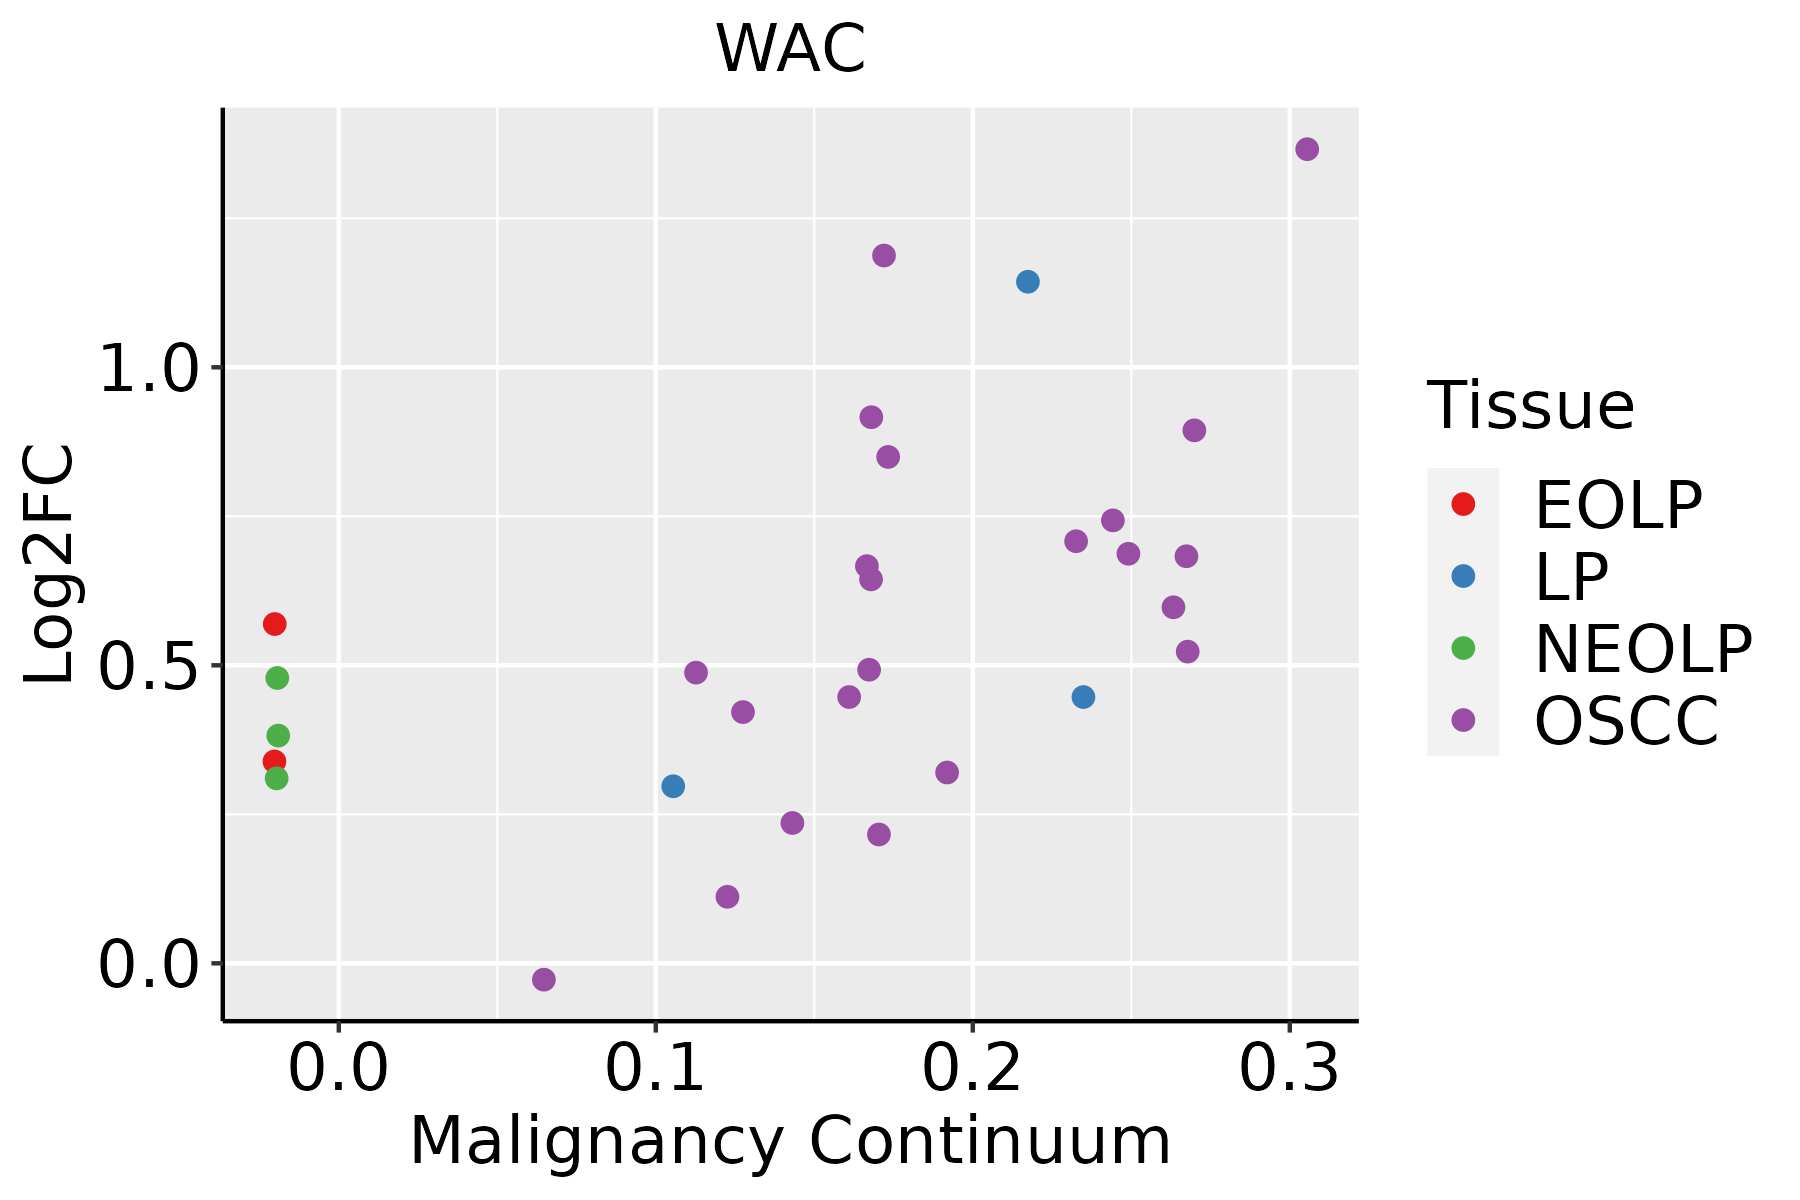 | EOLP: Erosive Oral lichen planus |
| LP: leukoplakia |
| NEOLP: Non-erosive oral lichen planus |
| OSCC: Oral squamous cell carcinoma |
| Prostate | 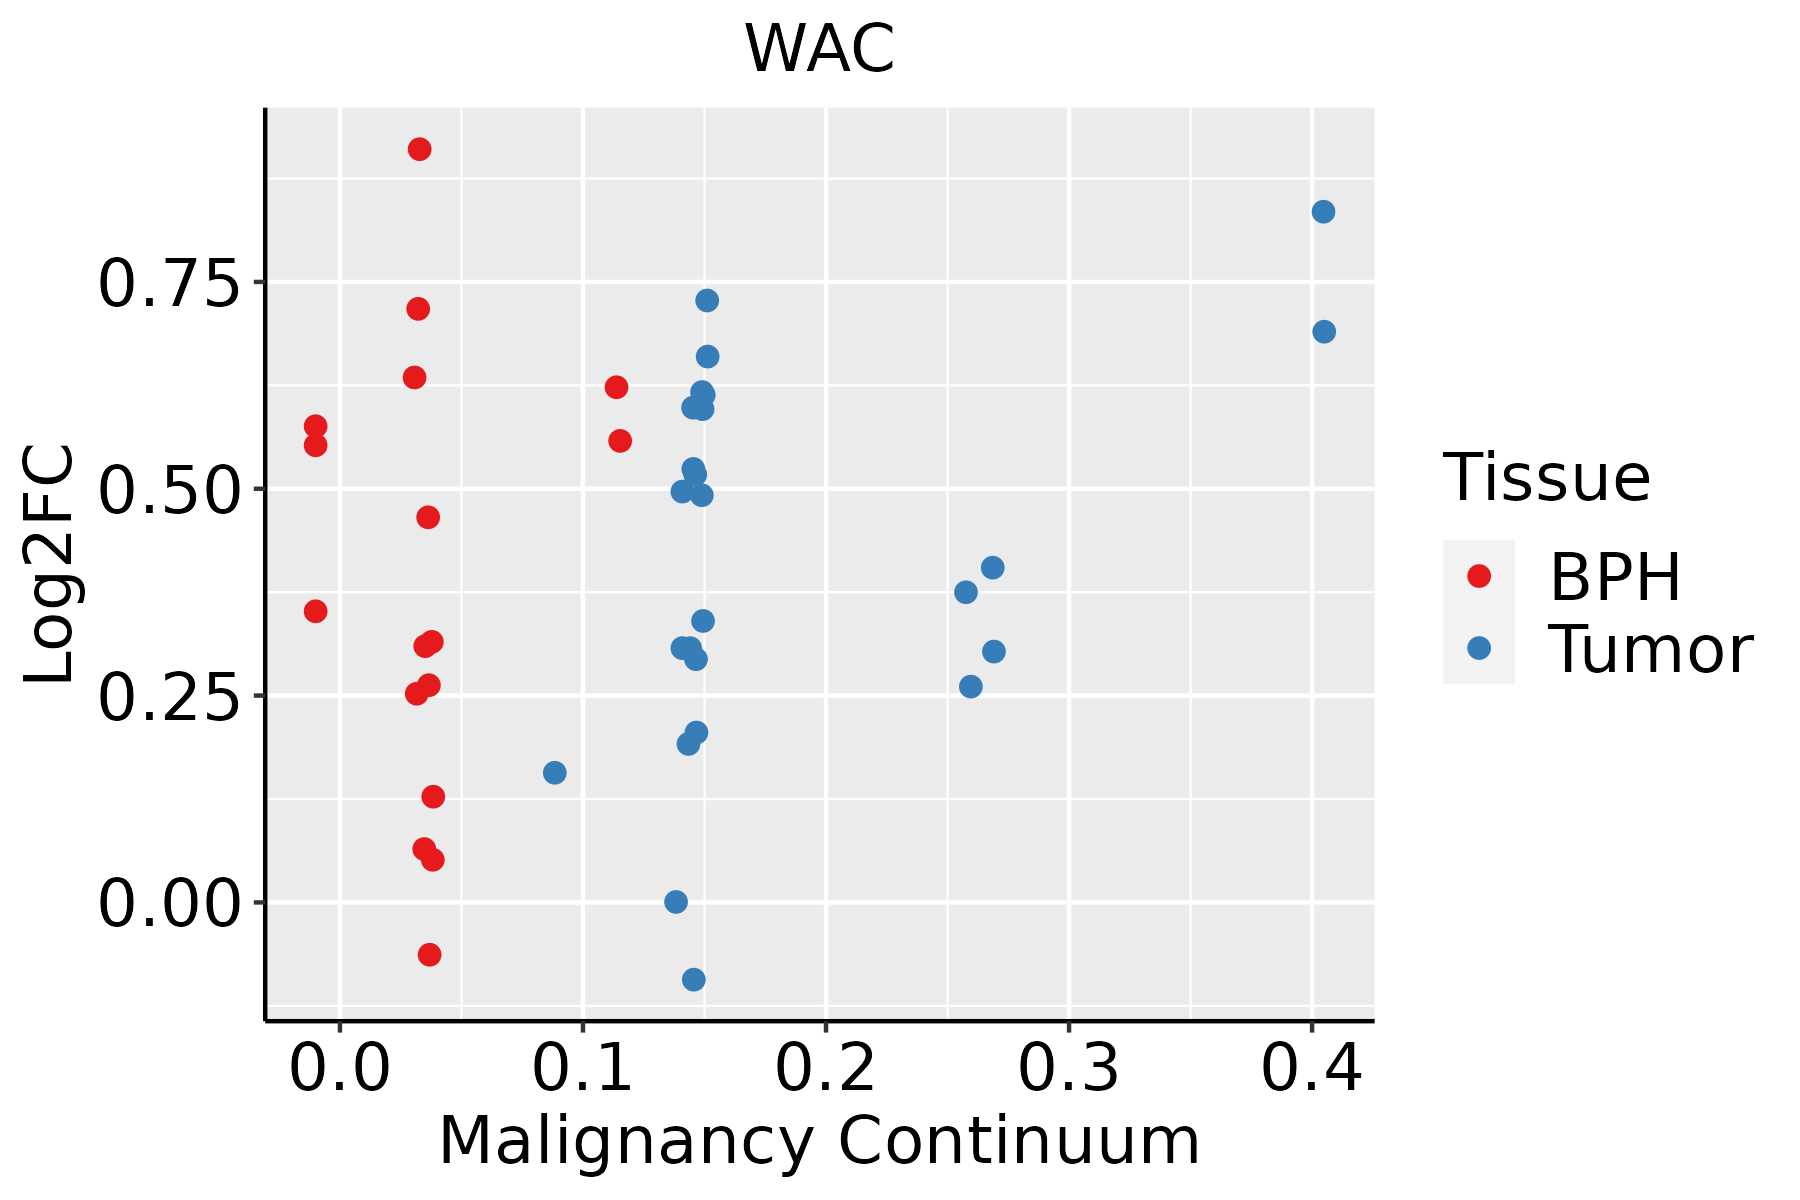 | BPH: Benign Prostatic Hyperplasia |
| Skin | 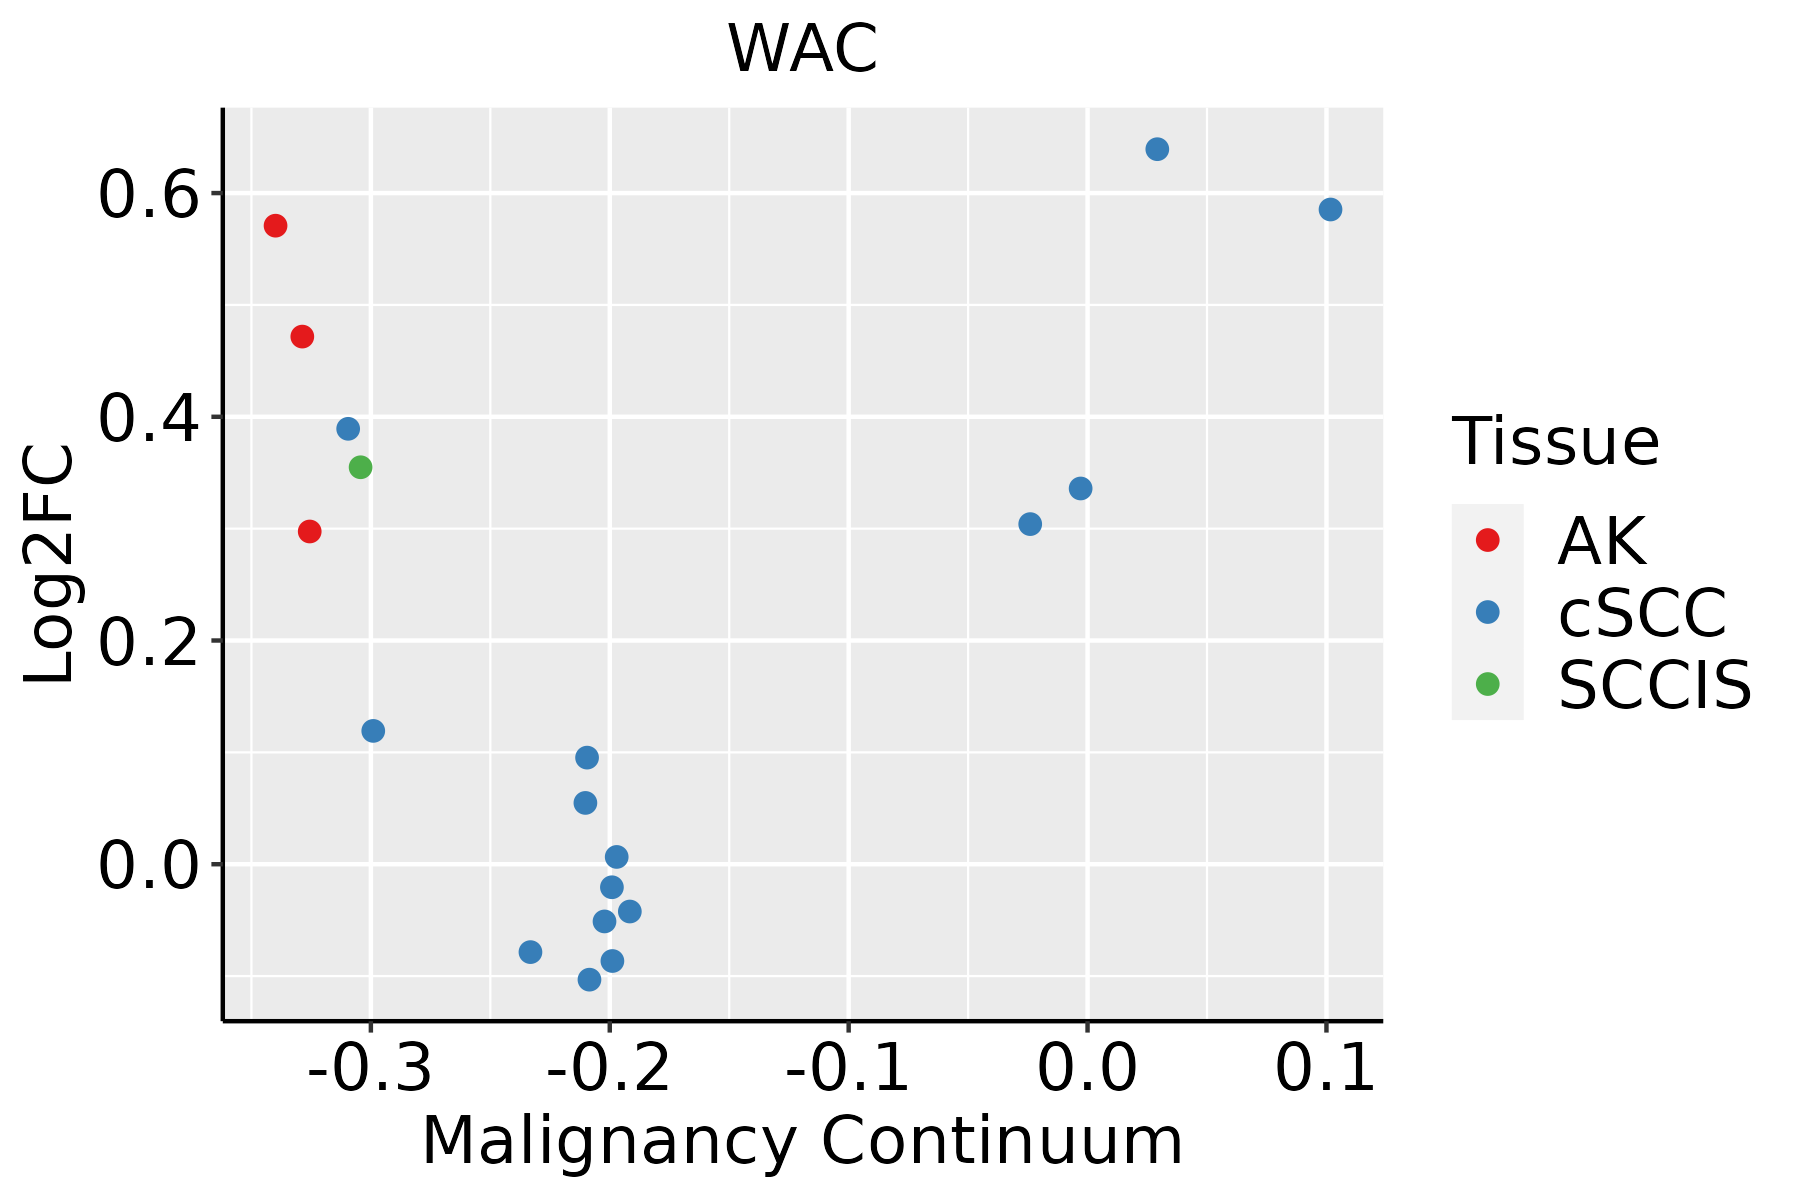 | AK: Actinic keratosis |
| cSCC: Cutaneous squamous cell carcinoma |
| SCCIS:squamous cell carcinoma in situ |
| Thyroid | 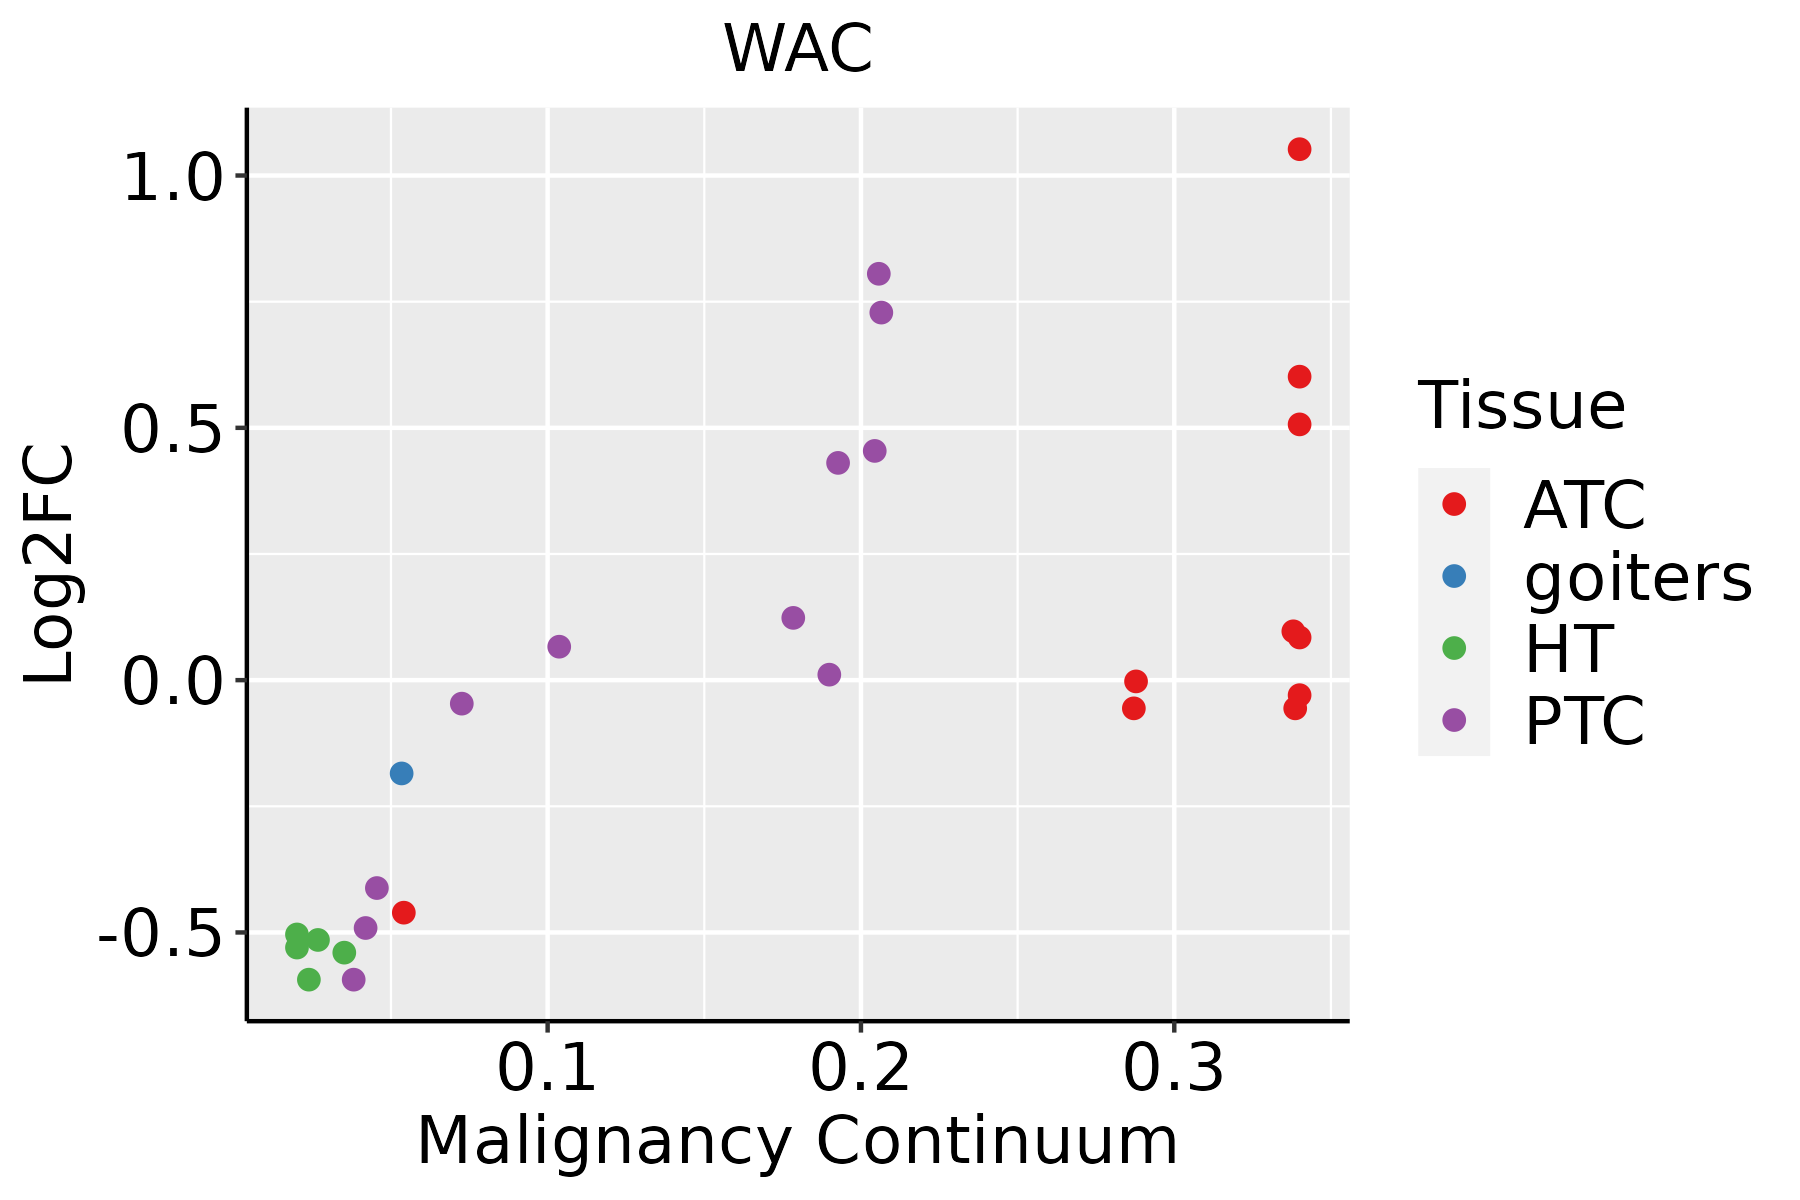 | ATC: Anaplastic thyroid cancer |
| HT: Hashimoto's thyroiditis |
| PTC: Papillary thyroid cancer |
| GO ID | Tissue | Disease Stage | Description | Gene Ratio | Bg Ratio | pvalue | p.adjust | Count |
| GO:004217718 | Prostate | Tumor | negative regulation of protein catabolic process | 49/3246 | 121/18723 | 1.53e-09 | 7.19e-08 | 49 |
| GO:000989518 | Prostate | Tumor | negative regulation of catabolic process | 96/3246 | 320/18723 | 1.40e-08 | 5.07e-07 | 96 |
| GO:004586119 | Prostate | Tumor | negative regulation of proteolysis | 102/3246 | 351/18723 | 3.09e-08 | 9.94e-07 | 102 |
| GO:003133019 | Prostate | Tumor | negative regulation of cellular catabolic process | 81/3246 | 262/18723 | 4.42e-08 | 1.37e-06 | 81 |
| GO:001657013 | Prostate | Tumor | histone modification | 126/3246 | 463/18723 | 5.51e-08 | 1.65e-06 | 126 |
| GO:001623614 | Prostate | Tumor | macroautophagy | 87/3246 | 291/18723 | 7.82e-08 | 2.16e-06 | 87 |
| GO:200005918 | Prostate | Tumor | negative regulation of ubiquitin-dependent protein catabolic process | 24/3246 | 48/18723 | 2.17e-07 | 5.26e-06 | 24 |
| GO:190336316 | Prostate | Tumor | negative regulation of cellular protein catabolic process | 32/3246 | 75/18723 | 2.47e-07 | 5.72e-06 | 32 |
| GO:190305116 | Prostate | Tumor | negative regulation of proteolysis involved in cellular protein catabolic process | 28/3246 | 64/18723 | 7.39e-07 | 1.47e-05 | 28 |
| GO:003243513 | Prostate | Tumor | negative regulation of proteasomal ubiquitin-dependent protein catabolic process | 18/3246 | 35/18723 | 4.26e-06 | 6.72e-05 | 18 |
| GO:001050614 | Prostate | Tumor | regulation of autophagy | 86/3246 | 317/18723 | 7.77e-06 | 1.16e-04 | 86 |
| GO:000008212 | Prostate | Tumor | G1/S transition of mitotic cell cycle | 62/3246 | 214/18723 | 1.63e-05 | 2.18e-04 | 62 |
| GO:190179912 | Prostate | Tumor | negative regulation of proteasomal protein catabolic process | 21/3246 | 49/18723 | 2.59e-05 | 3.18e-04 | 21 |
| GO:004484312 | Prostate | Tumor | cell cycle G1/S phase transition | 67/3246 | 241/18723 | 3.28e-05 | 3.88e-04 | 67 |
| GO:000734613 | Prostate | Tumor | regulation of mitotic cell cycle | 113/3246 | 457/18723 | 3.37e-05 | 3.96e-04 | 113 |
| GO:004477214 | Prostate | Tumor | mitotic cell cycle phase transition | 106/3246 | 424/18723 | 3.61e-05 | 4.21e-04 | 106 |
| GO:200004511 | Prostate | Tumor | regulation of G1/S transition of mitotic cell cycle | 44/3246 | 142/18723 | 4.66e-05 | 5.21e-04 | 44 |
| GO:001050814 | Prostate | Tumor | positive regulation of autophagy | 39/3246 | 124/18723 | 8.56e-05 | 8.53e-04 | 39 |
| GO:190280611 | Prostate | Tumor | regulation of cell cycle G1/S phase transition | 49/3246 | 168/18723 | 9.98e-05 | 9.73e-04 | 49 |
| GO:004277012 | Prostate | Tumor | signal transduction in response to DNA damage | 49/3246 | 172/18723 | 1.87e-04 | 1.65e-03 | 49 |
| Hugo Symbol | Variant Class | Variant Classification | dbSNP RS | HGVSc | HGVSp | HGVSp Short | SWISSPROT | BIOTYPE | SIFT | PolyPhen | Tumor Sample Barcode | Tissue | Histology | Sex | Age | Stage | Therapy Types | Drugs | Outcome |
| WAC | SNV | Missense_Mutation | | c.306C>G | p.His102Gln | p.H102Q | Q9BTA9 | protein_coding | tolerated(0.13) | benign(0.063) | TCGA-A2-A3XT-01 | Breast | breast invasive carcinoma | Female | <65 | I/II | Chemotherapy | cyclophosphamide | PR |
| WAC | SNV | Missense_Mutation | | c.1142N>C | p.Val381Ala | p.V381A | Q9BTA9 | protein_coding | deleterious(0.03) | possibly_damaging(0.503) | TCGA-A8-A06X-01 | Breast | breast invasive carcinoma | Female | >=65 | I/II | Unknown | Unknown | SD |
| WAC | SNV | Missense_Mutation | novel | c.1798N>A | p.Glu600Lys | p.E600K | Q9BTA9 | protein_coding | tolerated(0.09) | probably_damaging(0.972) | TCGA-AN-A046-01 | Breast | breast invasive carcinoma | Female | >=65 | I/II | Unknown | Unknown | SD |
| WAC | SNV | Missense_Mutation | novel | c.16A>G | p.Arg6Gly | p.R6G | Q9BTA9 | protein_coding | deleterious(0.04) | benign(0) | TCGA-AQ-A7U7-01 | Breast | breast invasive carcinoma | Female | <65 | III/IV | Targeted Molecular therapy | rituximab | CR |
| WAC | SNV | Missense_Mutation | rs200723559 | c.1586N>G | p.Asn529Ser | p.N529S | Q9BTA9 | protein_coding | tolerated(0.13) | possibly_damaging(0.584) | TCGA-BH-A0E0-01 | Breast | breast invasive carcinoma | Female | <65 | III/IV | Chemotherapy | docetaxel | SD |
| WAC | SNV | Missense_Mutation | rs750794271 | c.376N>C | p.Asp126His | p.D126H | Q9BTA9 | protein_coding | deleterious(0.01) | probably_damaging(0.995) | TCGA-D8-A27G-01 | Breast | breast invasive carcinoma | Female | >=65 | I/II | Unknown | Unknown | SD |
| WAC | SNV | Missense_Mutation | | c.1887N>C | p.Leu629Phe | p.L629F | Q9BTA9 | protein_coding | deleterious(0) | probably_damaging(0.991) | TCGA-E2-A10C-01 | Breast | breast invasive carcinoma | Female | <65 | I/II | Chemotherapy | cytoxan | SD |
| WAC | SNV | Missense_Mutation | | c.1595C>A | p.Ser532Tyr | p.S532Y | Q9BTA9 | protein_coding | tolerated(1) | possibly_damaging(0.598) | TCGA-GM-A2D9-01 | Breast | breast invasive carcinoma | Female | >=65 | I/II | Hormone Therapy | arimidex | SD |
| WAC | insertion | Frame_Shift_Ins | novel | c.1537_1538insT | p.Arg513LeufsTer8 | p.R513Lfs*8 | Q9BTA9 | protein_coding | | | TCGA-A2-A0EO-01 | Breast | breast invasive carcinoma | Female | <65 | I/II | Hormone Therapy | tamoxiphen | SD |
| WAC | insertion | Frame_Shift_Ins | novel | c.1538_1539insAGGGAGAATTATTAATCATATCCCCTCACCCCACCAA | p.Ser514GlyfsTer19 | p.S514Gfs*19 | Q9BTA9 | protein_coding | | | TCGA-A2-A0EO-01 | Breast | breast invasive carcinoma | Female | <65 | I/II | Hormone Therapy | tamoxiphen | SD |


