Schematic overview of the cellular and molecular mechanisms involved in the cancer progression, including the proposed cellular and molecular mechanisms in cancer cells trajectory. AT1: alveolar type 1 cells; AT2: alveolar type 2 cells; AAH: atypical adenomatous hyperplasia; AIS: adenocarcinoma in situ; MIA: minimally invasive adenocarcinoma; IA: invasive adenocarcinoma; EMT: epithelial-mesenchymal transition

Home

Download

Statistics

Help

Contact

Center for Computational Systems Medicine
leaf

Gene summary

leaf

Malignant transformation analysis

leaf

Malignant transformation related pathway analysis

leaf

Cell-cell communication analysis

leaf

Single-cell gene regulatory network inference analysis

leaf

Somatic mutation of malignant transformation related genes

leaf

Related drugs of malignant transformation related genes

Gene: PHLDB2

Gene summary for PHLDB2

check button Gene summary.

Gene informationSpeciesHuman
Gene symbol

PHLDB2

Gene ID

90102

Gene namepleckstrin homology like domain family B member 2
Gene AliasLL5b
Cytomap3q13.2
Gene Typeprotein-coding
GO ID

GO:0000226

UniProtAcc

Q86SQ0


Top

Malignant transformation analysis

check button Identification of the aberrant gene expression in precancerous and cancerous lesions by comparing the gene expression of stem-like cells in diseased tissues with normal stem cells
check button Malignant transformation involving gene list.
Entrez IDSymbolReplicatesSpeciesOrganTissueAdj P-valueLog2FCMalignancy
90102PHLDB2CCI_1HumanCervixCC1.53e-039.03e-010.528
90102PHLDB2CCI_3HumanCervixCC7.19e-056.17e-010.516
90102PHLDB2CCII_1HumanCervixCC7.87e-063.42e-010.3249
90102PHLDB2sample1HumanCervixCC3.20e-228.14e-010.0959
90102PHLDB2T1HumanCervixCC6.64e-459.32e-010.0918
90102PHLDB2LZE4THumanEsophagusESCC1.39e-331.16e+000.0811
90102PHLDB2LZE7THumanEsophagusESCC6.41e-081.60e+000.0667
90102PHLDB2LZE8THumanEsophagusESCC3.86e-083.59e-010.067
90102PHLDB2LZE20THumanEsophagusESCC4.68e-021.11e-010.0662
90102PHLDB2LZE21THumanEsophagusESCC5.44e-073.37e-010.0655
90102PHLDB2P2T-EHumanEsophagusESCC5.40e-04-1.07e-010.1177
90102PHLDB2P4T-EHumanEsophagusESCC1.44e-167.51e-010.1323
90102PHLDB2P5T-EHumanEsophagusESCC1.71e-145.23e-010.1327
90102PHLDB2P9T-EHumanEsophagusESCC2.88e-341.29e+000.1131
90102PHLDB2P10T-EHumanEsophagusESCC3.36e-072.54e-010.116
90102PHLDB2P11T-EHumanEsophagusESCC1.31e-241.24e+000.1426
90102PHLDB2P12T-EHumanEsophagusESCC3.70e-042.27e-010.1122
90102PHLDB2P15T-EHumanEsophagusESCC2.04e-236.81e-010.1149
90102PHLDB2P16T-EHumanEsophagusESCC3.44e-095.54e-020.1153
90102PHLDB2P17T-EHumanEsophagusESCC2.22e-064.54e-010.1278
Page: 1 2 3 4 5 6 

check button Transcriptomic changes along malignancy continuum.
TissueExpression DynamicsAbbreviation
CervixThe image shows the transcriptomic changes along malignancy continuum.log2FC in expression of this searched gene in stem-like cells from each diseased tissue sample relative to stem-like cells in normal samples in each tissue plotted against the malignancy continuum. Samples are colored based on if they are from different disease stage.CC: Cervix cancer
HSIL_HPV: HPV-infected high-grade squamous intraepithelial lesions
N_HPV: HPV-infected normal cervix
EsophagusThe image shows the transcriptomic changes along malignancy continuum.log2FC in expression of this searched gene in stem-like cells from each diseased tissue sample relative to stem-like cells in normal samples in each tissue plotted against the malignancy continuum. Samples are colored based on if they are from different disease stage.
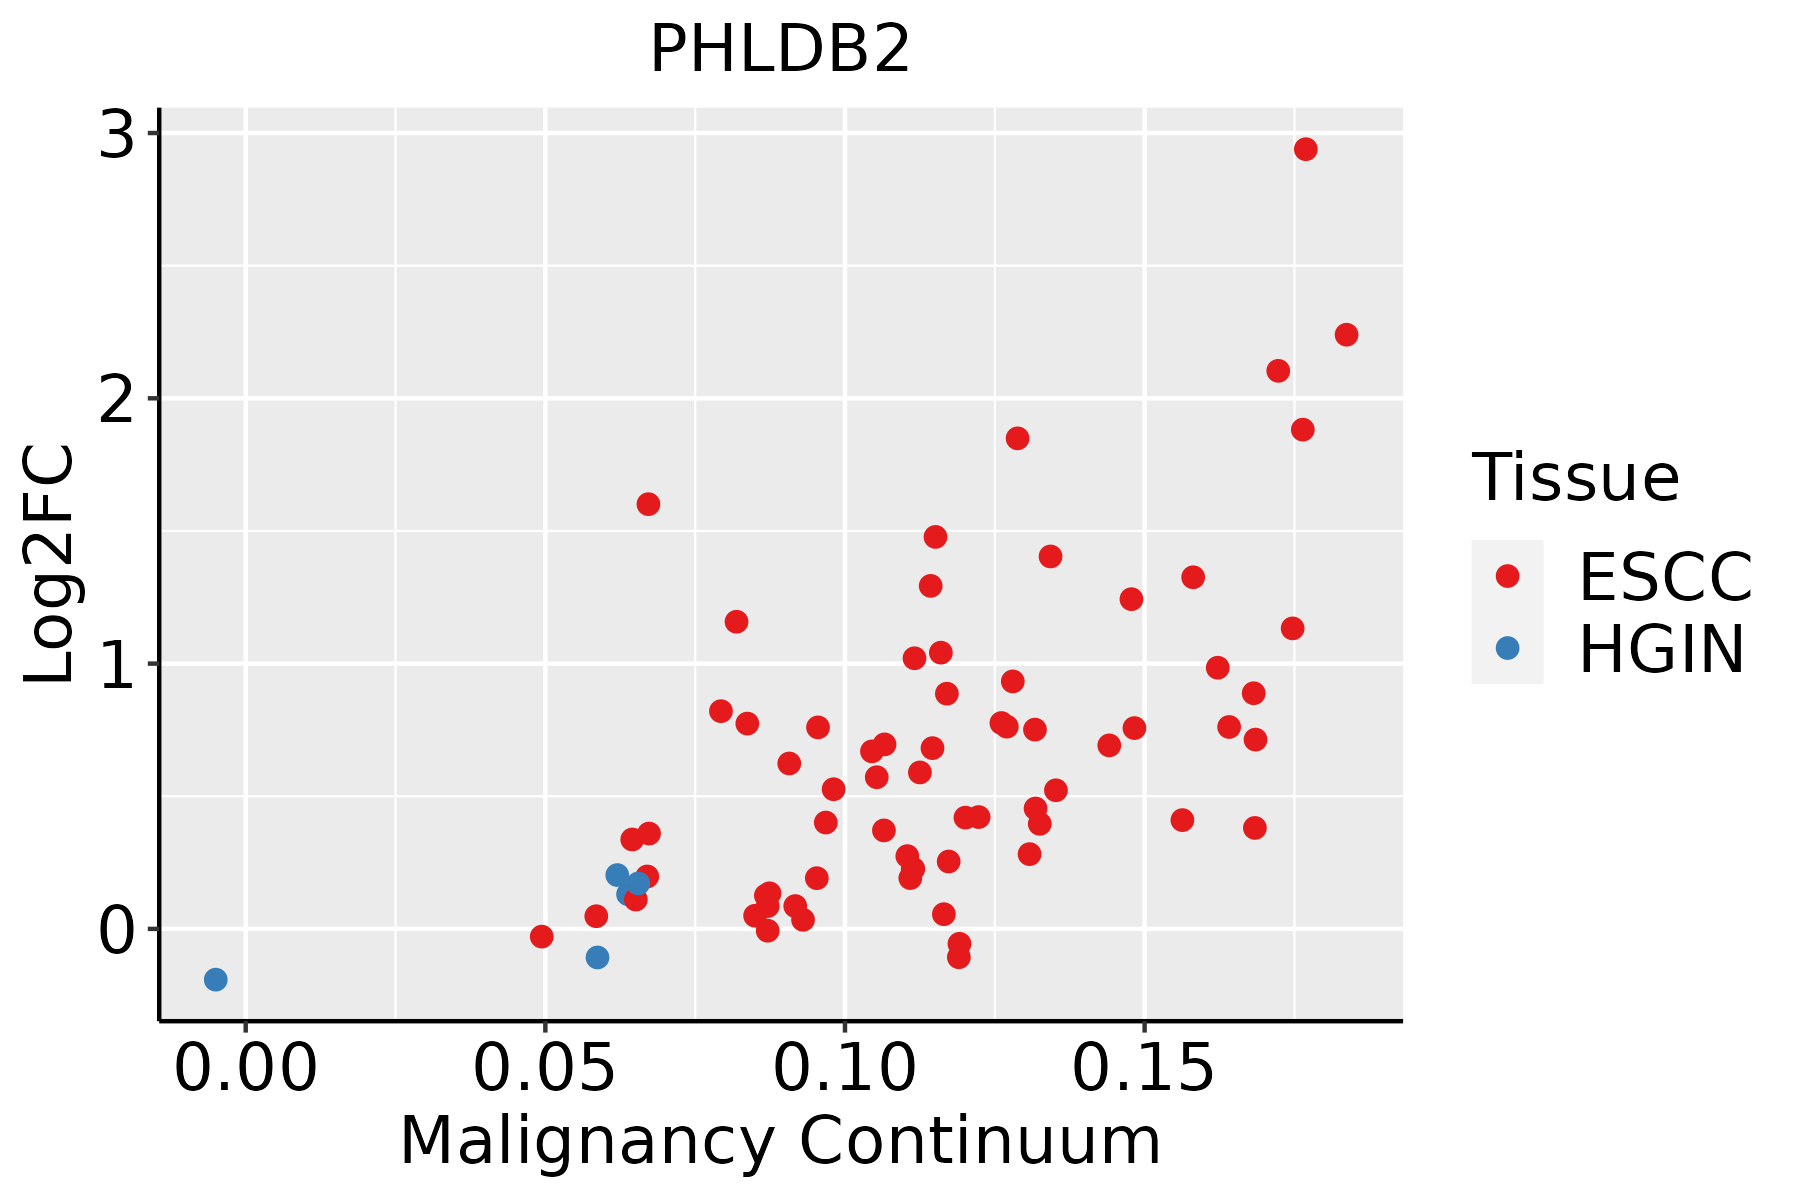
ESCC: Esophageal squamous cell carcinoma
HGIN: High-grade intraepithelial neoplasias
LGIN: Low-grade intraepithelial neoplasias
LungThe image shows the transcriptomic changes along malignancy continuum.log2FC in expression of this searched gene in stem-like cells from each diseased tissue sample relative to stem-like cells in normal samples in each tissue plotted against the malignancy continuum. Samples are colored based on if they are from different disease stage.
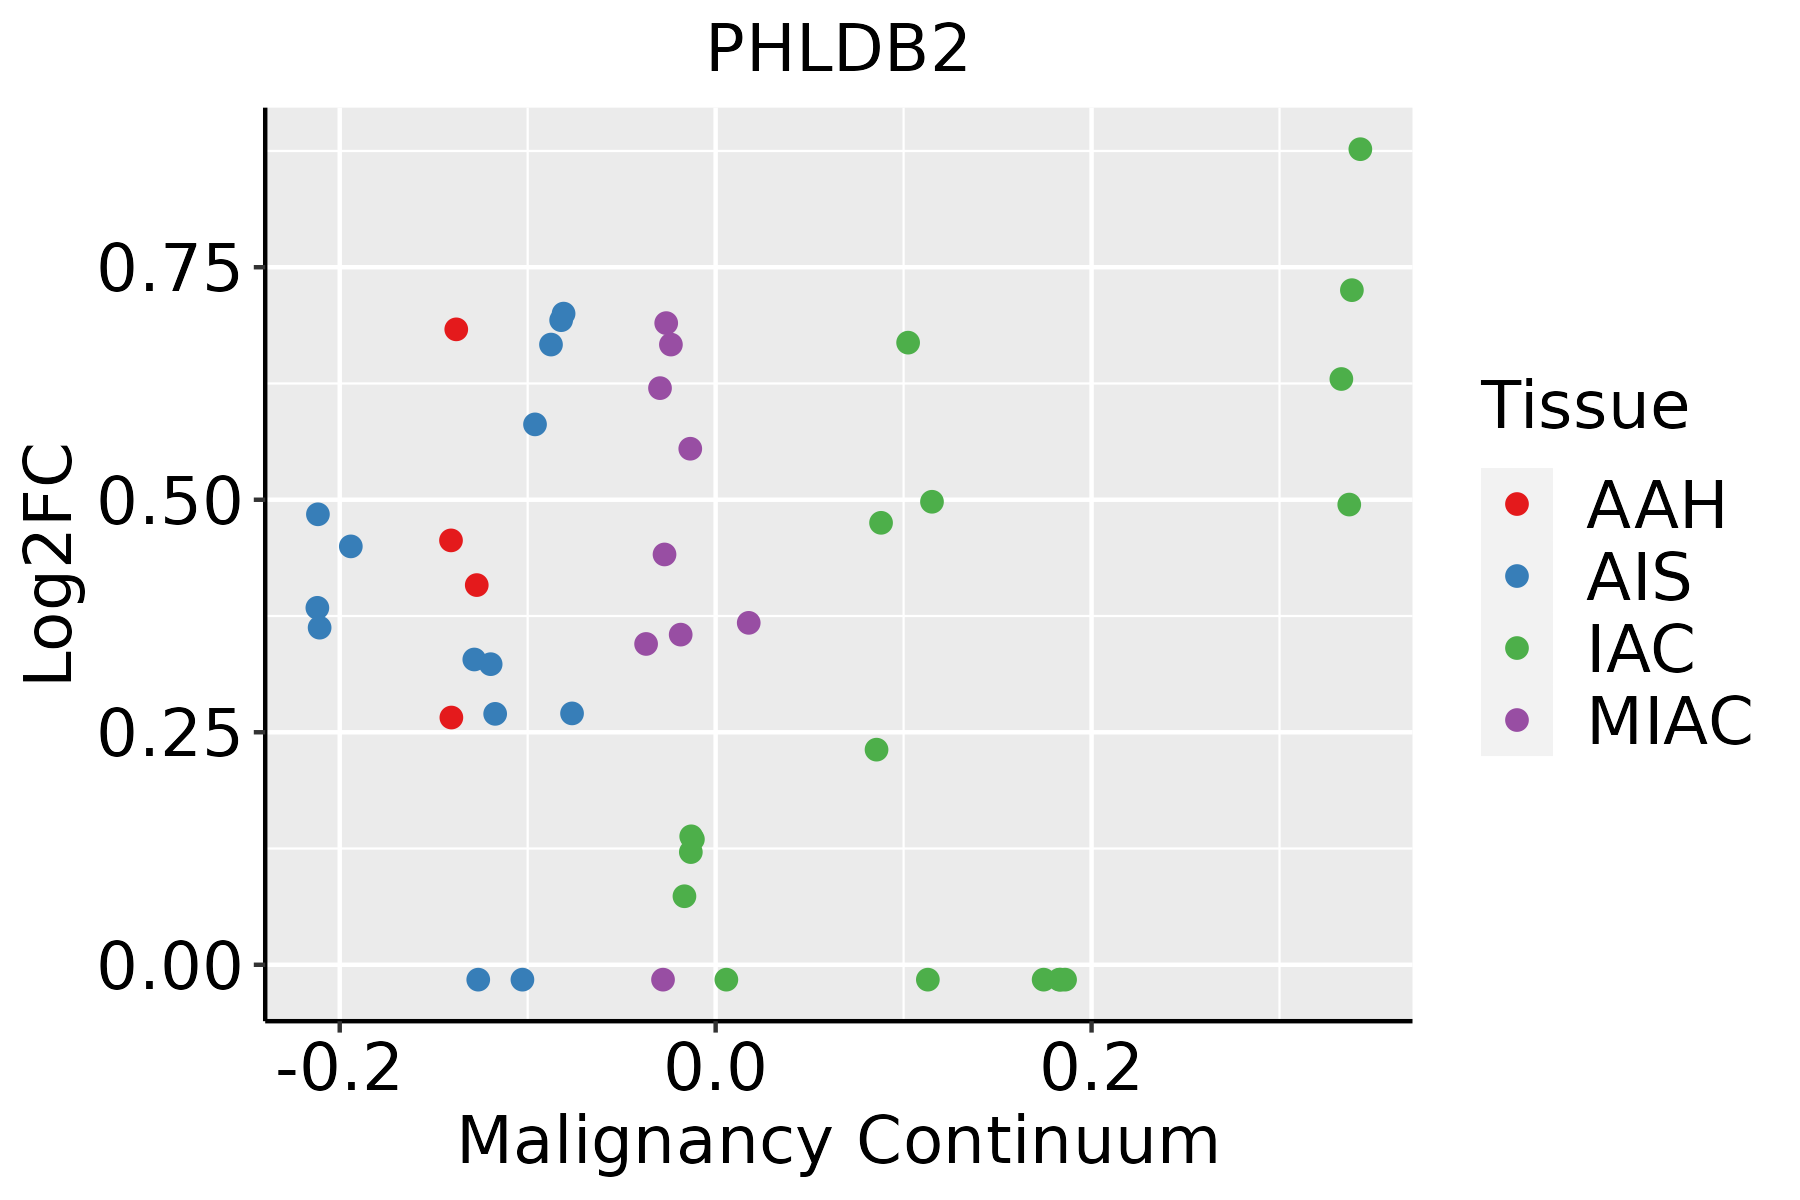
AAH: Atypical adenomatous hyperplasia
AIS: Adenocarcinoma in situ
IAC: Invasive lung adenocarcinoma
MIA: Minimally invasive adenocarcinoma
Oral CavityThe image shows the transcriptomic changes along malignancy continuum.log2FC in expression of this searched gene in stem-like cells from each diseased tissue sample relative to stem-like cells in normal samples in each tissue plotted against the malignancy continuum. Samples are colored based on if they are from different disease stage.
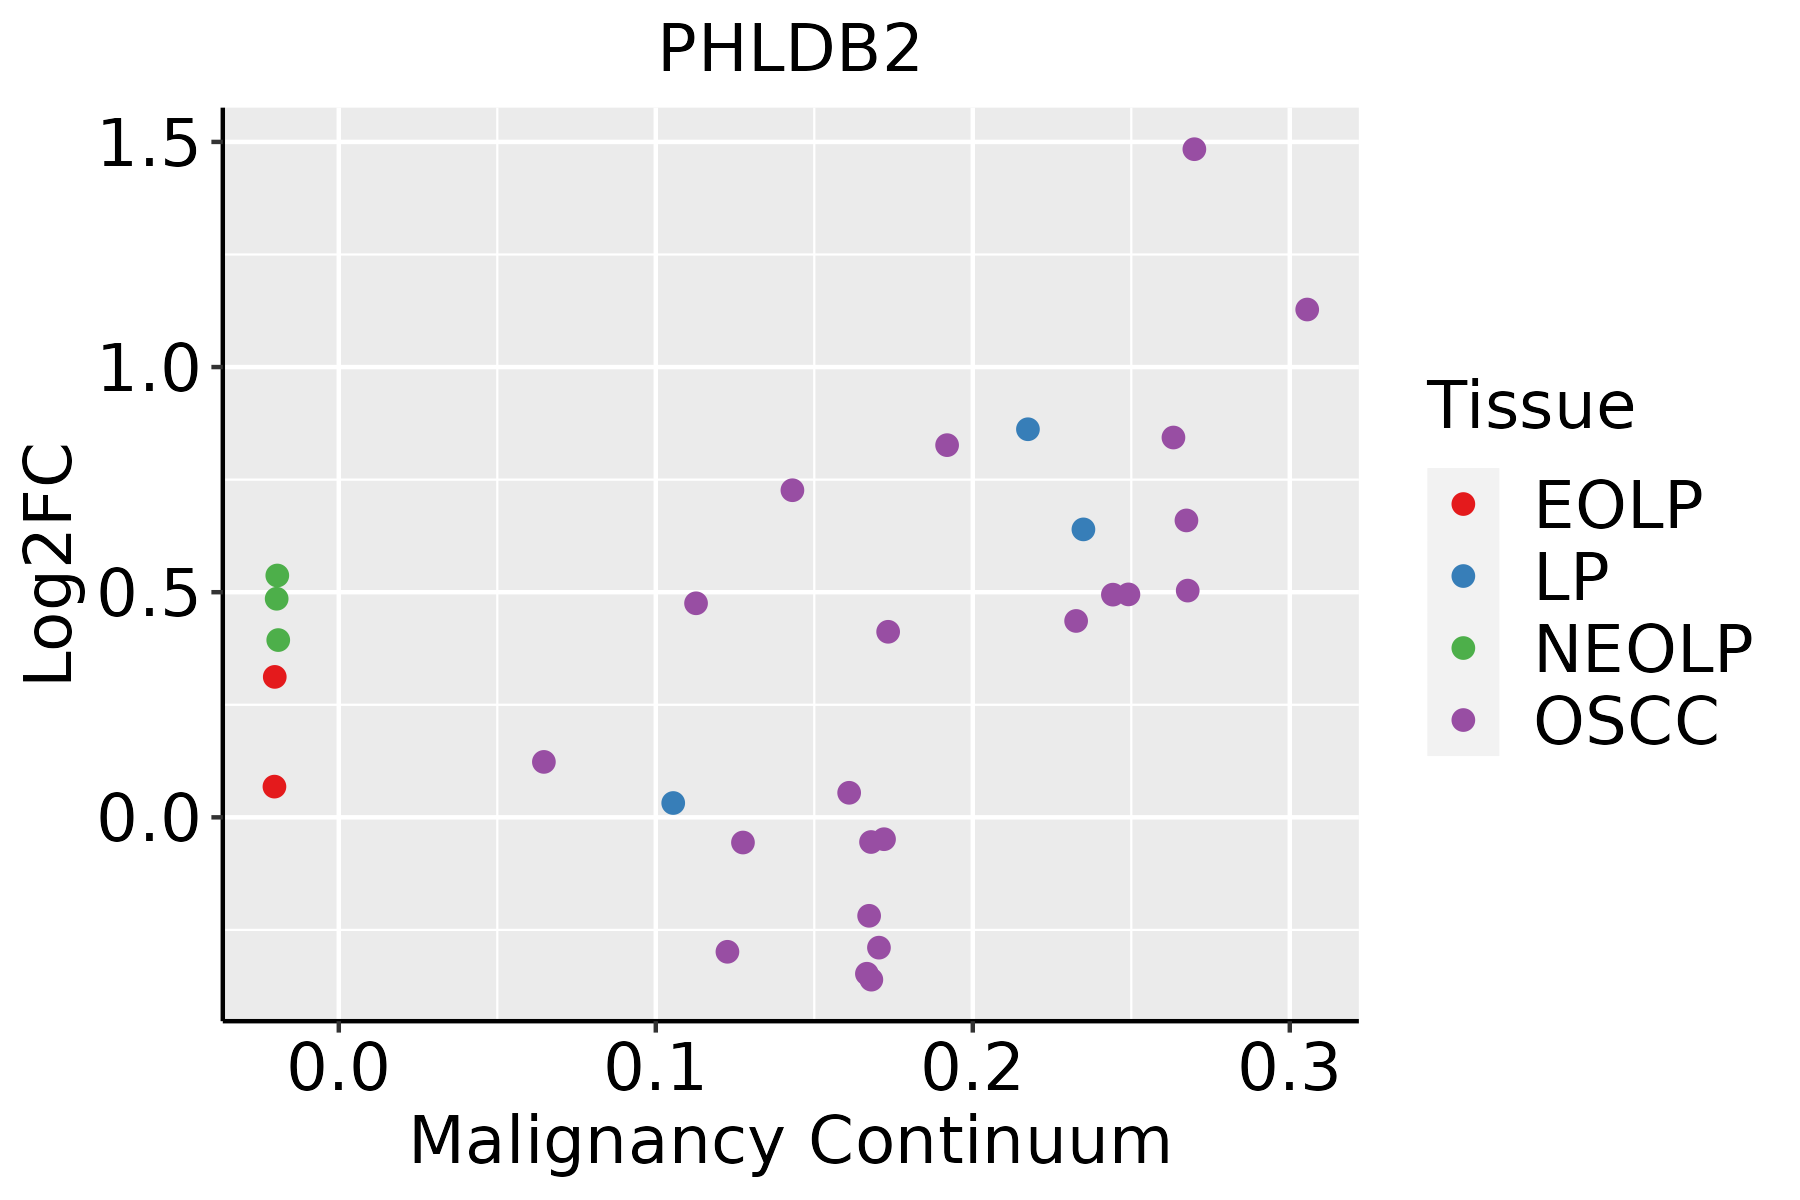
EOLP: Erosive Oral lichen planus
LP: leukoplakia
NEOLP: Non-erosive oral lichen planus
OSCC: Oral squamous cell carcinoma
ProstateThe image shows the transcriptomic changes along malignancy continuum.log2FC in expression of this searched gene in stem-like cells from each diseased tissue sample relative to stem-like cells in normal samples in each tissue plotted against the malignancy continuum. Samples are colored based on if they are from different disease stage.
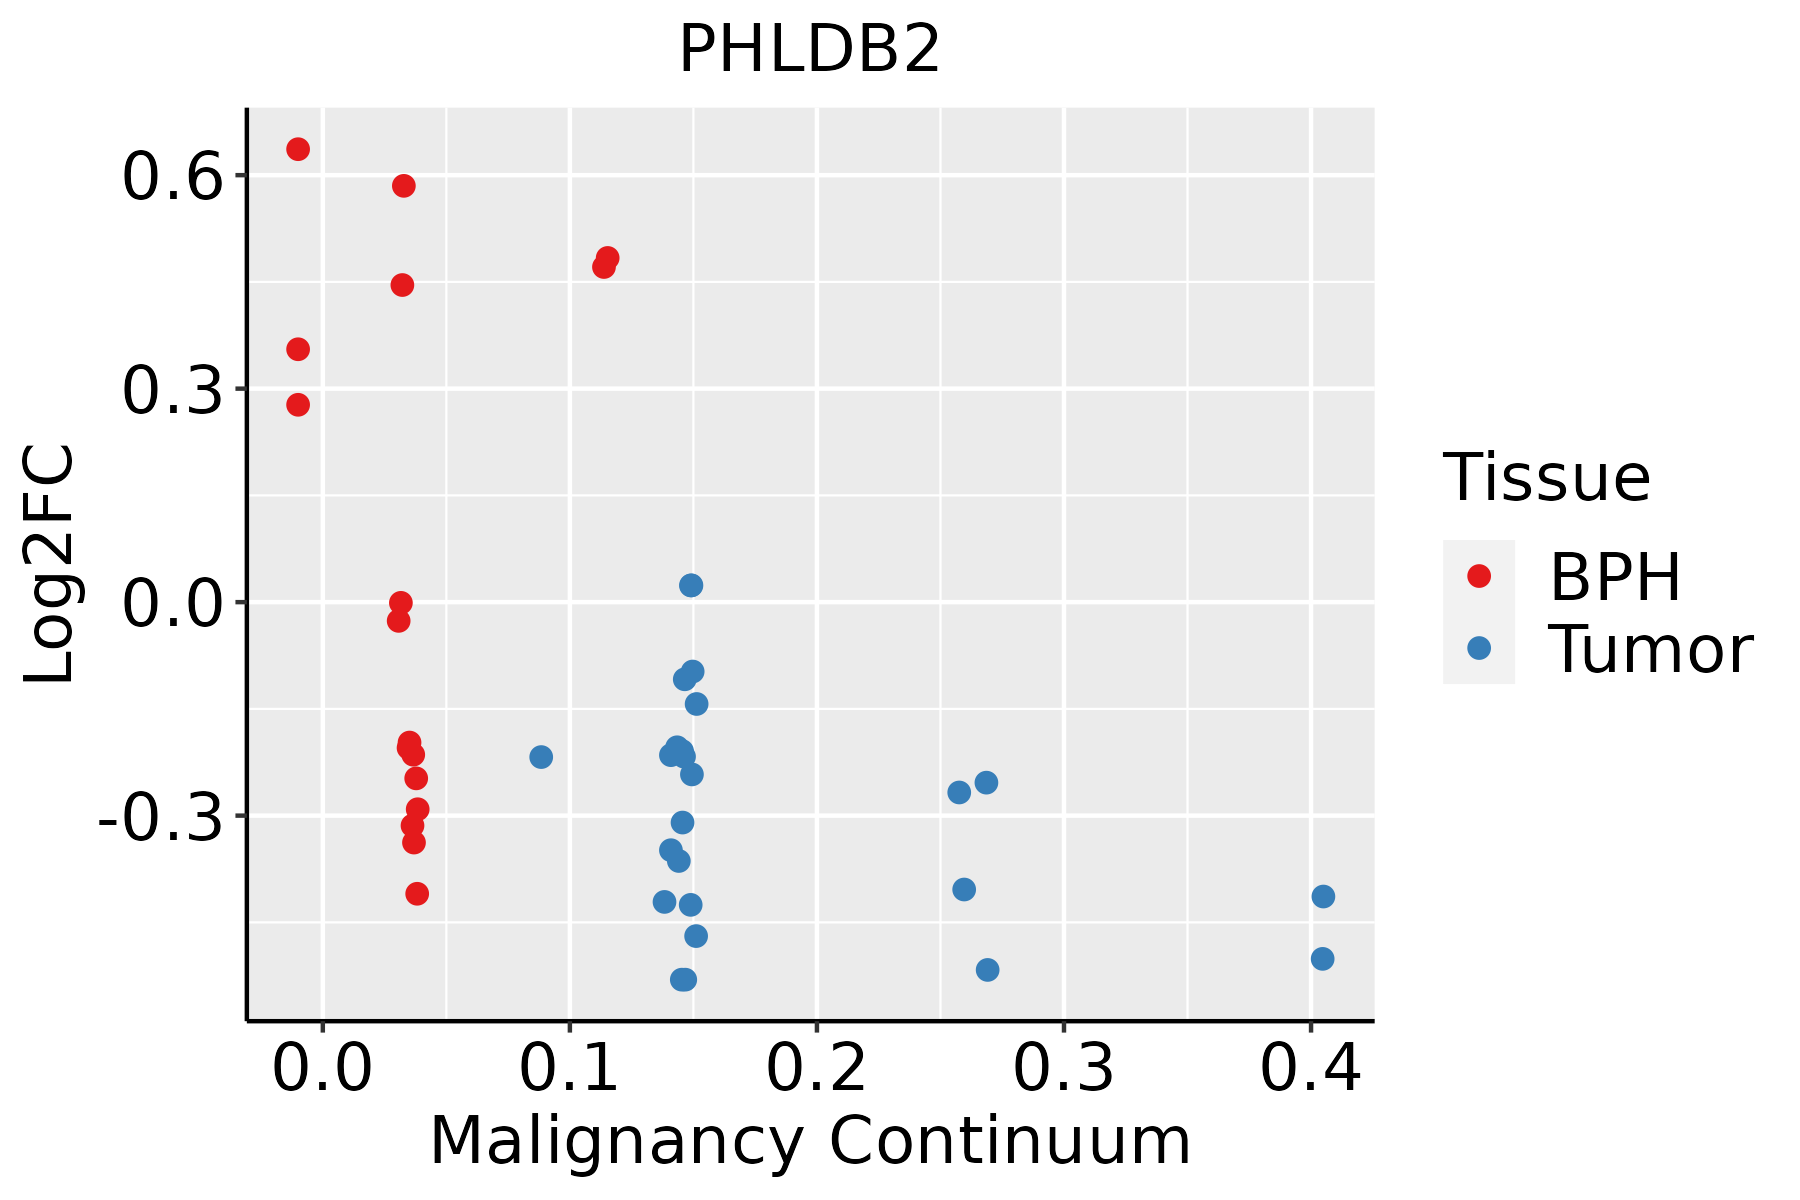
BPH: Benign Prostatic Hyperplasia
SkinThe image shows the transcriptomic changes along malignancy continuum.log2FC in expression of this searched gene in stem-like cells from each diseased tissue sample relative to stem-like cells in normal samples in each tissue plotted against the malignancy continuum. Samples are colored based on if they are from different disease stage.
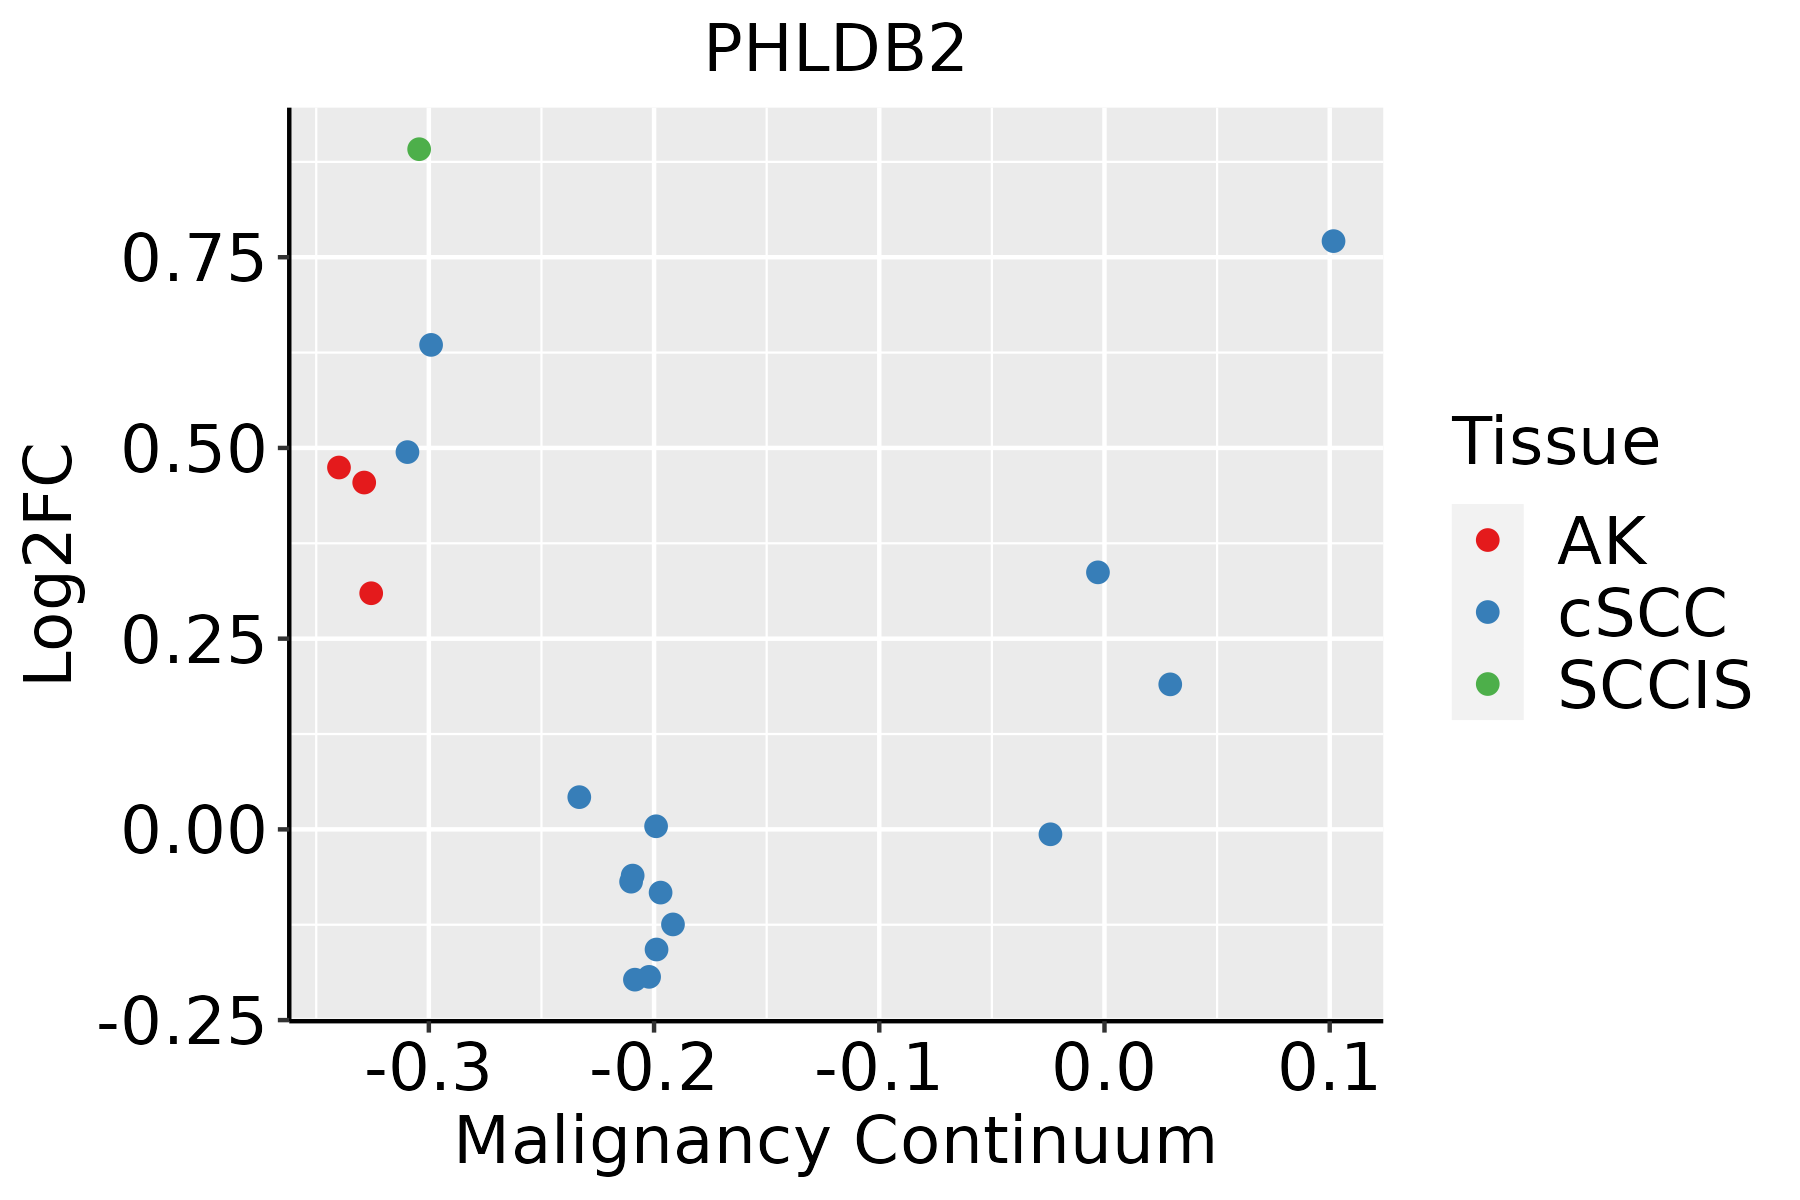
AK: Actinic keratosis
cSCC: Cutaneous squamous cell carcinoma
SCCIS:squamous cell carcinoma in situ
ThyroidThe image shows the transcriptomic changes along malignancy continuum.log2FC in expression of this searched gene in stem-like cells from each diseased tissue sample relative to stem-like cells in normal samples in each tissue plotted against the malignancy continuum. Samples are colored based on if they are from different disease stage.
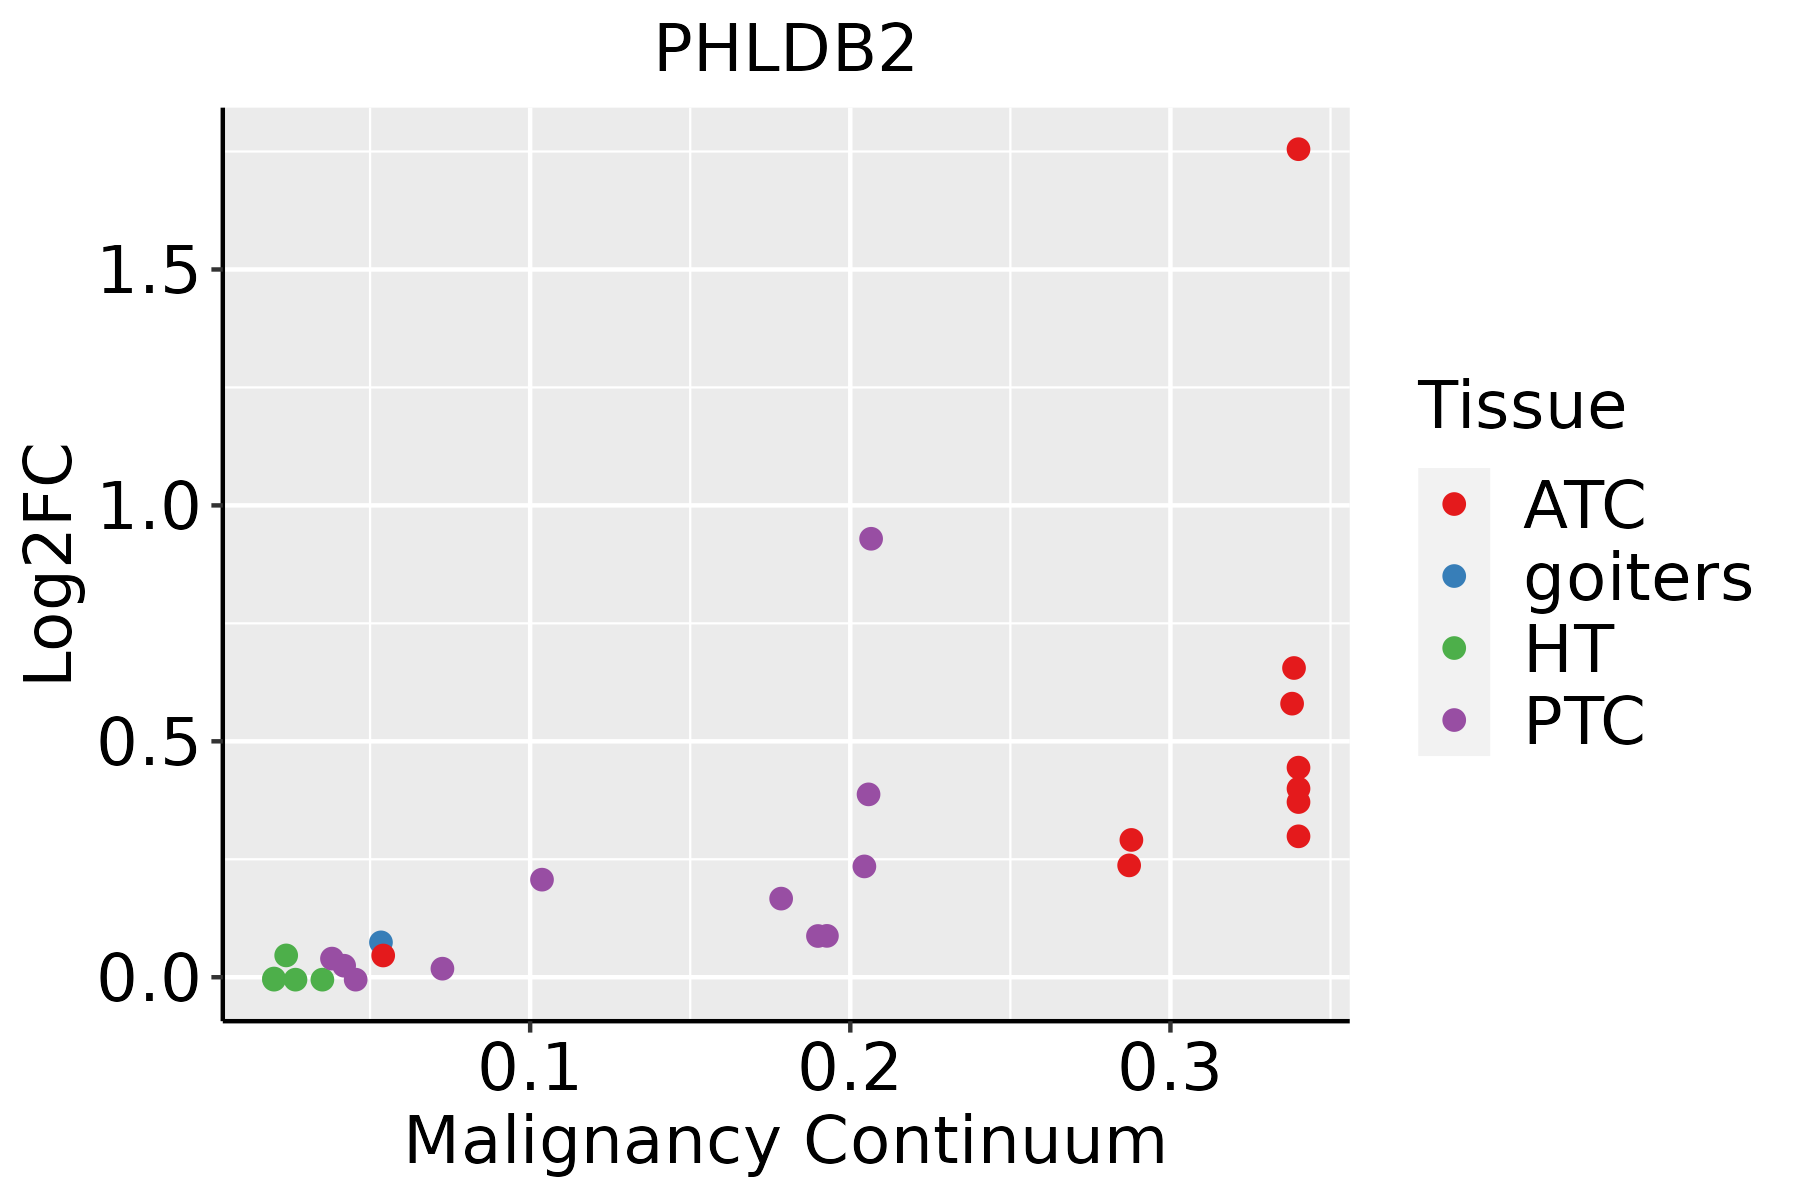
ATC: Anaplastic thyroid cancer
HT: Hashimoto's thyroiditis
PTC: Papillary thyroid cancer
∗log2FC in expression of this searched gene in stem-like cells from each diseased tissue sample relative to stem-like cells in normal samples in each tissue plotted against the malignancy continuum. Samples are colored based on if they are from different disease stage.

Top

Malignant transformation related pathway analysis

check buttonFind out the enriched GO biological processes and KEGG pathways involved in transition from healthy to precancer to cancer
check button Figure of enriched GO biological processes.
TissueDisease StageEnriched GO biological Processes
ColorectumADGO analysis - Figure of enriched GO biological processes: Top 15 enriched GO BP terms are showed in the bar plot of each disease state in each tissue. Each row represents a significant GO biological process which is colored according to the -log10(p.adjust).
ColorectumSERGO analysis - Figure of enriched GO biological processes: Top 15 enriched GO BP terms are showed in the bar plot of each disease state in each tissue. Each row represents a significant GO biological process which is colored according to the -log10(p.adjust).
ColorectumMSSGO analysis - Figure of enriched GO biological processes: Top 15 enriched GO BP terms are showed in the bar plot of each disease state in each tissue. Each row represents a significant GO biological process which is colored according to the -log10(p.adjust).
ColorectumMSI-HGO analysis - Figure of enriched GO biological processes: Top 15 enriched GO BP terms are showed in the bar plot of each disease state in each tissue. Each row represents a significant GO biological process which is colored according to the -log10(p.adjust).
ColorectumFAPGO analysis - Figure of enriched GO biological processes: Top 15 enriched GO BP terms are showed in the bar plot of each disease state in each tissue. Each row represents a significant GO biological process which is colored according to the -log10(p.adjust).
∗Top 15 enriched GO BP terms are showed in the bar plot of each disease state in each tissue. Each row represents a significant GO biological process which is colored according to the -log10(p.adjust).
Page: 1 2 3 4 5 6 7 8 9 

check button Enriched GO biological processes.
GO IDTissueDisease StageDescriptionGene RatioBg Ratiopvaluep.adjustCount
GO:0061572210ThyroidATCactin filament bundle organization86/6293161/187231.68e-072.69e-0686
GO:004876221ThyroidATCmesenchymal cell differentiation116/6293236/187235.08e-077.30e-06116
GO:190305311ThyroidATCregulation of extracellular matrix organization33/629348/187236.86e-079.33e-0633
GO:003103226ThyroidATCactomyosin structure organization98/6293196/187231.44e-061.77e-0598
GO:003432924ThyroidATCcell junction assembly187/6293420/187231.71e-062.08e-05187
GO:006048521ThyroidATCmesenchyme development136/6293291/187232.04e-062.43e-05136
GO:003288613ThyroidATCregulation of microtubule-based process114/6293240/187235.17e-065.59e-05114
GO:003223128ThyroidATCregulation of actin filament bundle assembly57/6293105/187231.01e-051.00e-0457
GO:0030038111ThyroidATCcontractile actin filament bundle assembly57/6293106/187231.48e-051.39e-0457
GO:0043149111ThyroidATCstress fiber assembly57/6293106/187231.48e-051.39e-0457
GO:000736915ThyroidATCgastrulation90/6293185/187231.54e-051.43e-0490
GO:005149228ThyroidATCregulation of stress fiber assembly50/629391/187232.25e-052.00e-0450
GO:001017111ThyroidATCbody morphogenesis28/629343/187232.35e-052.06e-0428
GO:190290426ThyroidATCnegative regulation of supramolecular fiber organization82/6293167/187232.35e-052.06e-0482
GO:001071712ThyroidATCregulation of epithelial to mesenchymal transition53/629399/187233.42e-052.82e-0453
GO:000201115ThyroidATCmorphogenesis of an epithelial sheet34/629357/187234.91e-053.90e-0434
GO:011002028ThyroidATCregulation of actomyosin structure organization53/6293100/187234.92e-053.90e-0453
GO:008502911ThyroidATCextracellular matrix assembly28/629345/187237.91e-055.95e-0428
GO:190188818ThyroidATCregulation of cell junction assembly94/6293204/187231.38e-049.65e-0494
GO:0051494110ThyroidATCnegative regulation of cytoskeleton organization76/6293163/187233.68e-042.27e-0376
Page: 1 2 3 4 5 6 7 8 9 10 11 12 13 14 15 16 17 18 19 20 21 22 23 24 25 26 27 28 29 30 31 32 33 34 35 36 37 38 39 

check button Enriched KEGG pathways.
Pathway IDTissueDisease StageDescriptionGene RatioBg Ratiopvaluep.adjustqvalueCount
Page: 1 

Top

Cell-cell communication analysis

check buttonIdentification of potential cell-cell interactions between two cell types and their ligand-receptor pairs for different disease states
LigandReceptorLRpairPathwayTissueDisease Stage
Page: 1 

Top

Single-cell gene regulatory network inference analysis

check buttonFind out the significant the regulons (TFs) and the target genes of each regulon across cell types for different disease states
TFCell TypeTissueDisease StageTarget GeneRSSRegulon Activity
∗The dot plots of a searched regulon are shown for all cell subpopulations in each disease state of each tissue based on the regulon specific score inferred using pySCENIC and by calculating the average expression.
Page: 1 

Top

Somatic mutation of malignant transformation related genes

check buttonAnnotation of somatic variants for genes involved in malignant transformation
Hugo SymbolVariant ClassVariant ClassificationdbSNP RSHGVScHGVSpHGVSp ShortSWISSPROTBIOTYPESIFTPolyPhenTumor Sample BarcodeTissueHistologySexAgeStageTherapy TypesDrugsOutcome
PHLDB2SNVMissense_Mutationnovelc.1172N>Tp.Asp391Valp.D391VQ86SQ0protein_codingdeleterious(0)benign(0.203)TCGA-A7-A425-01Breastbreast invasive carcinomaFemale>=65III/IVChemotherapyadriamycinPD
PHLDB2SNVMissense_Mutationnovelc.3502N>Ap.Asp1168Asnp.D1168NQ86SQ0protein_codingdeleterious(0)probably_damaging(0.999)TCGA-AN-A046-01Breastbreast invasive carcinomaFemale>=65I/IIUnknownUnknownSD
PHLDB2SNVMissense_Mutationc.359N>Ap.Gly120Glup.G120EQ86SQ0protein_codingtolerated_low_confidence(0.09)benign(0.018)TCGA-AR-A250-01Breastbreast invasive carcinomaFemale<65I/IIChemotherapydoxorubicinSD
PHLDB2SNVMissense_Mutationc.1708N>Gp.Ile570Valp.I570VQ86SQ0protein_codingtolerated(0.1)benign(0.255)TCGA-B6-A0WV-01Breastbreast invasive carcinomaFemale>=65I/IIUnknownUnknownSD
PHLDB2SNVMissense_Mutationc.604C>Tp.Pro202Serp.P202SQ86SQ0protein_codingdeleterious(0)possibly_damaging(0.549)TCGA-BH-A1FU-01Breastbreast invasive carcinomaFemale<65I/IIUnknownUnknownPD
PHLDB2SNVMissense_Mutationc.1690N>Cp.Glu564Glnp.E564QQ86SQ0protein_codingdeleterious(0.05)benign(0.388)TCGA-BH-A209-01Breastbreast invasive carcinomaFemale>=65I/IIUnknownUnknownSD
PHLDB2SNVMissense_Mutationc.1608N>Tp.Arg536Serp.R536SQ86SQ0protein_codingtolerated(0.07)benign(0.057)TCGA-D8-A1XG-01Breastbreast invasive carcinomaFemale>=65III/IVUnknownUnknownSD
PHLDB2SNVMissense_Mutationc.3134N>Tp.Ala1045Valp.A1045VQ86SQ0protein_codingdeleterious(0)probably_damaging(0.999)TCGA-D8-A1XK-01Breastbreast invasive carcinomaFemale<65I/IIChemotherapydoxorubicine+cyclophosphamideSD
PHLDB2SNVMissense_Mutationnovelc.7N>Ap.Glu3Lysp.E3KQ86SQ0protein_codingdeleterious_low_confidence(0)benign(0.214)TCGA-D8-A27V-01Breastbreast invasive carcinomaFemale<65I/IIHormone TherapytamoxiphenSD
PHLDB2SNVMissense_Mutationnovelc.3132N>Tp.Gln1044Hisp.Q1044HQ86SQ0protein_codingdeleterious(0)possibly_damaging(0.885)TCGA-LQ-A4E4-01Breastbreast invasive carcinomaFemale>=65III/IVHormone TherapyanastrozolePD
Page: 1 2 3 4 5 6 7 8 9 10 11 12 13 14 15 

Top

Related drugs of malignant transformation related genes

check buttonIdentification of chemicals and drugs interact with genes involved in malignant transfromation
(DGIdb 4.0)
Entrez IDSymbolCategoryInteraction TypesDrug Claim NameDrug NamePMIDs
Page: 1