| Tissue | Expression Dynamics | Abbreviation |
| Breast |  | IDC: Invasive ductal carcinoma |
| DCIS: Ductal carcinoma in situ |
| Precancer(BRCA1-mut): Precancerous lesion from BRCA1 mutation carriers |
| Cervix | 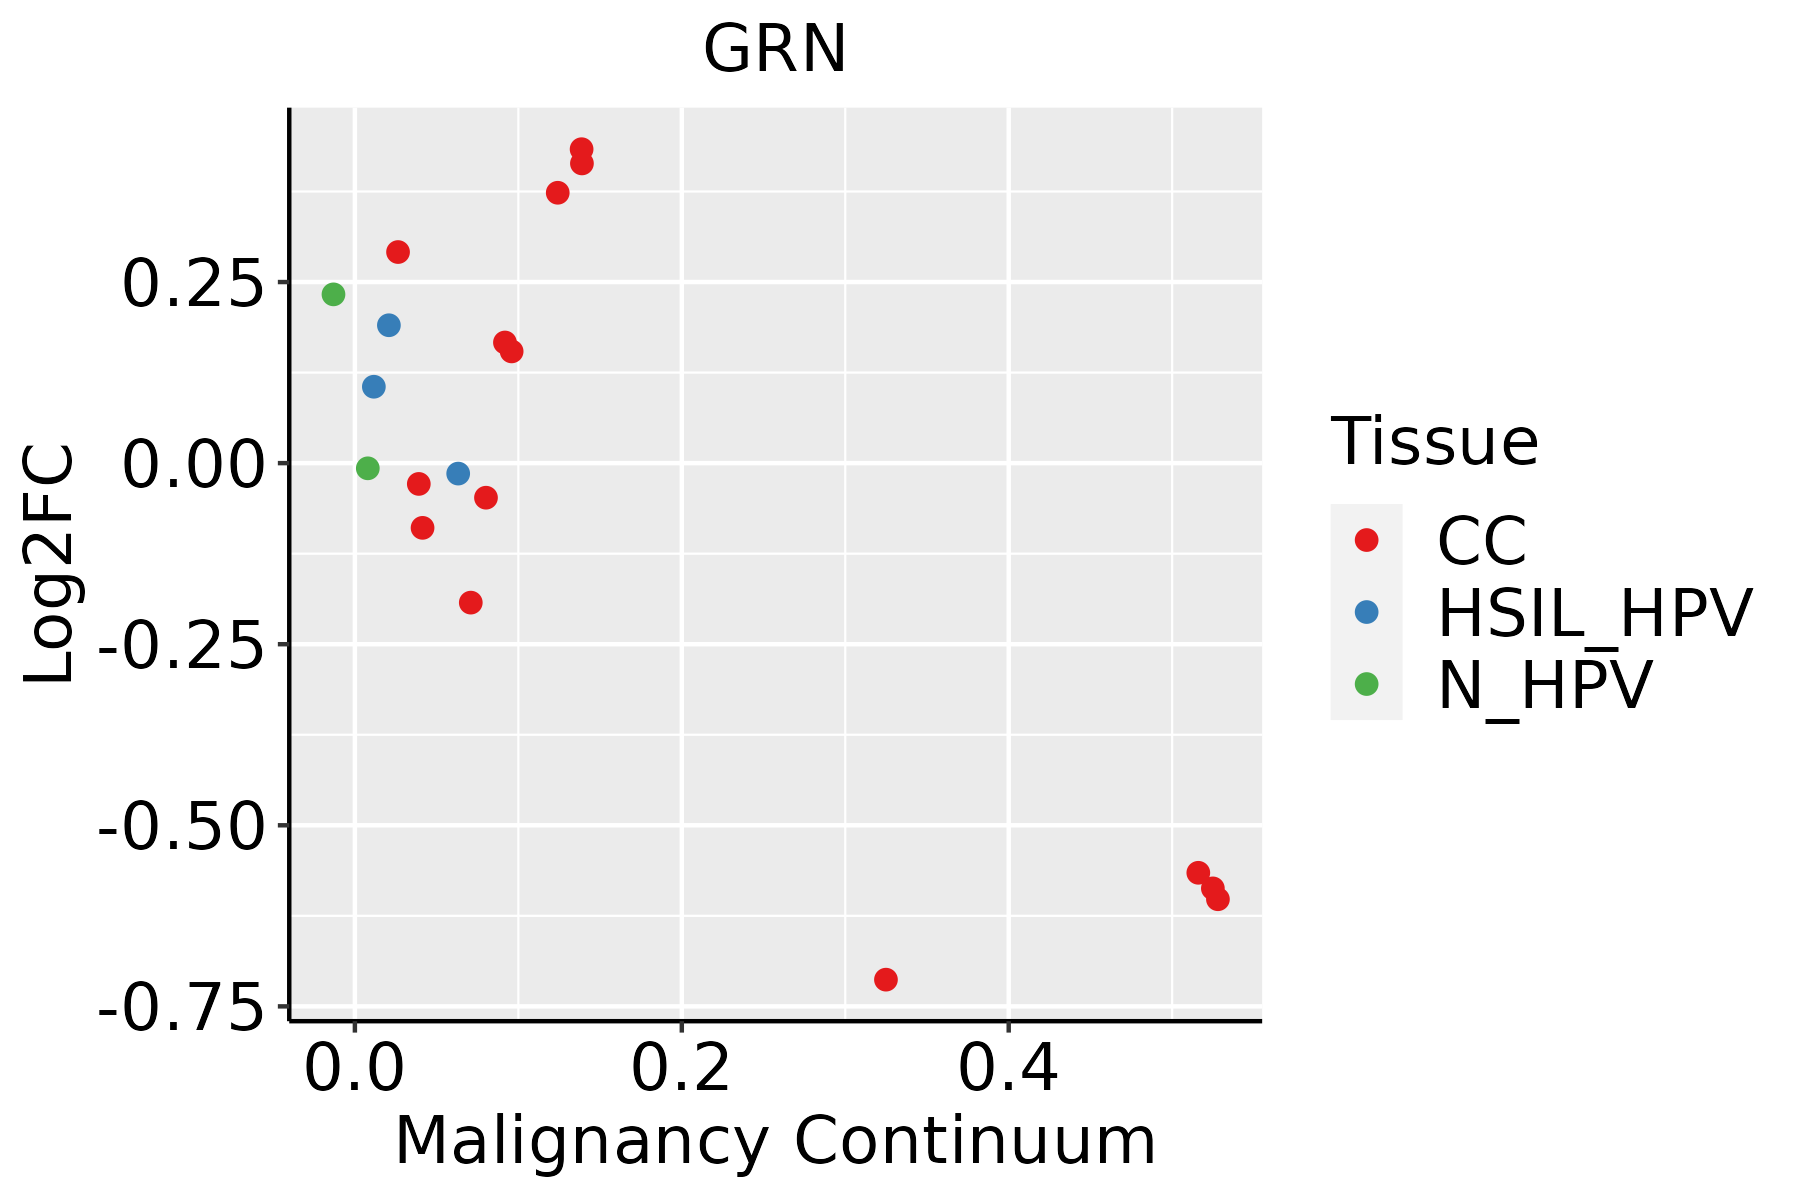 | CC: Cervix cancer |
| HSIL_HPV: HPV-infected high-grade squamous intraepithelial lesions |
| N_HPV: HPV-infected normal cervix |
| Colorectum (GSE201348) |  | FAP: Familial adenomatous polyposis |
| CRC: Colorectal cancer |
| Colorectum (HTA11) |  | AD: Adenomas |
| SER: Sessile serrated lesions |
| MSI-H: Microsatellite-high colorectal cancer |
| MSS: Microsatellite stable colorectal cancer |
| Endometrium | 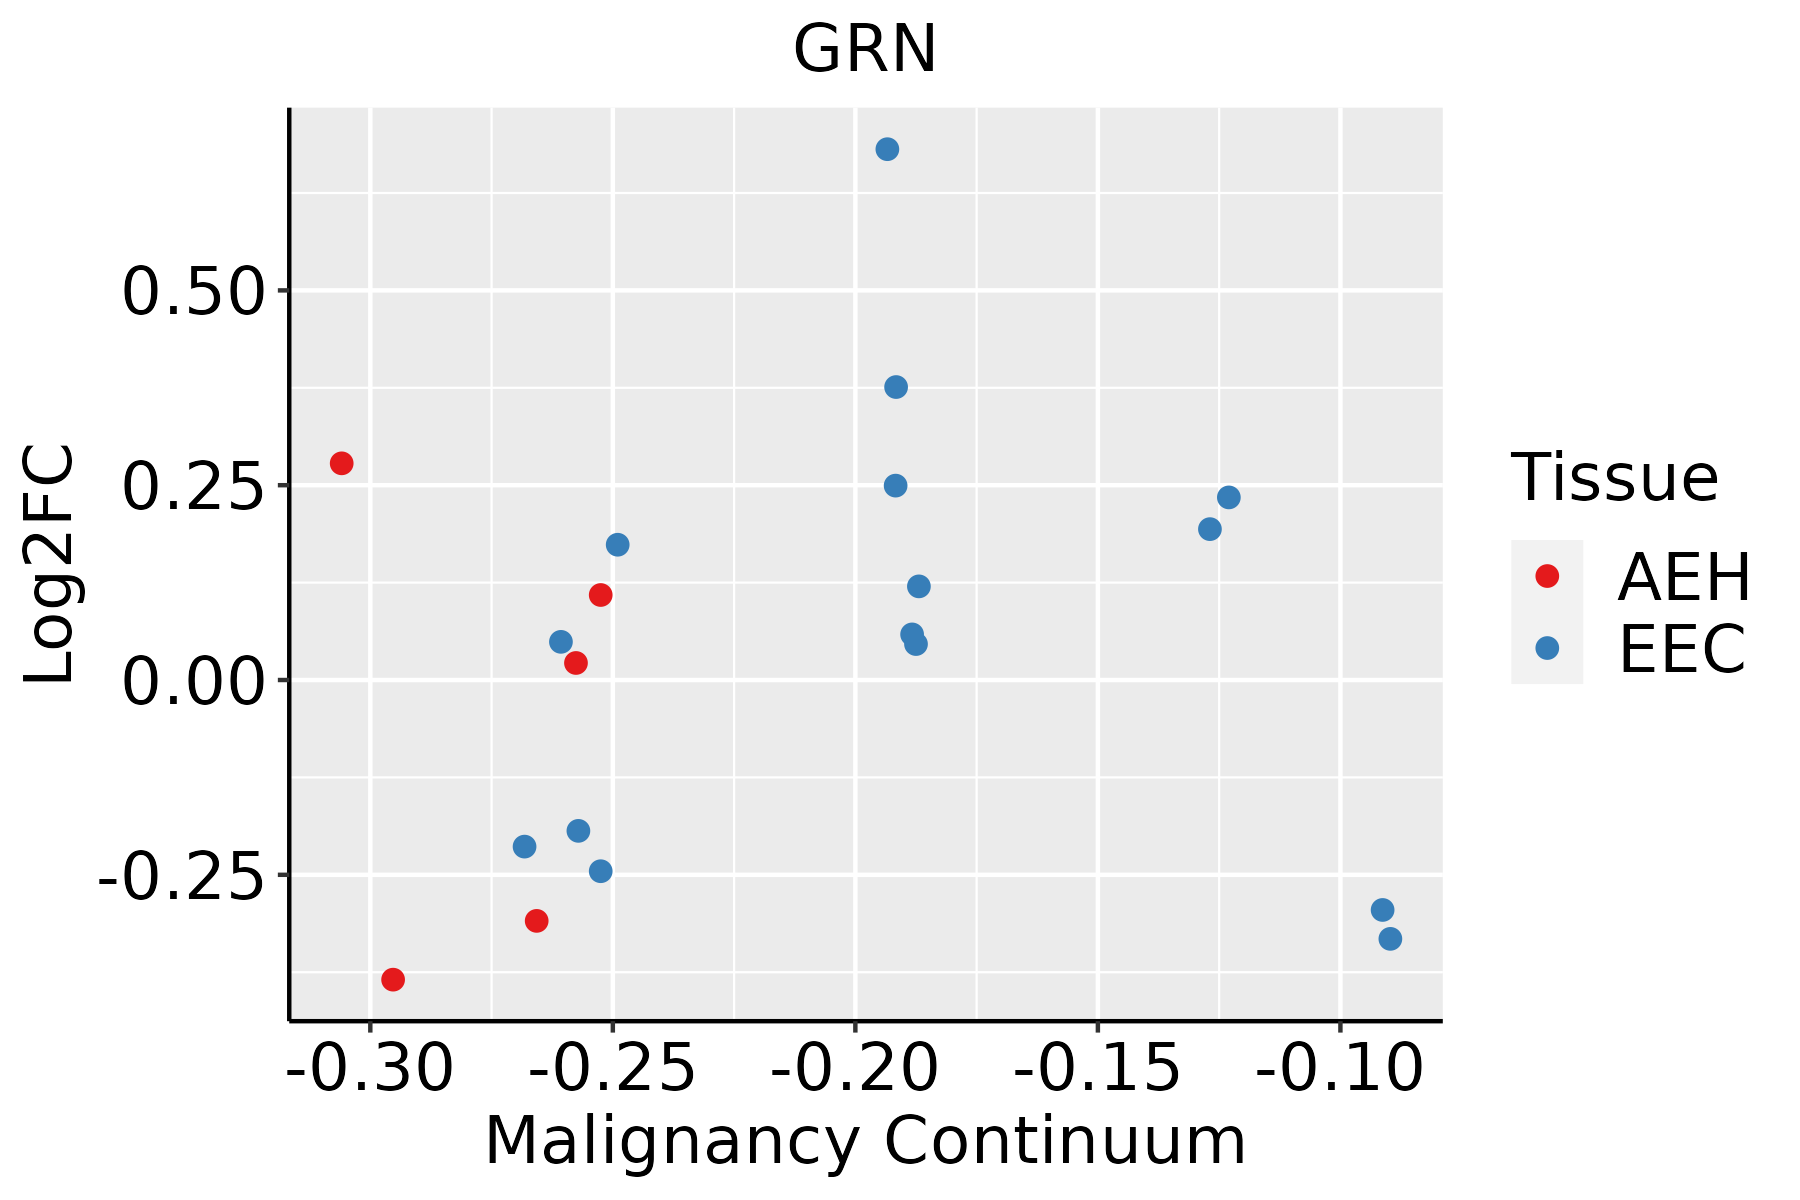 | AEH: Atypical endometrial hyperplasia |
| EEC: Endometrioid Cancer |
| Esophagus | 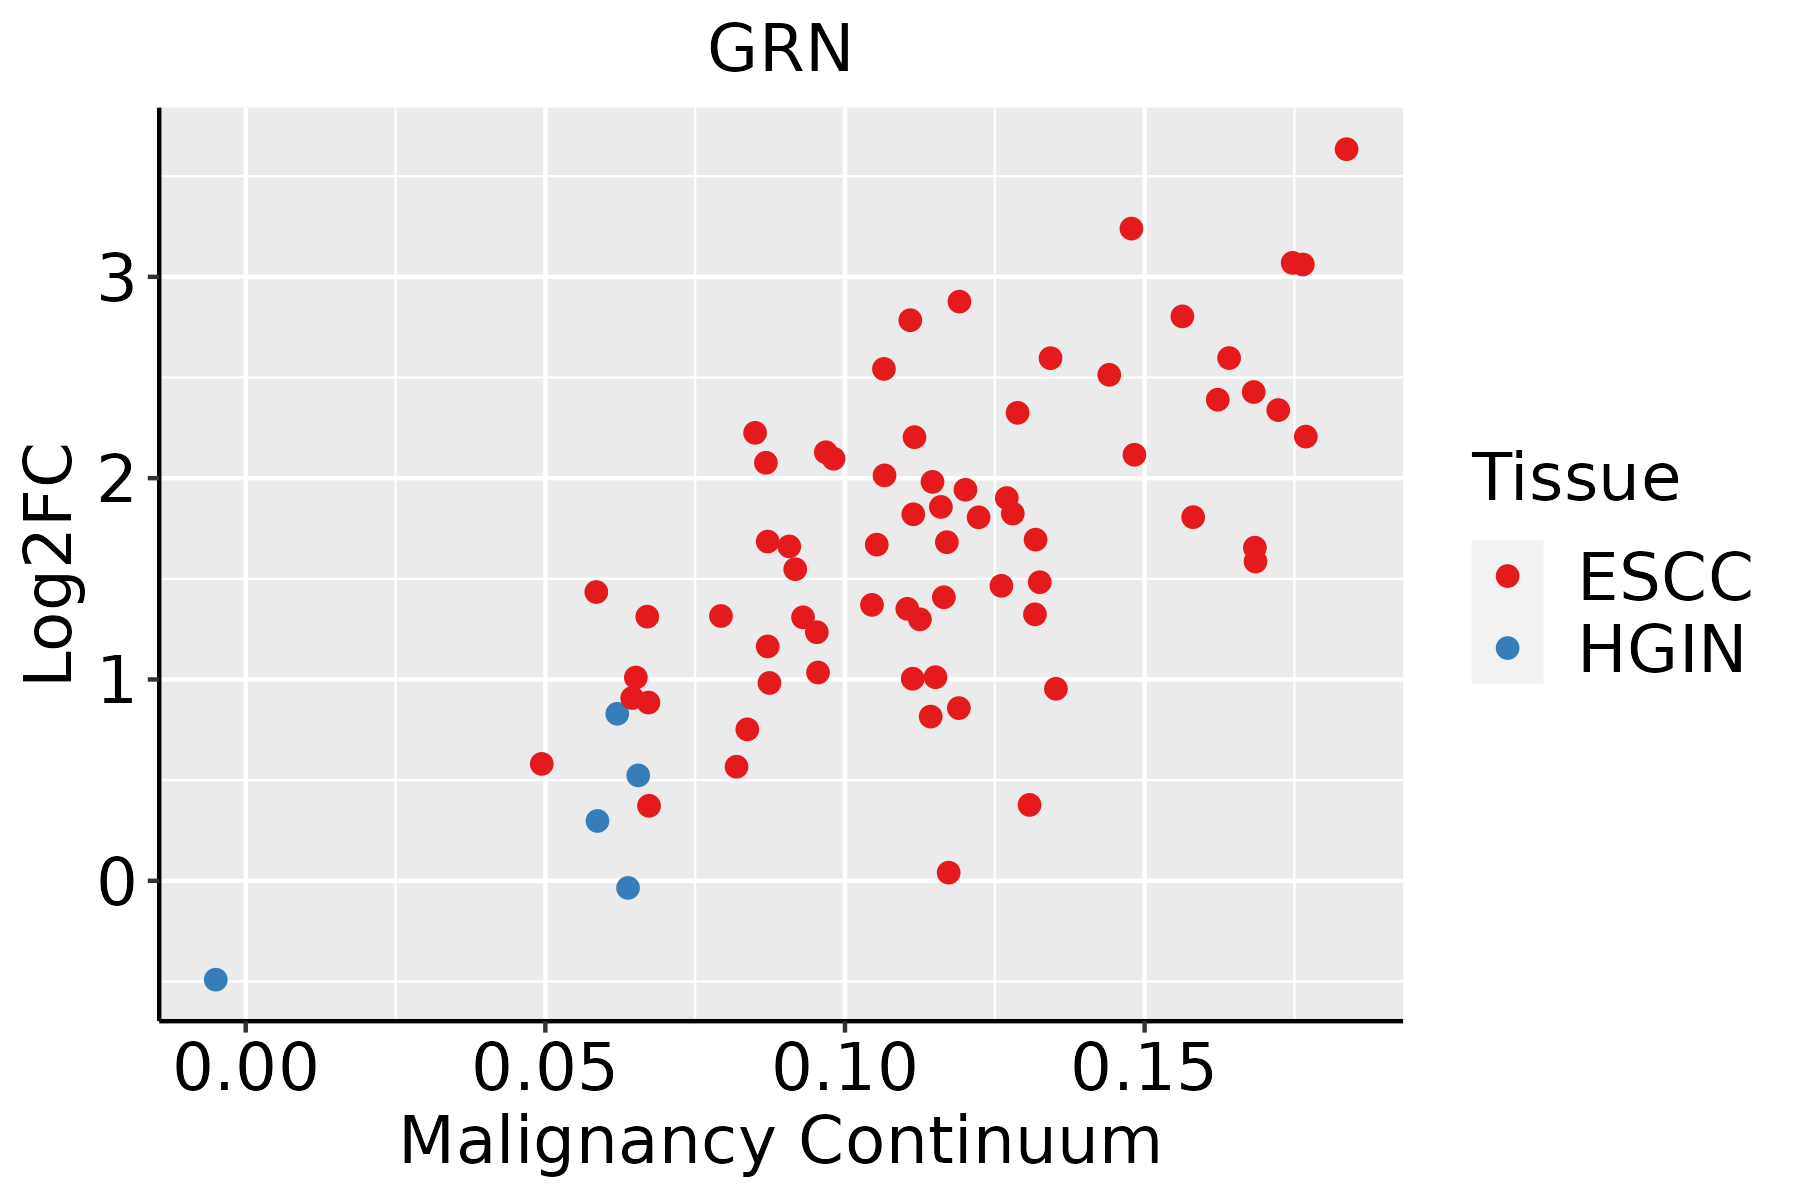 | ESCC: Esophageal squamous cell carcinoma |
| HGIN: High-grade intraepithelial neoplasias |
| LGIN: Low-grade intraepithelial neoplasias |
| GC | 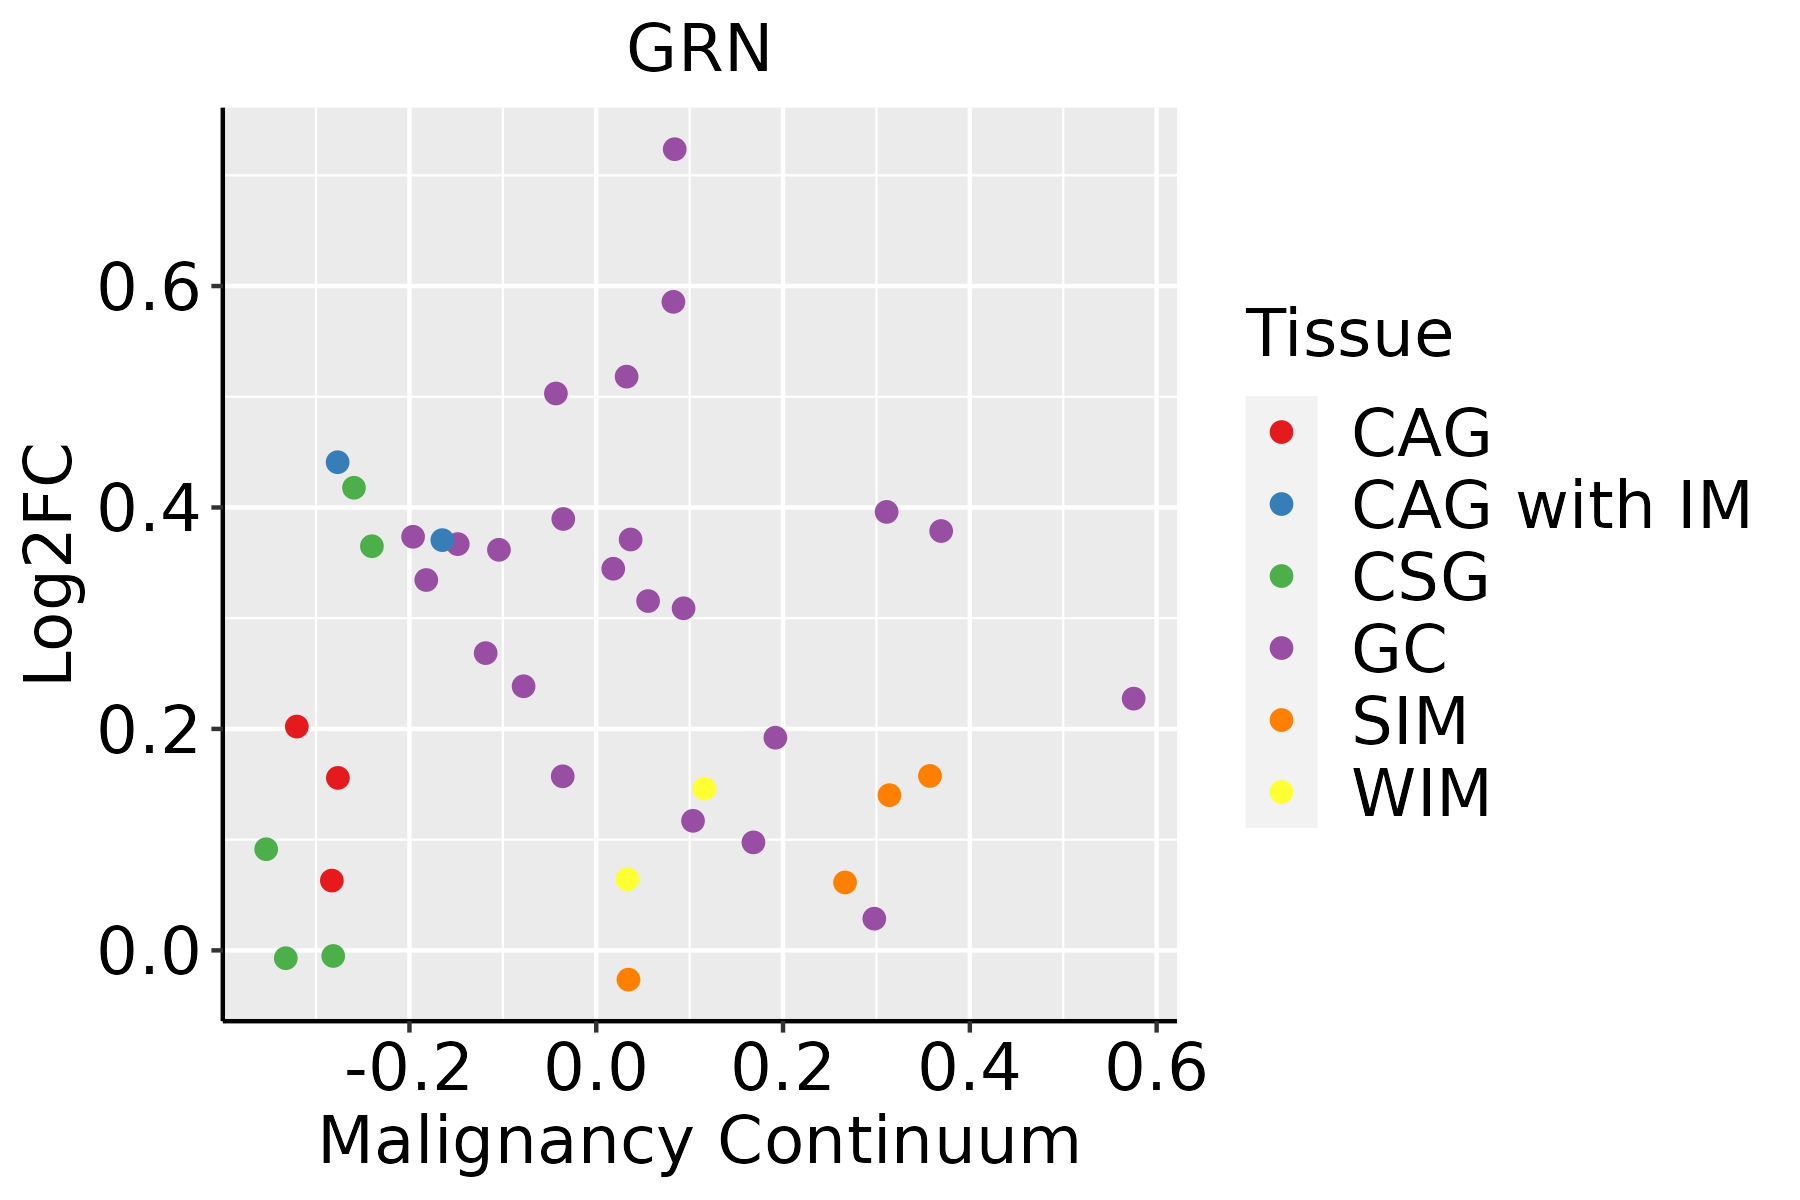 | CAG: Chronic atrophic gastritis |
| CAG with IM: Chronic atrophic gastritis with intestinal metaplasia |
| CSG: Chronic superficial gastritis |
| GC: Gastric cancer |
| SIM: Severe intestinal metaplasia |
| WIM: Wild intestinal metaplasia |
| Liver | 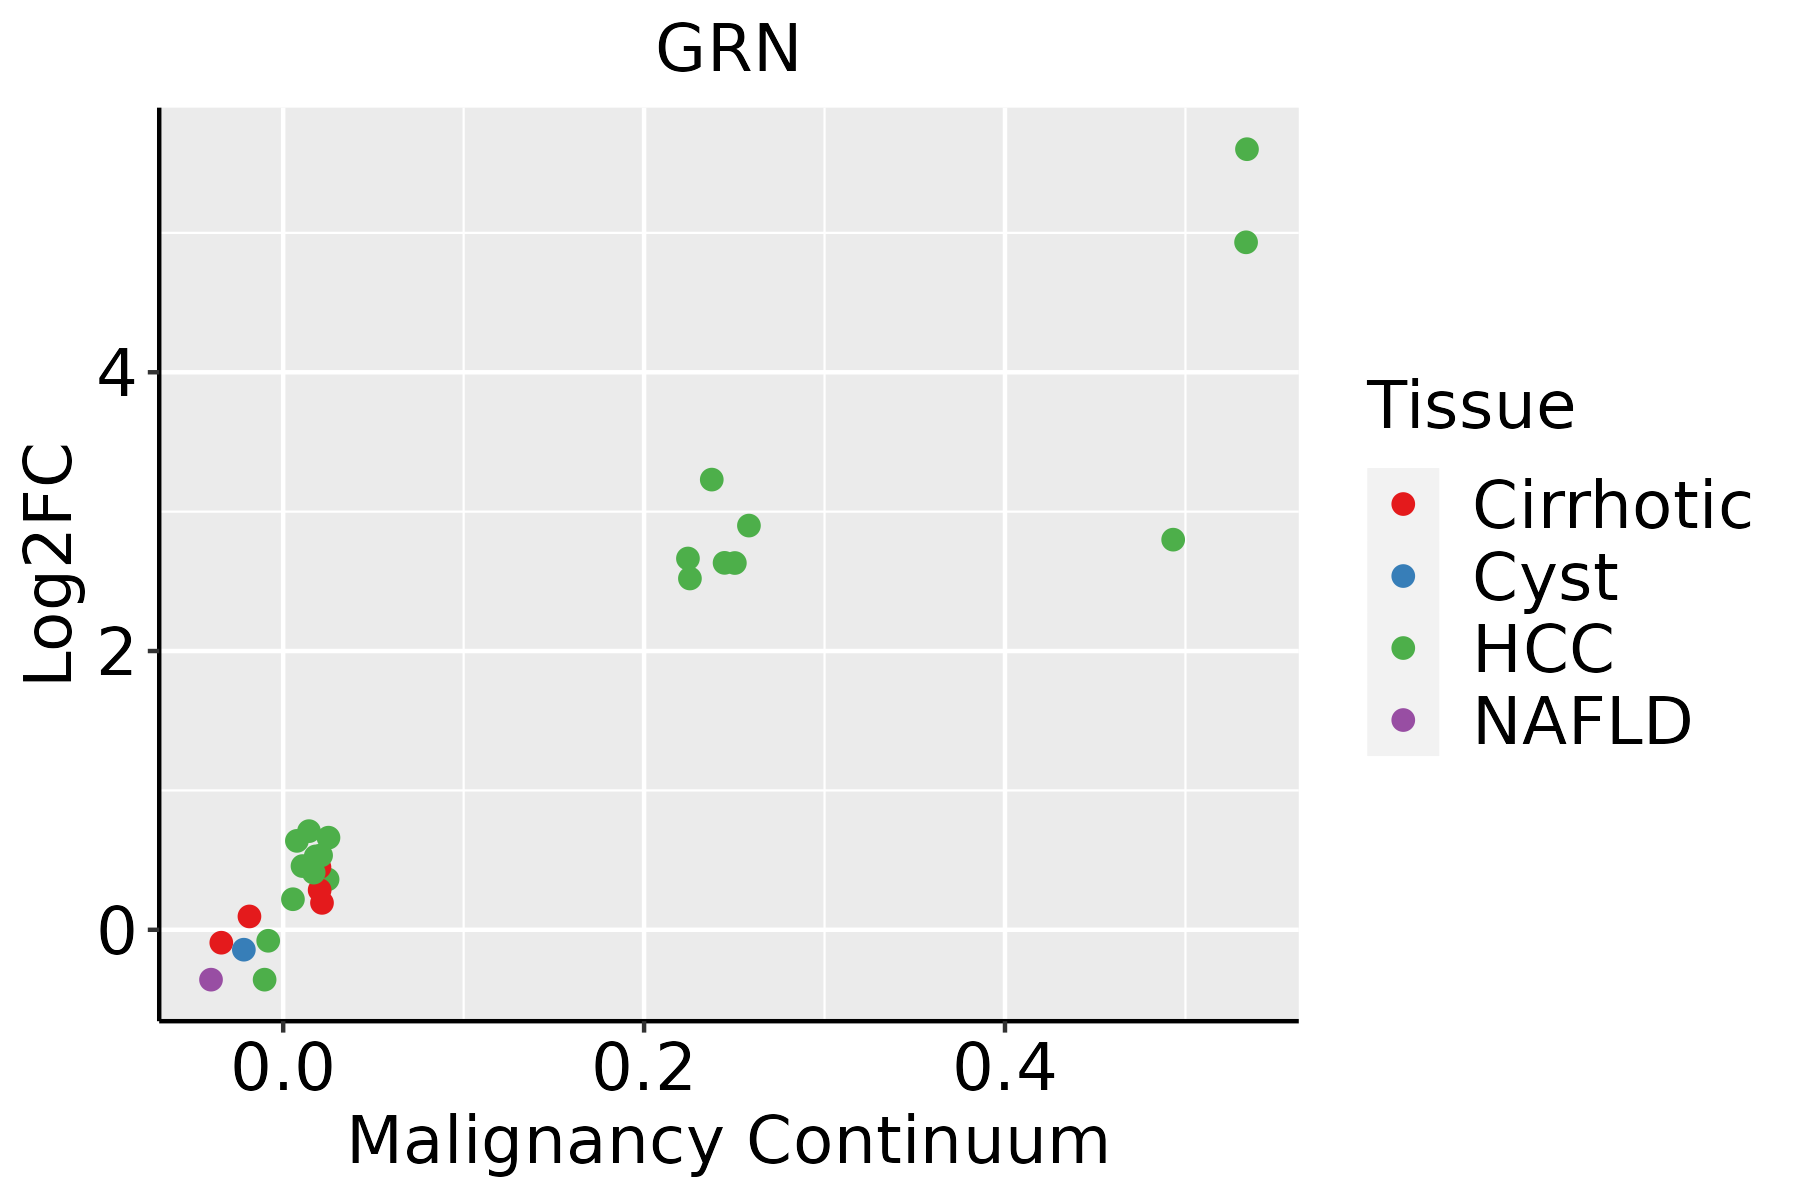 | HCC: Hepatocellular carcinoma |
| NAFLD: Non-alcoholic fatty liver disease |
| Oral Cavity |  | EOLP: Erosive Oral lichen planus |
| LP: leukoplakia |
| NEOLP: Non-erosive oral lichen planus |
| OSCC: Oral squamous cell carcinoma |
| Prostate |  | BPH: Benign Prostatic Hyperplasia |
| Skin | 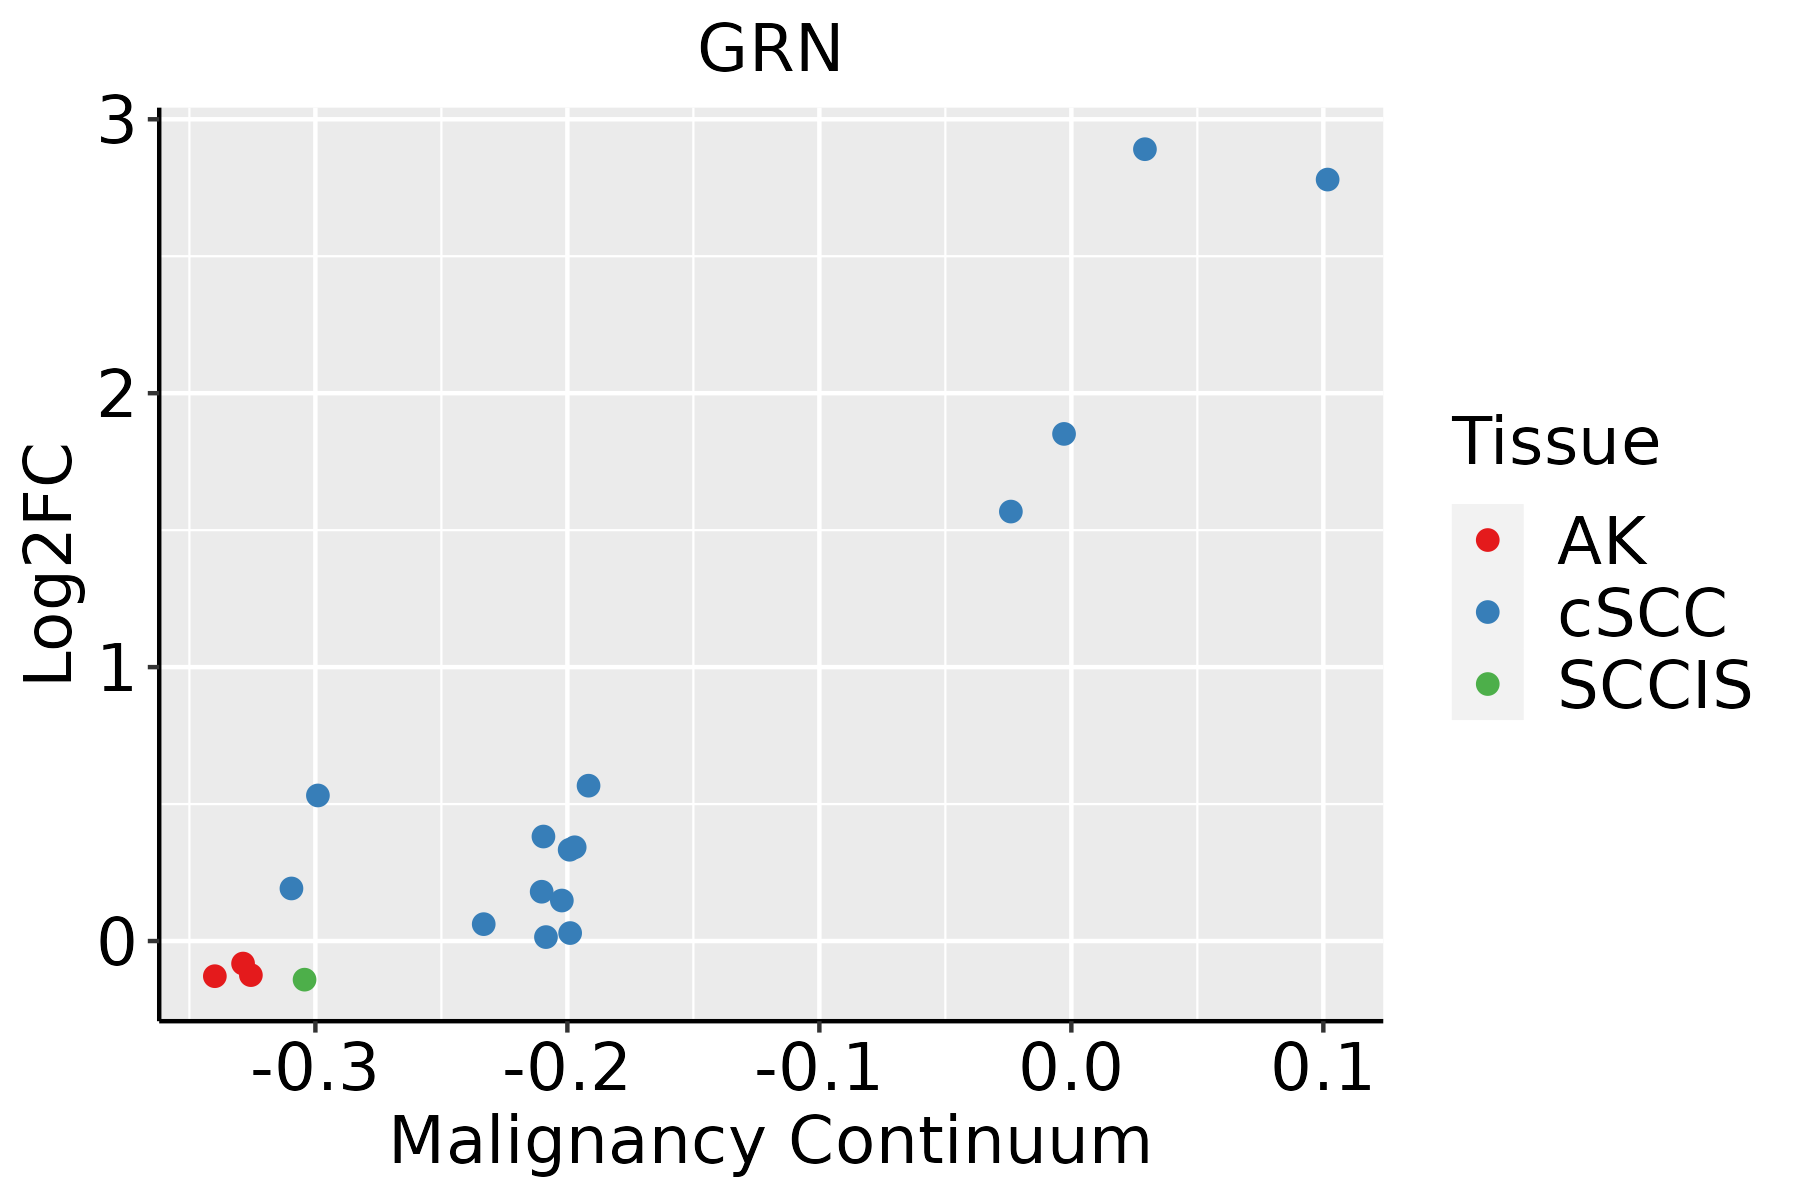 | AK: Actinic keratosis |
| cSCC: Cutaneous squamous cell carcinoma |
| SCCIS:squamous cell carcinoma in situ |
| Thyroid |  | ATC: Anaplastic thyroid cancer |
| HT: Hashimoto's thyroiditis |
| PTC: Papillary thyroid cancer |
| GO ID | Tissue | Disease Stage | Description | Gene Ratio | Bg Ratio | pvalue | p.adjust | Count |
| GO:000651321 | Oral cavity | EOLP | protein monoubiquitination | 17/2218 | 67/18723 | 1.68e-03 | 1.11e-02 | 17 |
| GO:190121624 | Oral cavity | EOLP | positive regulation of neuron death | 22/2218 | 97/18723 | 1.89e-03 | 1.21e-02 | 22 |
| GO:005140224 | Oral cavity | EOLP | neuron apoptotic process | 45/2218 | 246/18723 | 1.96e-03 | 1.25e-02 | 45 |
| GO:00602635 | Oral cavity | EOLP | regulation of respiratory burst | 7/2218 | 17/18723 | 2.14e-03 | 1.34e-02 | 7 |
| GO:00311021 | Oral cavity | EOLP | neuron projection regeneration | 15/2218 | 60/18723 | 3.58e-03 | 2.03e-02 | 15 |
| GO:00705701 | Oral cavity | EOLP | regulation of neuron projection regeneration | 10/2218 | 33/18723 | 3.76e-03 | 2.10e-02 | 10 |
| GO:190121522 | Oral cavity | EOLP | negative regulation of neuron death | 38/2218 | 208/18723 | 4.28e-03 | 2.34e-02 | 38 |
| GO:0050728 | Oral cavity | EOLP | negative regulation of inflammatory response | 33/2218 | 176/18723 | 4.94e-03 | 2.62e-02 | 33 |
| GO:00440882 | Oral cavity | EOLP | regulation of vacuole organization | 12/2218 | 45/18723 | 5.03e-03 | 2.65e-02 | 12 |
| GO:0002679 | Oral cavity | EOLP | respiratory burst involved in defense response | 6/2218 | 15/18723 | 5.31e-03 | 2.76e-02 | 6 |
| GO:00022744 | Oral cavity | EOLP | myeloid leukocyte activation | 39/2218 | 223/18723 | 8.09e-03 | 3.82e-02 | 39 |
| GO:005067816 | Oral cavity | EOLP | regulation of epithelial cell proliferation | 61/2218 | 381/18723 | 8.75e-03 | 4.06e-02 | 61 |
| GO:004352322 | Oral cavity | EOLP | regulation of neuron apoptotic process | 37/2218 | 212/18723 | 1.00e-02 | 4.52e-02 | 37 |
| GO:19013425 | Oral cavity | EOLP | regulation of vasculature development | 56/2218 | 348/18723 | 1.05e-02 | 4.71e-02 | 56 |
| GO:006156414 | Oral cavity | EOLP | axon development | 72/2218 | 467/18723 | 1.14e-02 | 5.00e-02 | 72 |
| GO:000020931 | Oral cavity | NEOLP | protein polyubiquitination | 53/2005 | 236/18723 | 1.22e-07 | 4.38e-06 | 53 |
| GO:000651331 | Oral cavity | NEOLP | protein monoubiquitination | 18/2005 | 67/18723 | 1.73e-04 | 1.91e-03 | 18 |
| GO:000703431 | Oral cavity | NEOLP | vacuolar transport | 30/2005 | 157/18723 | 1.18e-03 | 8.72e-03 | 30 |
| GO:000704131 | Oral cavity | NEOLP | lysosomal transport | 22/2005 | 114/18723 | 4.42e-03 | 2.49e-02 | 22 |
| GO:000641718 | Prostate | BPH | regulation of translation | 157/3107 | 468/18723 | 9.09e-20 | 5.63e-17 | 157 |
| Hugo Symbol | Variant Class | Variant Classification | dbSNP RS | HGVSc | HGVSp | HGVSp Short | SWISSPROT | BIOTYPE | SIFT | PolyPhen | Tumor Sample Barcode | Tissue | Histology | Sex | Age | Stage | Therapy Types | Drugs | Outcome |
| GRN | SNV | Missense_Mutation | novel | c.340N>G | p.Gln114Glu | p.Q114E | P28799 | protein_coding | tolerated(0.45) | benign(0.257) | TCGA-AC-A5XS-01 | Breast | breast invasive carcinoma | Female | >=65 | I/II | Hormone Therapy | femara | SD |
| GRN | SNV | Missense_Mutation | novel | c.1623G>T | p.Trp541Cys | p.W541C | P28799 | protein_coding | deleterious(0) | probably_damaging(1) | TCGA-B6-A402-01 | Breast | breast invasive carcinoma | Female | <65 | I/II | Chemotherapy | cyclophosphamide | PD |
| GRN | SNV | Missense_Mutation | | c.1292N>T | p.Ala431Val | p.A431V | P28799 | protein_coding | deleterious(0.04) | benign(0.037) | TCGA-D8-A1XQ-01 | Breast | breast invasive carcinoma | Female | >=65 | I/II | Unknown | Unknown | SD |
| GRN | insertion | Frame_Shift_Ins | novel | c.159_160insGCTA | p.Ser54AlafsTer12 | p.S54Afs*12 | P28799 | protein_coding | | | TCGA-BH-A0AY-01 | Breast | breast invasive carcinoma | Female | <65 | I/II | Chemotherapy | | SD |
| GRN | insertion | In_Frame_Ins | novel | c.161_162insTGAAAGAAGCCAGTTGCAGAT | p.Ser54_Arg55insGluArgSerGlnLeuGlnIle | p.S54_R55insERSQLQI | P28799 | protein_coding | | | TCGA-BH-A0AY-01 | Breast | breast invasive carcinoma | Female | <65 | I/II | Chemotherapy | | SD |
| GRN | deletion | Frame_Shift_Del | novel | c.1015delN | p.His340ThrfsTer21 | p.H340Tfs*21 | P28799 | protein_coding | | | TCGA-D8-A27V-01 | Breast | breast invasive carcinoma | Female | <65 | I/II | Hormone Therapy | tamoxiphen | SD |
| GRN | deletion | Frame_Shift_Del | novel | c.1331delG | p.Cys444LeufsTer47 | p.C444Lfs*47 | P28799 | protein_coding | | | TCGA-EW-A2FV-01 | Breast | breast invasive carcinoma | Female | <65 | III/IV | Chemotherapy | docetaxel | SD |
| GRN | SNV | Missense_Mutation | | c.1404N>C | p.Gln468His | p.Q468H | P28799 | protein_coding | tolerated(0.08) | probably_damaging(0.909) | TCGA-BI-A0VS-01 | Cervix | cervical & endocervical cancer | Female | <65 | I/II | Unknown | Unknown | SD |
| GRN | SNV | Missense_Mutation | rs751651838 | c.529N>T | p.Arg177Cys | p.R177C | P28799 | protein_coding | deleterious(0) | probably_damaging(0.984) | TCGA-C5-A1M6-01 | Cervix | cervical & endocervical cancer | Female | <65 | I/II | Chemotherapy | cisplatin | PD |
| GRN | SNV | Missense_Mutation | | c.104G>A | p.Gly35Glu | p.G35E | P28799 | protein_coding | tolerated(0.09) | benign(0.129) | TCGA-EK-A3GK-01 | Cervix | cervical & endocervical cancer | Female | <65 | I/II | Unknown | Unknown | SD |


