
|
|||||
|
 | |
| |
| |
| |
| |
| |
|
Gene: EFNA5 |
Gene summary for EFNA5 |
| Gene information | Species | Human | Gene symbol | EFNA5 | Gene ID | 1946 |
| Gene name | ephrin A5 | |
| Gene Alias | AF1 | |
| Cytomap | 5q21.3 | |
| Gene Type | protein-coding | GO ID | GO:0000226 | UniProtAcc | P52803 |
Top |
Malignant transformation analysis |
| Identification of the aberrant gene expression in precancerous and cancerous lesions by comparing the gene expression of stem-like cells in diseased tissues with normal stem cells |
| Entrez ID | Symbol | Replicates | Species | Organ | Tissue | Adj P-value | Log2FC | Malignancy |
| 1946 | EFNA5 | CA_HPV_1 | Human | Cervix | CC | 1.72e-03 | -1.51e-01 | 0.0264 |
| 1946 | EFNA5 | CCI_2 | Human | Cervix | CC | 1.58e-03 | 7.92e-01 | 0.5249 |
| 1946 | EFNA5 | CCI_3 | Human | Cervix | CC | 4.11e-15 | 1.09e+00 | 0.516 |
| 1946 | EFNA5 | HTA11_3410_2000001011 | Human | Colorectum | AD | 3.10e-50 | -1.22e+00 | 0.0155 |
| 1946 | EFNA5 | HTA11_2487_2000001011 | Human | Colorectum | SER | 5.75e-08 | -7.54e-01 | -0.1808 |
| 1946 | EFNA5 | HTA11_2951_2000001011 | Human | Colorectum | AD | 3.21e-09 | -1.18e+00 | 0.0216 |
| 1946 | EFNA5 | HTA11_1938_2000001011 | Human | Colorectum | AD | 1.13e-04 | -6.94e-01 | -0.0811 |
| 1946 | EFNA5 | HTA11_3361_2000001011 | Human | Colorectum | AD | 2.99e-21 | -9.79e-01 | -0.1207 |
| 1946 | EFNA5 | HTA11_696_2000001011 | Human | Colorectum | AD | 1.26e-31 | -7.70e-01 | -0.1464 |
| 1946 | EFNA5 | HTA11_866_2000001011 | Human | Colorectum | AD | 1.47e-11 | -6.04e-01 | -0.1001 |
| 1946 | EFNA5 | HTA11_1391_2000001011 | Human | Colorectum | AD | 1.30e-15 | -8.20e-01 | -0.059 |
| 1946 | EFNA5 | HTA11_2992_2000001011 | Human | Colorectum | SER | 6.02e-03 | -6.91e-01 | -0.1706 |
| 1946 | EFNA5 | HTA11_5212_2000001011 | Human | Colorectum | AD | 1.53e-09 | -7.67e-01 | -0.2061 |
| 1946 | EFNA5 | HTA11_5216_2000001011 | Human | Colorectum | SER | 7.15e-04 | -6.95e-01 | -0.1462 |
| 1946 | EFNA5 | HTA11_7862_2000001011 | Human | Colorectum | AD | 3.18e-03 | -4.56e-01 | -0.0179 |
| 1946 | EFNA5 | HTA11_866_3004761011 | Human | Colorectum | AD | 2.15e-41 | -1.18e+00 | 0.096 |
| 1946 | EFNA5 | HTA11_9408_2000001011 | Human | Colorectum | AD | 9.12e-06 | -1.10e+00 | 0.0451 |
| 1946 | EFNA5 | HTA11_8622_2000001021 | Human | Colorectum | SER | 2.88e-13 | -1.27e+00 | 0.0528 |
| 1946 | EFNA5 | HTA11_6801_2000001011 | Human | Colorectum | SER | 1.21e-04 | -6.10e-01 | 0.0171 |
| 1946 | EFNA5 | HTA11_10711_2000001011 | Human | Colorectum | AD | 3.60e-19 | -9.00e-01 | 0.0338 |
| Page: 1 2 3 4 5 6 7 8 9 |
| Tissue | Expression Dynamics | Abbreviation |
| Cervix | 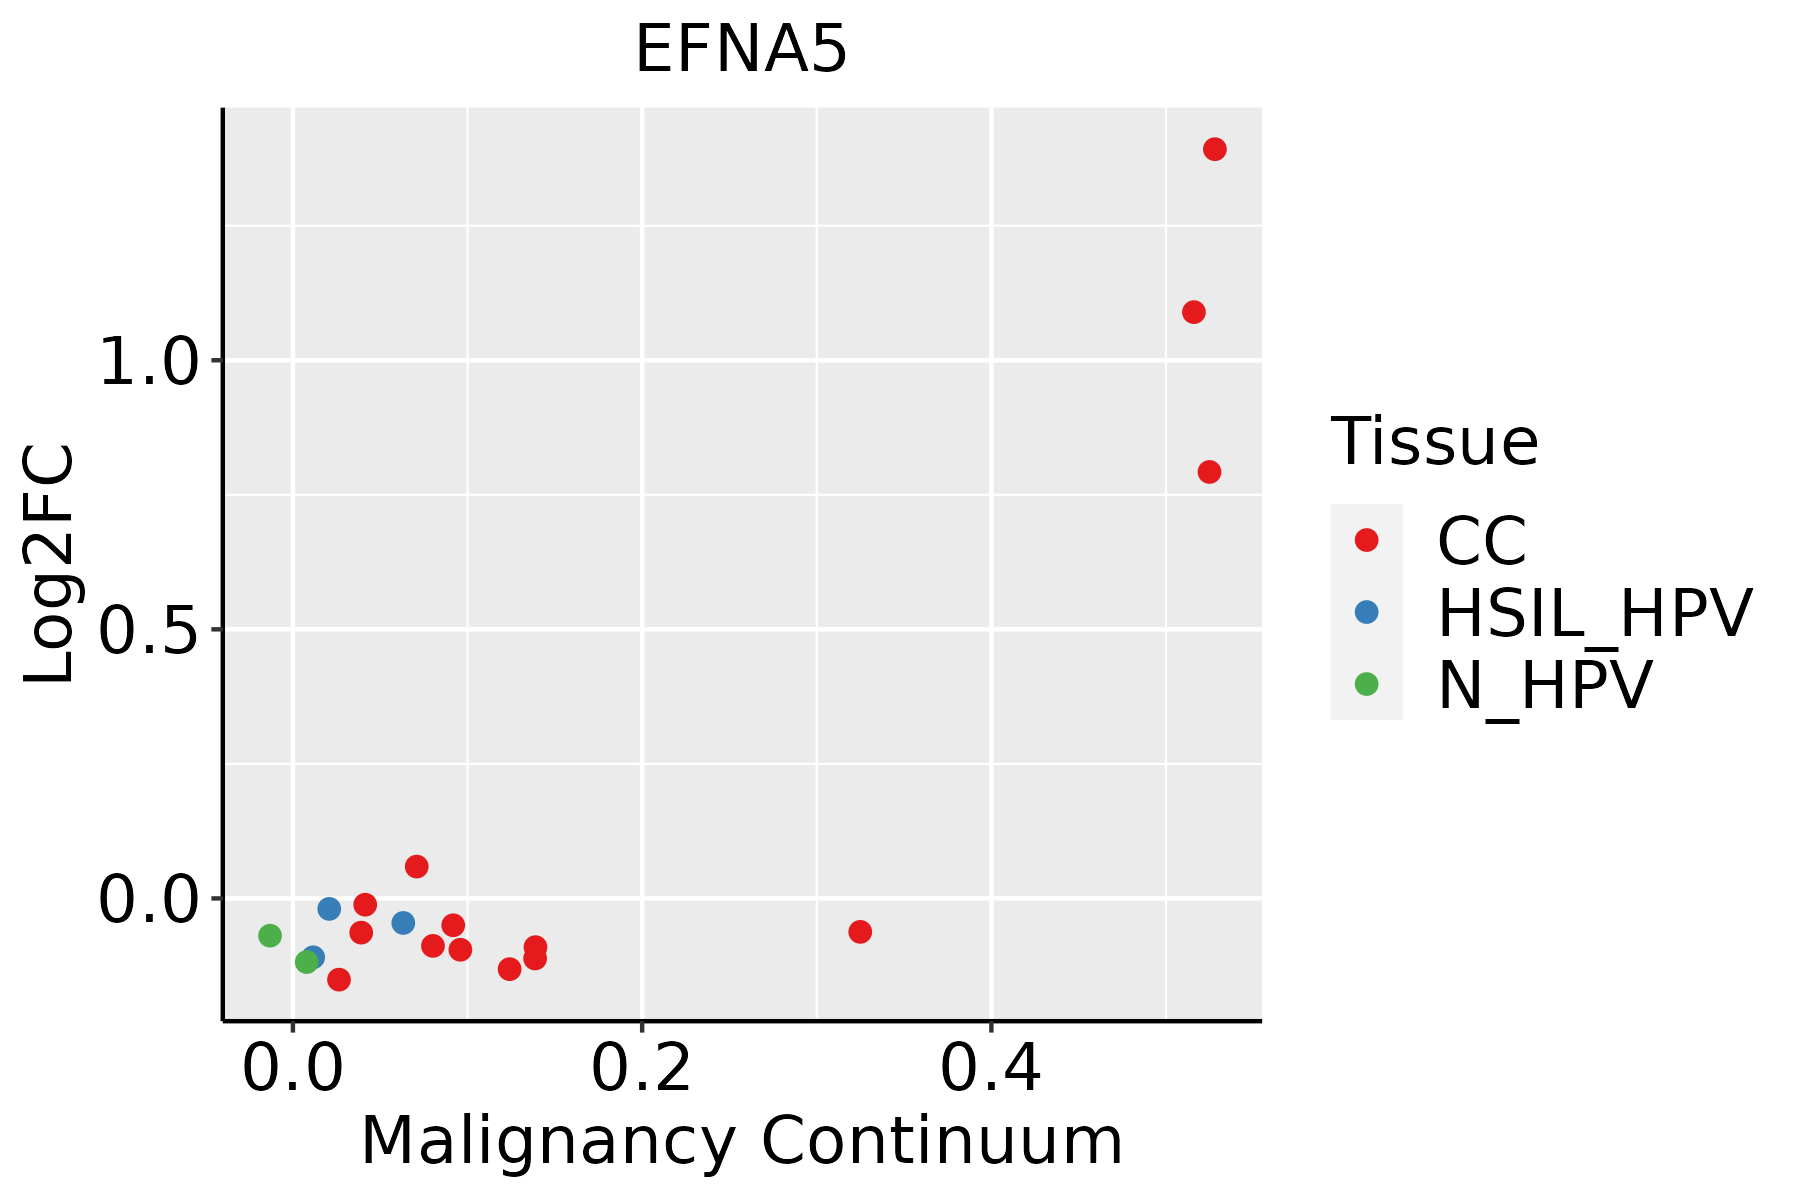 | CC: Cervix cancer |
| HSIL_HPV: HPV-infected high-grade squamous intraepithelial lesions | ||
| N_HPV: HPV-infected normal cervix | ||
| Colorectum (GSE201348) |  | FAP: Familial adenomatous polyposis |
| CRC: Colorectal cancer | ||
| Colorectum (HTA11) |  | AD: Adenomas |
| SER: Sessile serrated lesions | ||
| MSI-H: Microsatellite-high colorectal cancer | ||
| MSS: Microsatellite stable colorectal cancer | ||
| Endometrium | 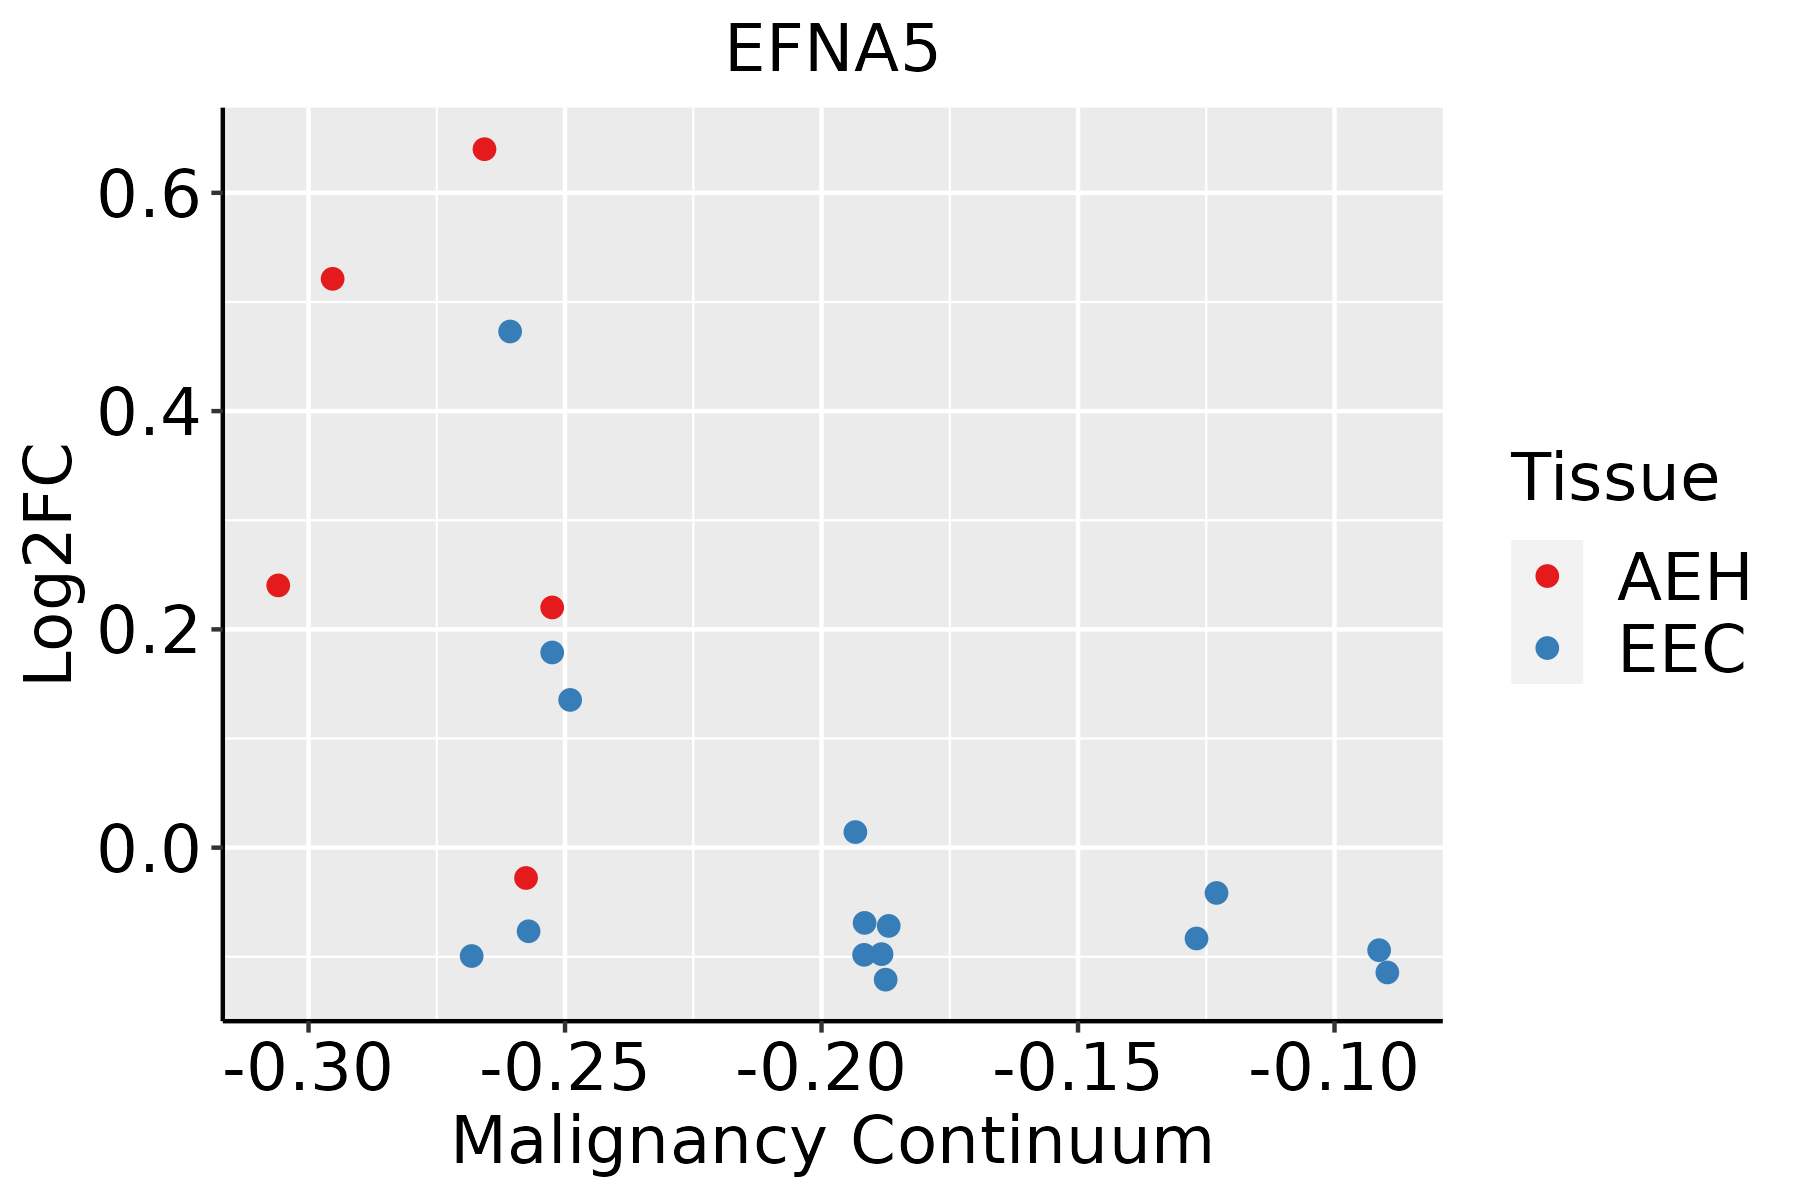 | AEH: Atypical endometrial hyperplasia |
| EEC: Endometrioid Cancer | ||
| GC |  | CAG: Chronic atrophic gastritis |
| CAG with IM: Chronic atrophic gastritis with intestinal metaplasia | ||
| CSG: Chronic superficial gastritis | ||
| GC: Gastric cancer | ||
| SIM: Severe intestinal metaplasia | ||
| WIM: Wild intestinal metaplasia | ||
| Liver | 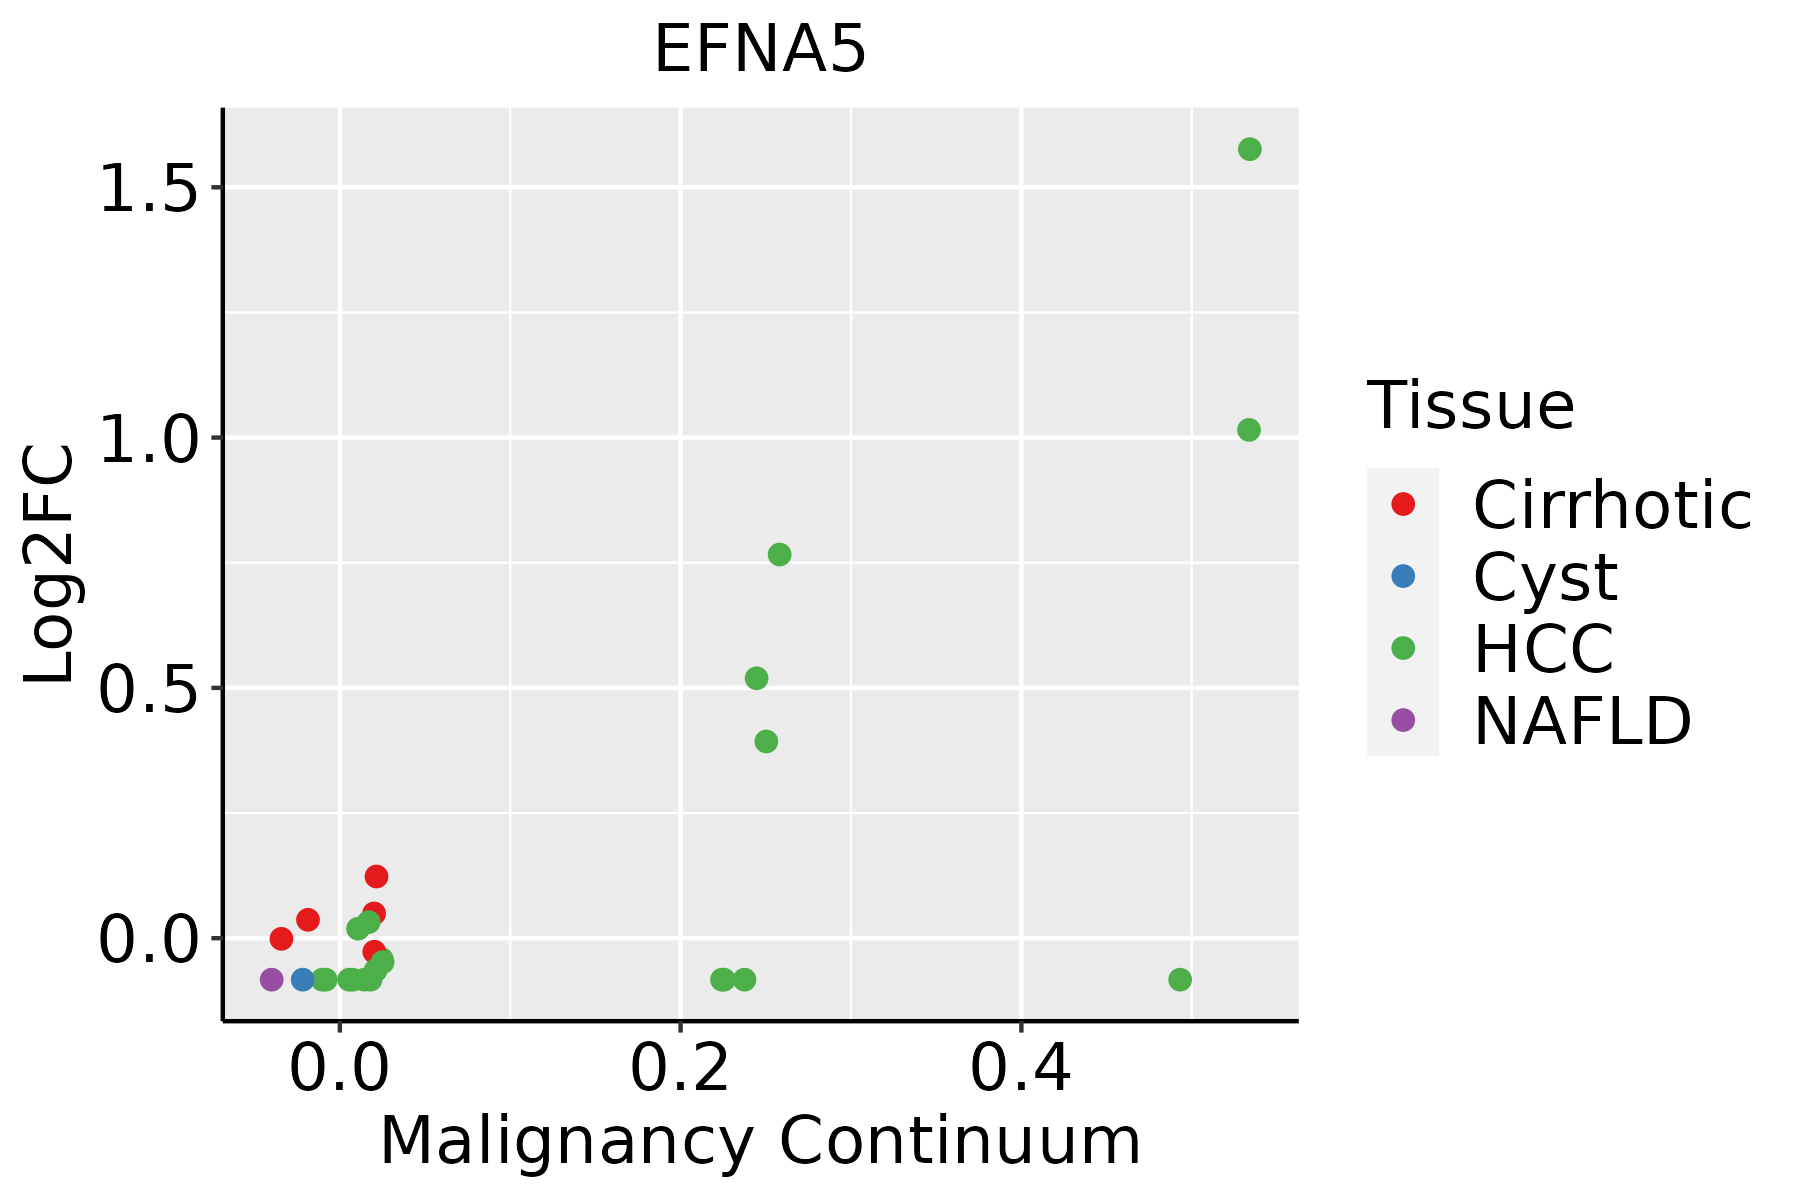 | HCC: Hepatocellular carcinoma |
| NAFLD: Non-alcoholic fatty liver disease | ||
| Lung | 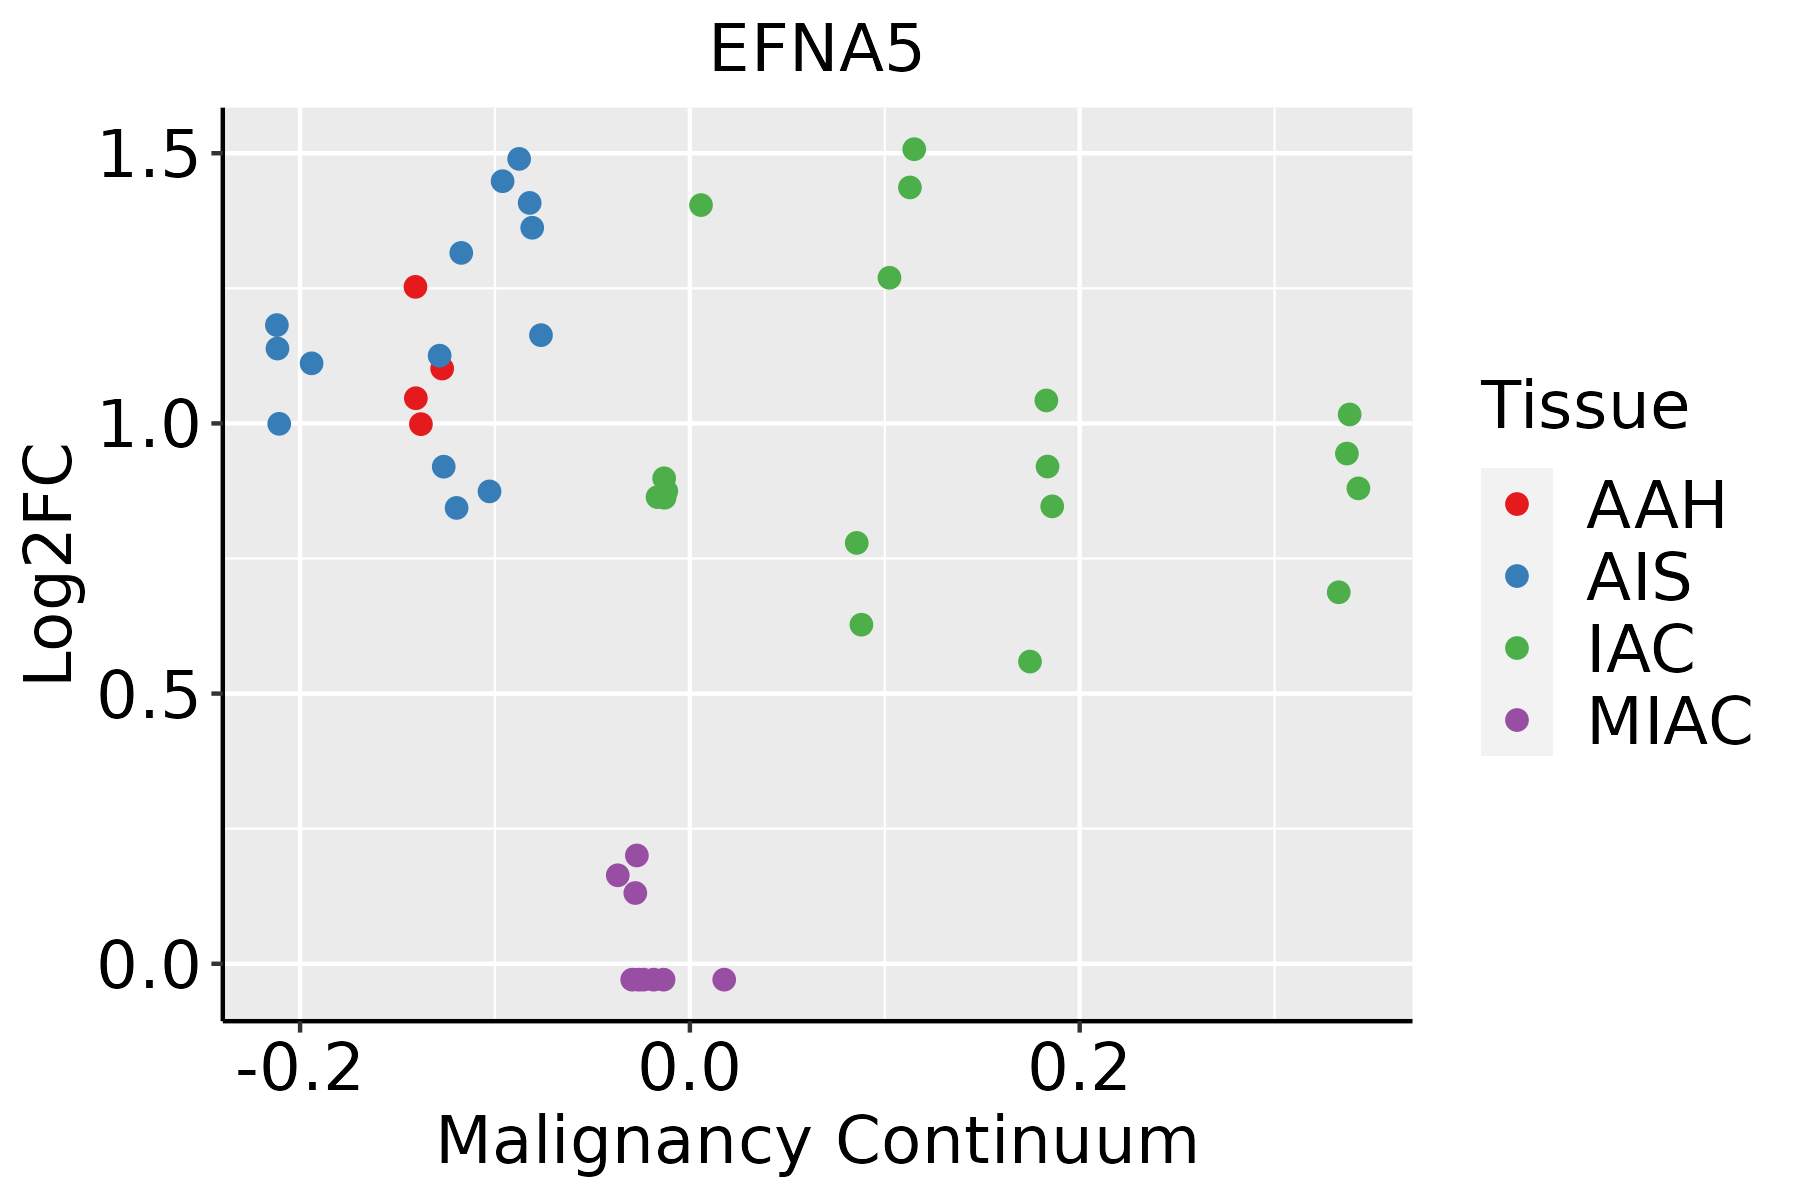 | AAH: Atypical adenomatous hyperplasia |
| AIS: Adenocarcinoma in situ | ||
| IAC: Invasive lung adenocarcinoma | ||
| MIA: Minimally invasive adenocarcinoma | ||
| Oral Cavity | 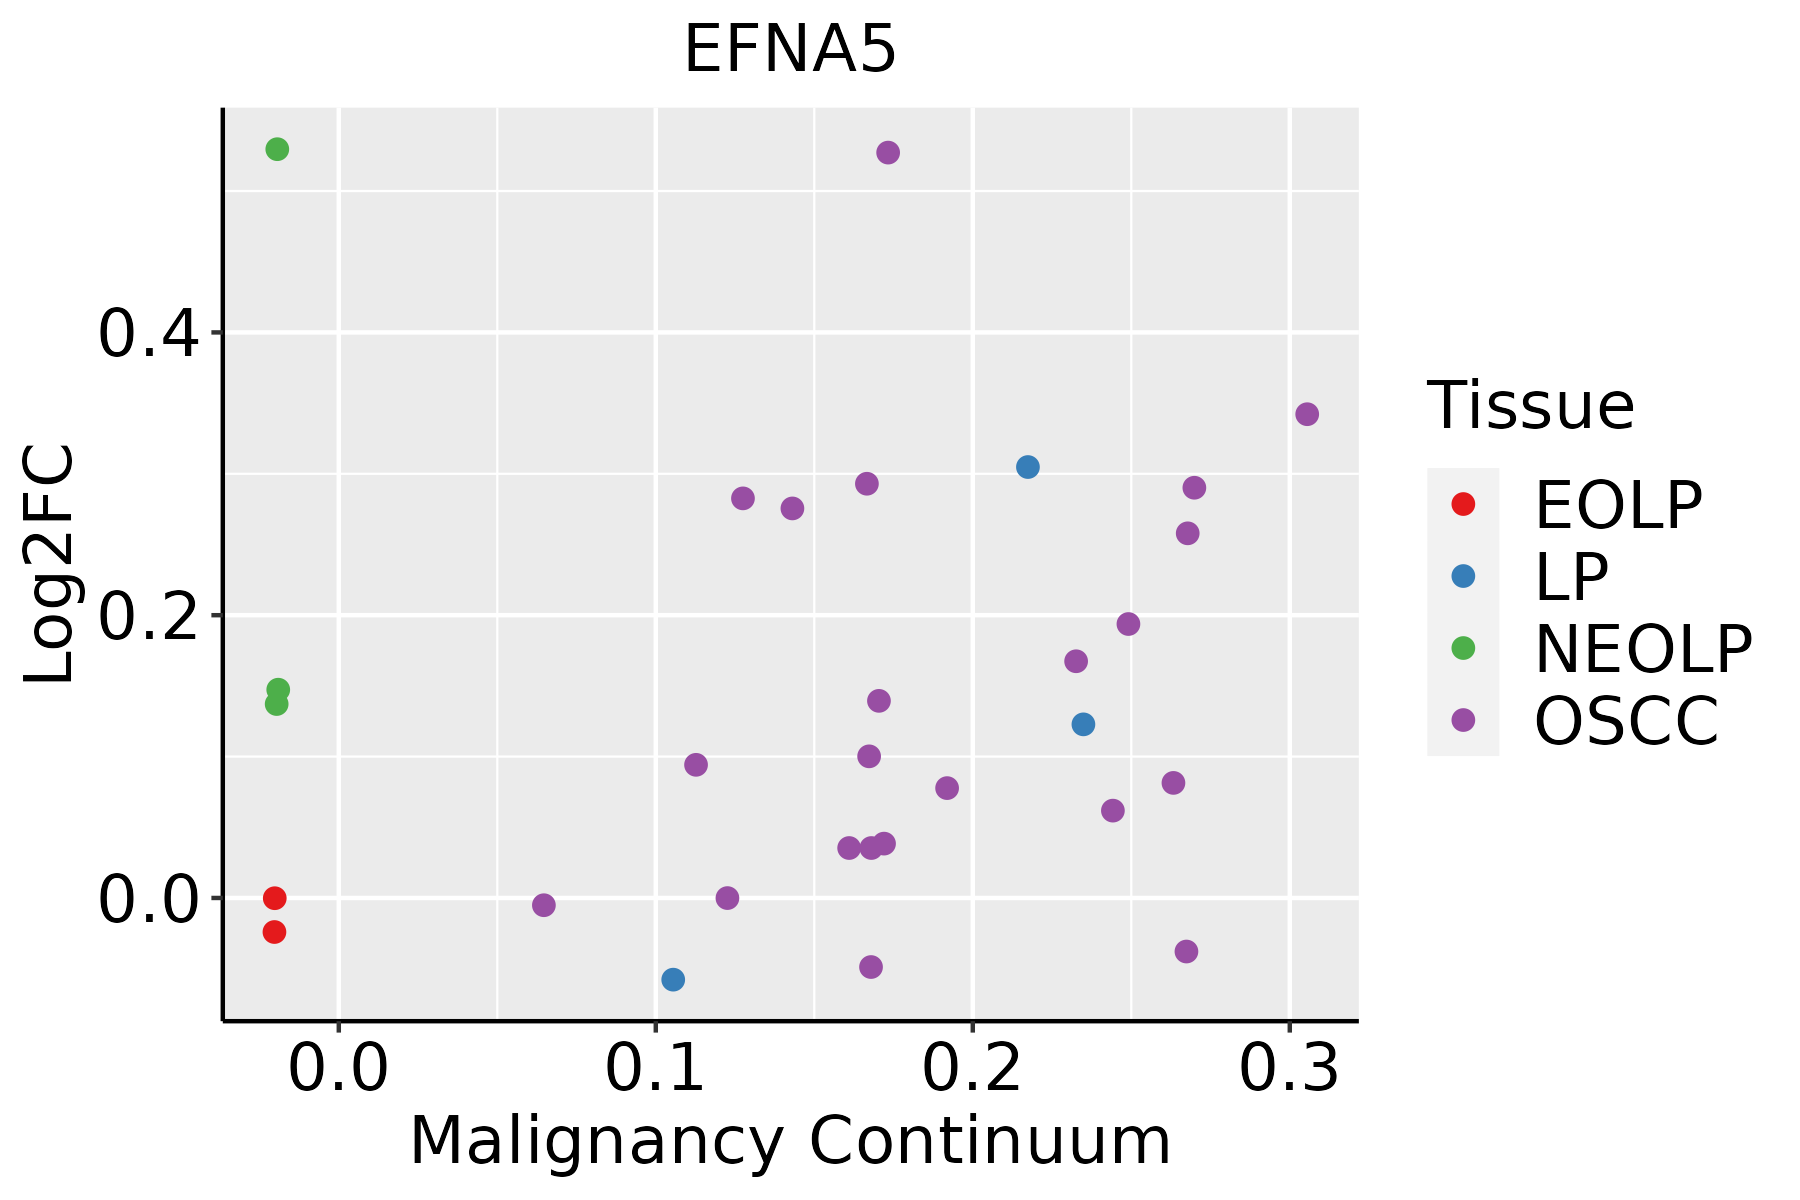 | EOLP: Erosive Oral lichen planus |
| LP: leukoplakia | ||
| NEOLP: Non-erosive oral lichen planus | ||
| OSCC: Oral squamous cell carcinoma | ||
| Prostate | 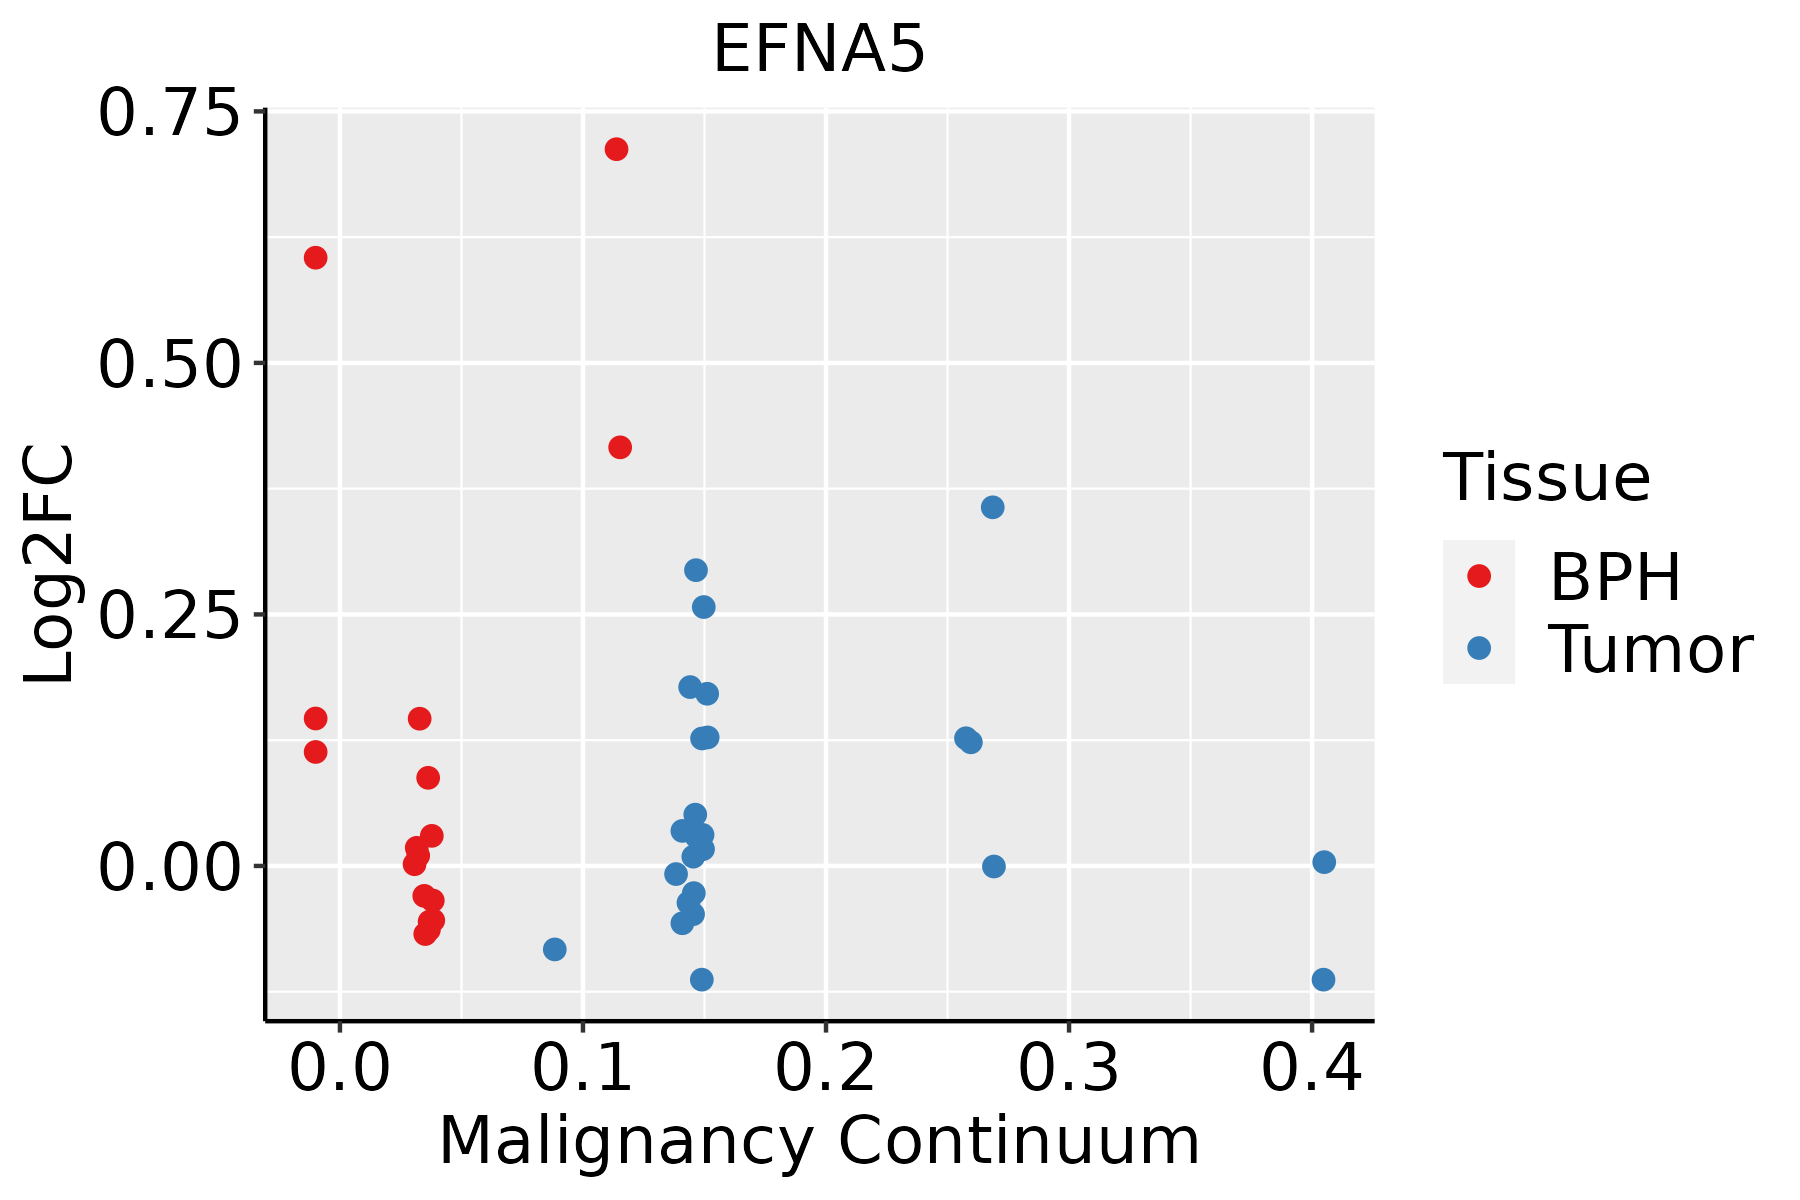 | BPH: Benign Prostatic Hyperplasia |
| Skin | 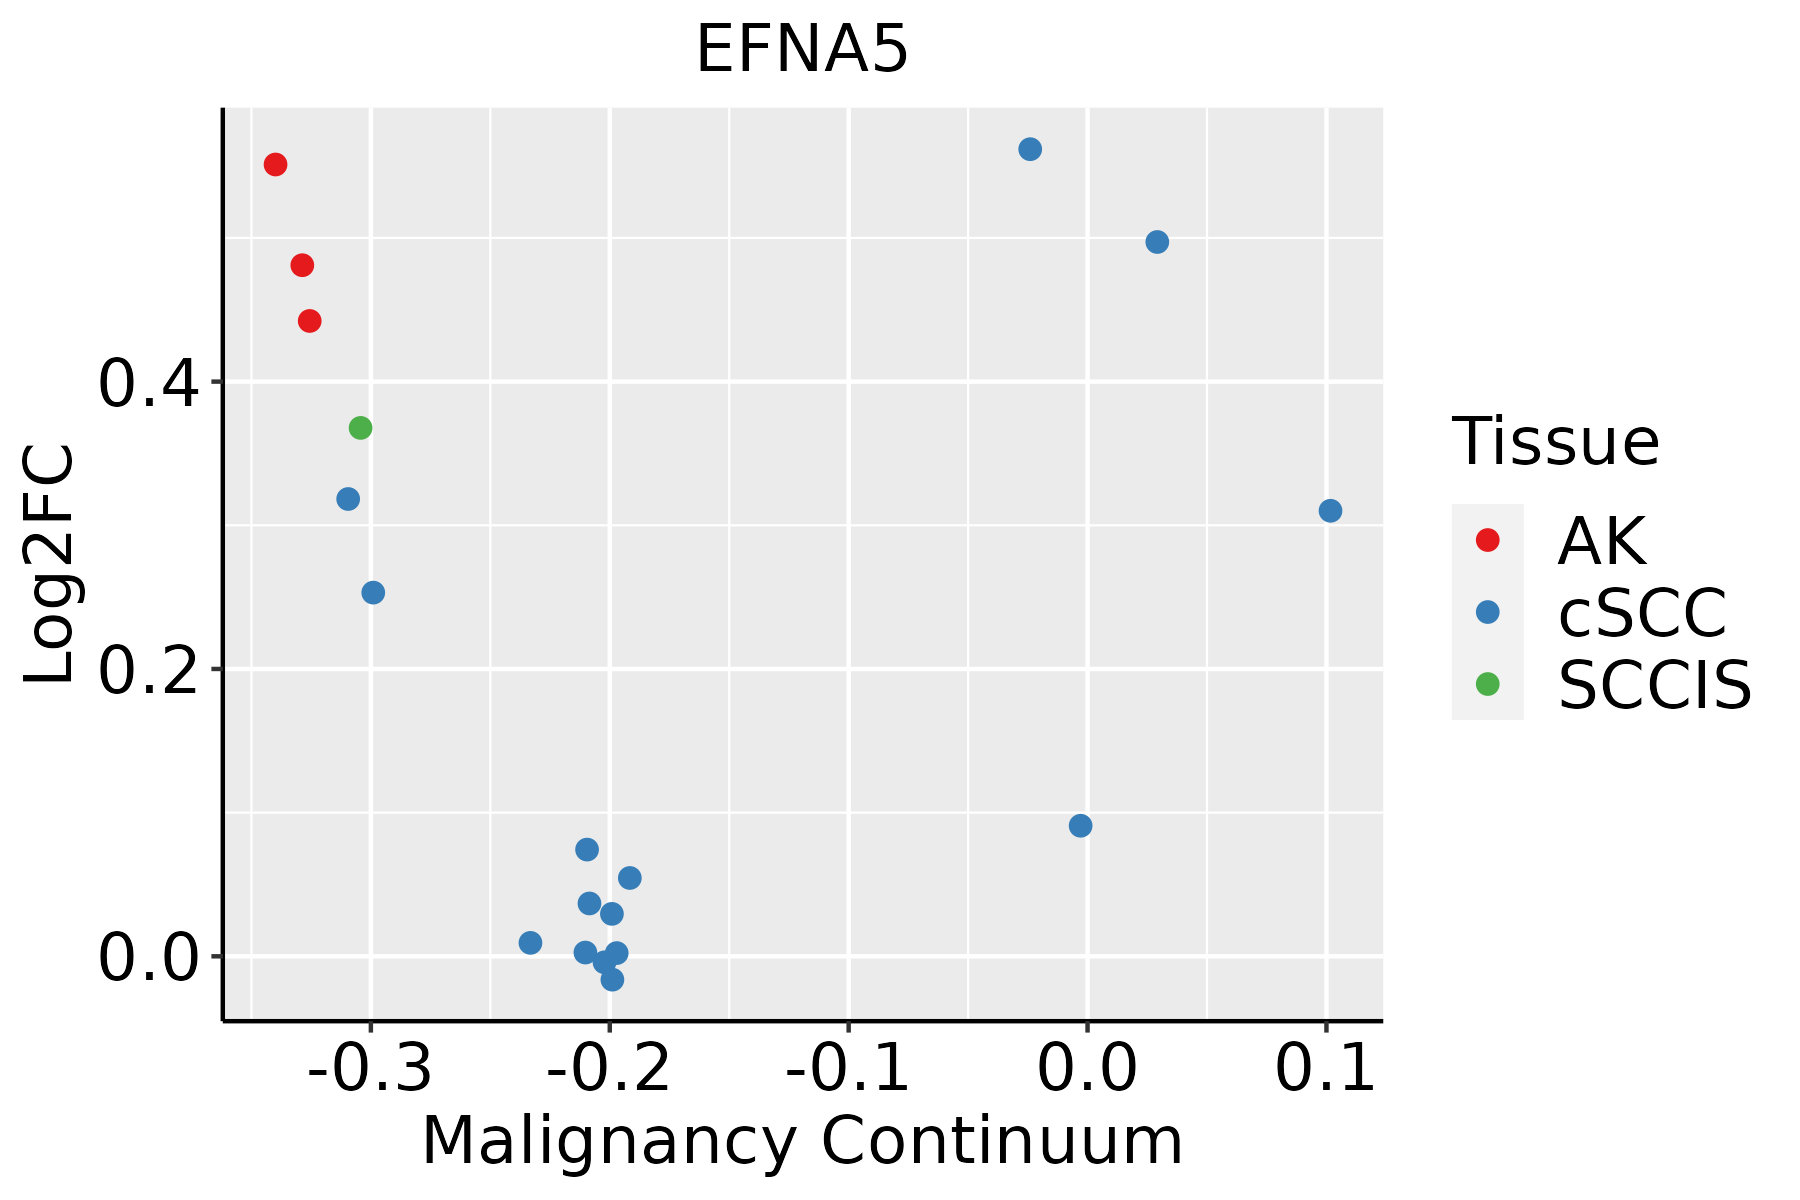 | AK: Actinic keratosis |
| cSCC: Cutaneous squamous cell carcinoma | ||
| SCCIS:squamous cell carcinoma in situ | ||
| Thyroid | 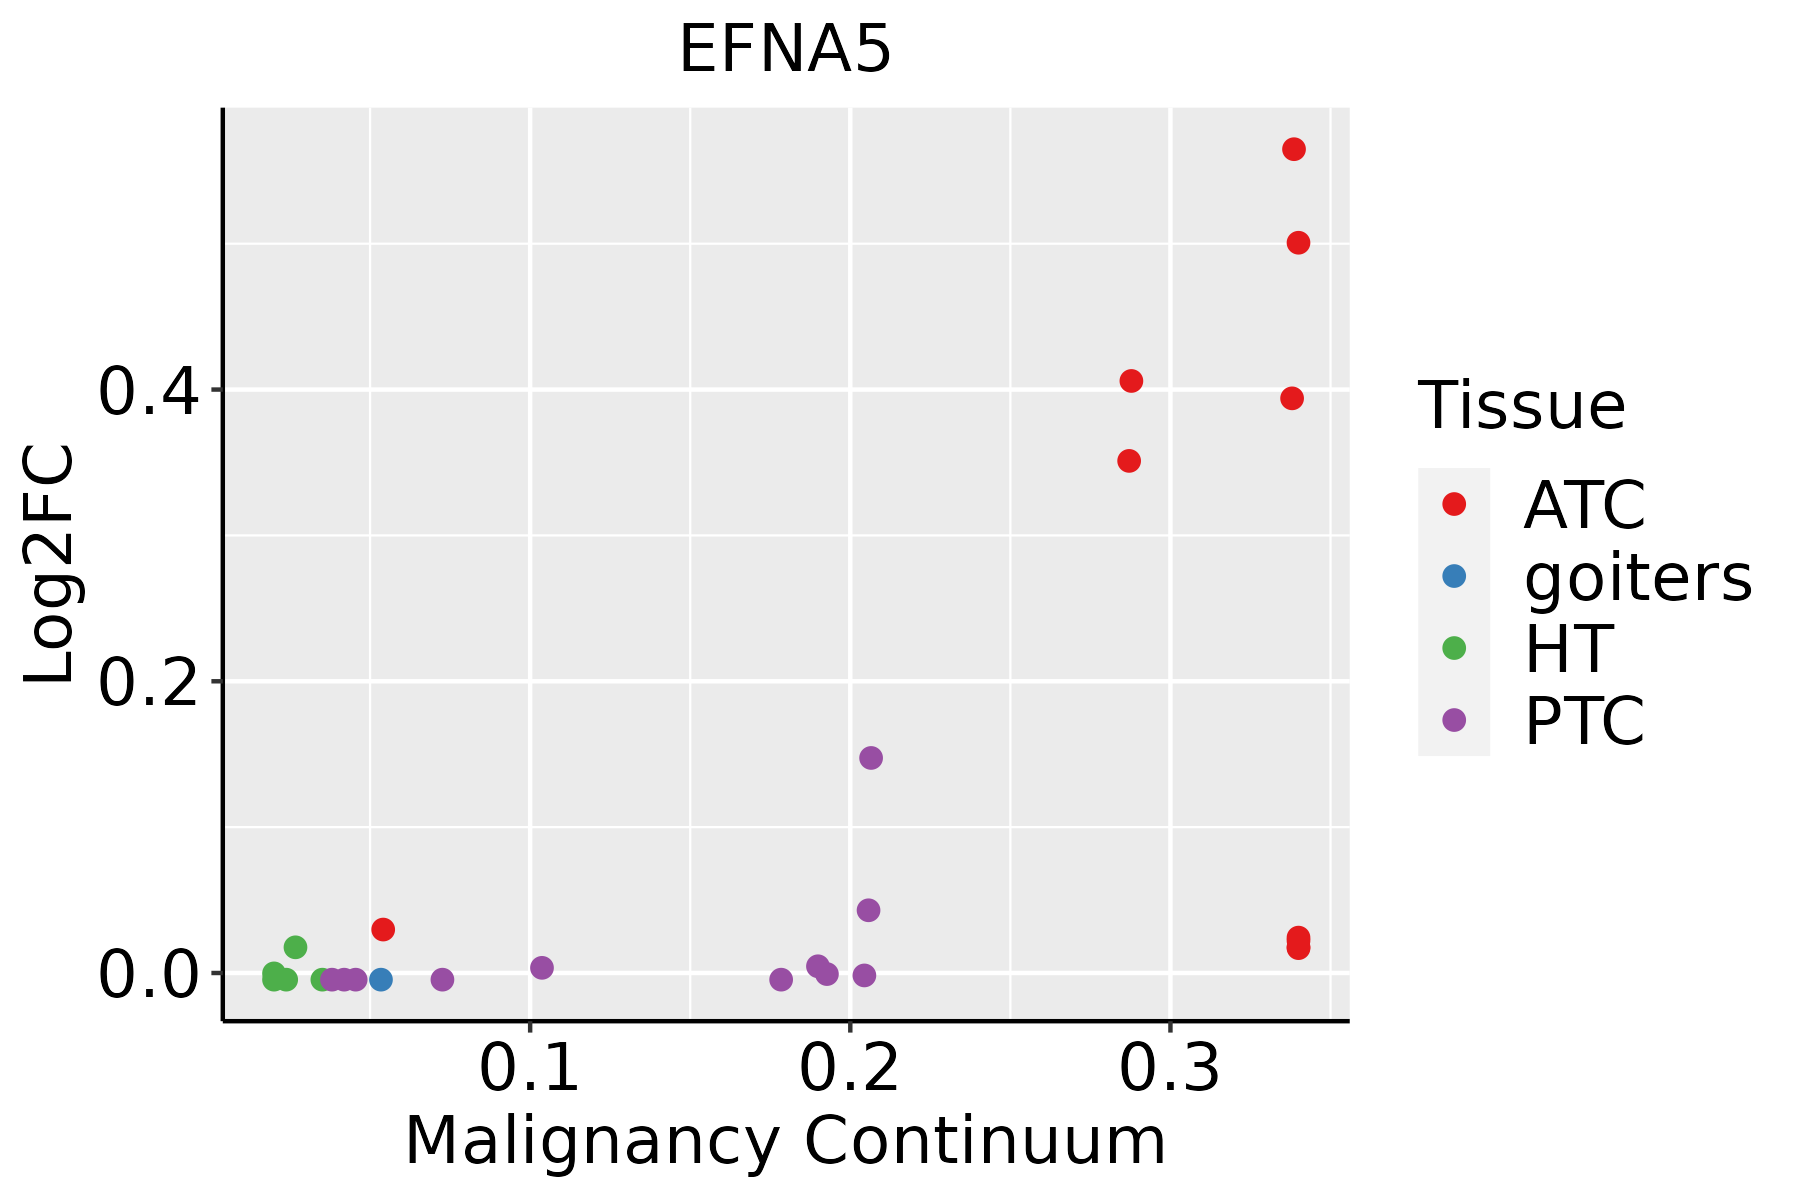 | ATC: Anaplastic thyroid cancer |
| HT: Hashimoto's thyroiditis | ||
| PTC: Papillary thyroid cancer |
| ∗log2FC in expression of this searched gene in stem-like cells from each diseased tissue sample relative to stem-like cells in normal samples in each tissue plotted against the malignancy continuum. Samples are colored based on if they are from different disease stage. |
Top |
Malignant transformation related pathway analysis |
| Find out the enriched GO biological processes and KEGG pathways involved in transition from healthy to precancer to cancer |
| Tissue | Disease Stage | Enriched GO biological Processes |
| Colorectum | AD |  |
| Colorectum | SER |  |
| Colorectum | MSS |  |
| Colorectum | MSI-H |  |
| Colorectum | FAP |  |
| ∗Top 15 enriched GO BP terms are showed in the bar plot of each disease state in each tissue. Each row represents a significant GO biological process which is colored according to the -log10(p.adjust). |
| Page: 1 2 3 4 5 6 7 8 9 |
| GO ID | Tissue | Disease Stage | Description | Gene Ratio | Bg Ratio | pvalue | p.adjust | Count |
| GO:190188816 | Skin | SCCIS | regulation of cell junction assembly | 22/919 | 204/18723 | 4.55e-04 | 7.28e-03 | 22 |
| GO:0032970112 | Skin | SCCIS | regulation of actin filament-based process | 35/919 | 397/18723 | 6.13e-04 | 9.08e-03 | 35 |
| GO:004801311 | Skin | SCCIS | ephrin receptor signaling pathway | 9/919 | 51/18723 | 7.53e-04 | 1.03e-02 | 9 |
| GO:0010769110 | Skin | SCCIS | regulation of cell morphogenesis involved in differentiation | 13/919 | 96/18723 | 8.15e-04 | 1.10e-02 | 13 |
| GO:0032956112 | Skin | SCCIS | regulation of actin cytoskeleton organization | 32/919 | 358/18723 | 8.18e-04 | 1.10e-02 | 32 |
| GO:001072111 | Skin | SCCIS | negative regulation of cell development | 19/919 | 180/18723 | 1.40e-03 | 1.59e-02 | 19 |
| GO:0034284111 | Skin | SCCIS | response to monosaccharide | 22/919 | 225/18723 | 1.67e-03 | 1.84e-02 | 22 |
| GO:001081213 | Skin | SCCIS | negative regulation of cell-substrate adhesion | 10/919 | 68/18723 | 1.69e-03 | 1.85e-02 | 10 |
| GO:00181085 | Skin | SCCIS | peptidyl-tyrosine phosphorylation | 32/919 | 375/18723 | 1.75e-03 | 1.88e-02 | 32 |
| GO:000741111 | Skin | SCCIS | axon guidance | 22/919 | 227/18723 | 1.87e-03 | 1.98e-02 | 22 |
| GO:009748511 | Skin | SCCIS | neuron projection guidance | 22/919 | 228/18723 | 1.97e-03 | 2.06e-02 | 22 |
| GO:00182125 | Skin | SCCIS | peptidyl-tyrosine modification | 32/919 | 378/18723 | 1.98e-03 | 2.06e-02 | 32 |
| GO:00507304 | Skin | SCCIS | regulation of peptidyl-tyrosine phosphorylation | 24/919 | 264/18723 | 2.80e-03 | 2.60e-02 | 24 |
| GO:0009743112 | Skin | SCCIS | response to carbohydrate | 23/919 | 253/18723 | 3.38e-03 | 3.01e-02 | 23 |
| GO:001077114 | Skin | SCCIS | negative regulation of cell morphogenesis involved in differentiation | 4/919 | 14/18723 | 3.89e-03 | 3.33e-02 | 4 |
| GO:190002514 | Skin | SCCIS | negative regulation of substrate adhesion-dependent cell spreading | 4/919 | 14/18723 | 3.89e-03 | 3.33e-02 | 4 |
| GO:0071322110 | Skin | SCCIS | cellular response to carbohydrate stimulus | 16/919 | 163/18723 | 6.50e-03 | 4.89e-02 | 16 |
| GO:015011525 | Skin | cSCC | cell-substrate junction organization | 51/4864 | 101/18723 | 1.13e-07 | 2.68e-06 | 51 |
| GO:000704425 | Skin | cSCC | cell-substrate junction assembly | 48/4864 | 95/18723 | 2.57e-07 | 5.33e-06 | 48 |
| GO:015011625 | Skin | cSCC | regulation of cell-substrate junction organization | 37/4864 | 71/18723 | 2.28e-06 | 3.70e-05 | 37 |
| Page: 1 2 3 4 5 6 7 8 9 10 11 12 13 14 15 16 17 18 19 20 21 22 23 24 25 26 27 28 29 30 31 32 33 34 35 36 37 38 39 40 41 42 43 44 45 46 47 |
| Pathway ID | Tissue | Disease Stage | Description | Gene Ratio | Bg Ratio | pvalue | p.adjust | qvalue | Count |
| hsa0401512 | Cervix | CC | Rap1 signaling pathway | 56/1267 | 210/8465 | 6.23e-06 | 5.61e-05 | 3.32e-05 | 56 |
| hsa043609 | Cervix | CC | Axon guidance | 47/1267 | 182/8465 | 8.13e-05 | 5.38e-04 | 3.18e-04 | 47 |
| hsa040142 | Cervix | CC | Ras signaling pathway | 51/1267 | 236/8465 | 3.55e-03 | 1.34e-02 | 7.91e-03 | 51 |
| hsa040109 | Cervix | CC | MAPK signaling pathway | 62/1267 | 302/8465 | 4.89e-03 | 1.67e-02 | 9.86e-03 | 62 |
| hsa0401513 | Cervix | CC | Rap1 signaling pathway | 56/1267 | 210/8465 | 6.23e-06 | 5.61e-05 | 3.32e-05 | 56 |
| hsa0436012 | Cervix | CC | Axon guidance | 47/1267 | 182/8465 | 8.13e-05 | 5.38e-04 | 3.18e-04 | 47 |
| hsa0401411 | Cervix | CC | Ras signaling pathway | 51/1267 | 236/8465 | 3.55e-03 | 1.34e-02 | 7.91e-03 | 51 |
| hsa0401012 | Cervix | CC | MAPK signaling pathway | 62/1267 | 302/8465 | 4.89e-03 | 1.67e-02 | 9.86e-03 | 62 |
| hsa04015 | Colorectum | AD | Rap1 signaling pathway | 71/2092 | 210/8465 | 1.72e-03 | 9.68e-03 | 6.18e-03 | 71 |
| hsa04360 | Colorectum | AD | Axon guidance | 61/2092 | 182/8465 | 4.36e-03 | 2.17e-02 | 1.38e-02 | 61 |
| hsa040151 | Colorectum | AD | Rap1 signaling pathway | 71/2092 | 210/8465 | 1.72e-03 | 9.68e-03 | 6.18e-03 | 71 |
| hsa043601 | Colorectum | AD | Axon guidance | 61/2092 | 182/8465 | 4.36e-03 | 2.17e-02 | 1.38e-02 | 61 |
| hsa040152 | Colorectum | SER | Rap1 signaling pathway | 54/1580 | 210/8465 | 6.55e-03 | 3.68e-02 | 2.67e-02 | 54 |
| hsa040153 | Colorectum | SER | Rap1 signaling pathway | 54/1580 | 210/8465 | 6.55e-03 | 3.68e-02 | 2.67e-02 | 54 |
| hsa040154 | Colorectum | MSS | Rap1 signaling pathway | 66/1875 | 210/8465 | 1.03e-03 | 5.94e-03 | 3.64e-03 | 66 |
| hsa043602 | Colorectum | MSS | Axon guidance | 54/1875 | 182/8465 | 1.03e-02 | 3.69e-02 | 2.26e-02 | 54 |
| hsa040155 | Colorectum | MSS | Rap1 signaling pathway | 66/1875 | 210/8465 | 1.03e-03 | 5.94e-03 | 3.64e-03 | 66 |
| hsa043603 | Colorectum | MSS | Axon guidance | 54/1875 | 182/8465 | 1.03e-02 | 3.69e-02 | 2.26e-02 | 54 |
| hsa040156 | Colorectum | FAP | Rap1 signaling pathway | 53/1404 | 210/8465 | 7.93e-04 | 5.14e-03 | 3.13e-03 | 53 |
| hsa043604 | Colorectum | FAP | Axon guidance | 47/1404 | 182/8465 | 9.09e-04 | 5.20e-03 | 3.16e-03 | 47 |
| Page: 1 2 3 4 5 |
Top |
Cell-cell communication analysis |
| Identification of potential cell-cell interactions between two cell types and their ligand-receptor pairs for different disease states |
| Ligand | Receptor | LRpair | Pathway | Tissue | Disease Stage |
| EFNA5 | EPHA2 | EFNA5_EPHA2 | EPHA | Breast | DCIS |
| EFNA5 | EPHA2 | EFNA5_EPHA2 | EPHA | Cervix | CC |
| EFNA5 | EPHA4 | EFNA5_EPHA4 | EPHA | Cervix | CC |
| EFNA5 | EPHB2 | EFNA5_EPHB2 | EPHA | Cervix | CC |
| EFNA5 | EPHA4 | EFNA5_EPHA4 | EPHA | CRC | AD |
| EFNA5 | EPHB2 | EFNA5_EPHB2 | EPHA | CRC | AD |
| EFNA5 | EPHA3 | EFNA5_EPHA3 | EPHA | CRC | ADJ |
| EFNA5 | EPHA4 | EFNA5_EPHA4 | EPHA | CRC | ADJ |
| EFNA5 | EPHB2 | EFNA5_EPHB2 | EPHA | CRC | ADJ |
| EFNA5 | EPHB2 | EFNA5_EPHB2 | EPHA | CRC | CRC |
| EFNA5 | EPHA2 | EFNA5_EPHA2 | EPHA | CRC | FAP |
| EFNA5 | EPHA3 | EFNA5_EPHA3 | EPHA | CRC | FAP |
| EFNA5 | EPHA4 | EFNA5_EPHA4 | EPHA | CRC | FAP |
| EFNA5 | EPHB2 | EFNA5_EPHB2 | EPHA | CRC | FAP |
| EFNA5 | EPHA4 | EFNA5_EPHA4 | EPHA | CRC | Healthy |
| EFNA5 | EPHB2 | EFNA5_EPHB2 | EPHA | CRC | Healthy |
| EFNA5 | EPHA2 | EFNA5_EPHA2 | EPHA | CRC | MSI-H |
| EFNA5 | EPHA4 | EFNA5_EPHA4 | EPHA | CRC | MSI-H |
| EFNA5 | EPHA5 | EFNA5_EPHA5 | EPHA | CRC | MSI-H |
| EFNA5 | EPHB2 | EFNA5_EPHB2 | EPHA | CRC | MSI-H |
| Page: 1 2 3 4 |
Top |
Single-cell gene regulatory network inference analysis |
| Find out the significant the regulons (TFs) and the target genes of each regulon across cell types for different disease states |
| TF | Cell Type | Tissue | Disease Stage | Target Gene | RSS | Regulon Activity |
| ∗The dot plots of a searched regulon are shown for all cell subpopulations in each disease state of each tissue based on the regulon specific score inferred using pySCENIC and by calculating the average expression. |
| Page: 1 |
Top |
Somatic mutation of malignant transformation related genes |
| Annotation of somatic variants for genes involved in malignant transformation |
| Hugo Symbol | Variant Class | Variant Classification | dbSNP RS | HGVSc | HGVSp | HGVSp Short | SWISSPROT | BIOTYPE | SIFT | PolyPhen | Tumor Sample Barcode | Tissue | Histology | Sex | Age | Stage | Therapy Types | Drugs | Outcome |
| EFNA5 | SNV | Missense_Mutation | novel | c.560N>A | p.Pro187Gln | p.P187Q | P52803 | protein_coding | tolerated(0.08) | possibly_damaging(0.641) | TCGA-A2-A25A-01 | Breast | breast invasive carcinoma | Female | <65 | I/II | Unspecific | Cytoxan | SD |
| EFNA5 | SNV | Missense_Mutation | novel | c.533A>G | p.Asn178Ser | p.N178S | P52803 | protein_coding | tolerated(0.21) | benign(0.038) | TCGA-EW-A423-01 | Breast | breast invasive carcinoma | Female | >=65 | I/II | Hormone Therapy | anastrozole | SD |
| EFNA5 | SNV | Missense_Mutation | c.644N>C | p.Leu215Ser | p.L215S | P52803 | protein_coding | deleterious_low_confidence(0) | possibly_damaging(0.766) | TCGA-A6-6780-01 | Colorectum | colon adenocarcinoma | Male | >=65 | I/II | Unknown | Unknown | SD | |
| EFNA5 | SNV | Missense_Mutation | rs767938203 | c.680N>T | p.Thr227Ile | p.T227I | P52803 | protein_coding | tolerated_low_confidence(0.2) | benign(0) | TCGA-AA-3975-01 | Colorectum | colon adenocarcinoma | Male | >=65 | I/II | Unknown | Unknown | SD |
| EFNA5 | SNV | Missense_Mutation | c.517C>T | p.Arg173Cys | p.R173C | P52803 | protein_coding | deleterious(0) | possibly_damaging(0.759) | TCGA-AG-A002-01 | Colorectum | rectum adenocarcinoma | Male | <65 | I/II | Unknown | Unknown | SD | |
| EFNA5 | SNV | Missense_Mutation | novel | c.374C>T | p.Ser125Phe | p.S125F | P52803 | protein_coding | deleterious(0) | probably_damaging(0.998) | TCGA-AG-A002-01 | Colorectum | rectum adenocarcinoma | Male | <65 | I/II | Unknown | Unknown | SD |
| EFNA5 | SNV | Missense_Mutation | rs780608946 | c.271G>A | p.Asp91Asn | p.D91N | P52803 | protein_coding | tolerated(0.23) | benign(0.083) | TCGA-AG-A002-01 | Colorectum | rectum adenocarcinoma | Male | <65 | I/II | Unknown | Unknown | SD |
| EFNA5 | SNV | Missense_Mutation | novel | c.15N>T | p.Glu5Asp | p.E5D | P52803 | protein_coding | tolerated(0.25) | benign(0.001) | TCGA-F5-6814-01 | Colorectum | rectum adenocarcinoma | Male | <65 | I/II | Unknown | Unknown | SD |
| EFNA5 | SNV | Missense_Mutation | novel | c.618N>T | p.Gln206His | p.Q206H | P52803 | protein_coding | tolerated_low_confidence(0.14) | benign(0) | TCGA-AJ-A23O-01 | Endometrium | uterine corpus endometrioid carcinoma | Female | >=65 | I/II | Unknown | Unknown | SD |
| EFNA5 | SNV | Missense_Mutation | novel | c.446G>T | p.Arg149Met | p.R149M | P52803 | protein_coding | deleterious(0) | possibly_damaging(0.774) | TCGA-AP-A056-01 | Endometrium | uterine corpus endometrioid carcinoma | Female | <65 | I/II | Unknown | Unknown | SD |
| Page: 1 2 3 |
Top |
Related drugs of malignant transformation related genes |
| Identification of chemicals and drugs interact with genes involved in malignant transfromation |
| (DGIdb 4.0) |
| Entrez ID | Symbol | Category | Interaction Types | Drug Claim Name | Drug Name | PMIDs |
| Page: 1 |

Copyright 2023-Present -The University of Texas Health Science Center at Houston |