
|
|||||
|
 | |
| |
| |
| |
| |
| |
|
Gene: WWTR1 |
Gene summary for WWTR1 |
| Gene information | Species | Human | Gene symbol | WWTR1 | Gene ID | 25937 |
| Gene name | WW domain containing transcription regulator 1 | |
| Gene Alias | TAZ | |
| Cytomap | 3q25.1 | |
| Gene Type | protein-coding | GO ID | GO:0000122 | UniProtAcc | Q9GZV5 |
Top |
Malignant transformation analysis |
| Identification of the aberrant gene expression in precancerous and cancerous lesions by comparing the gene expression of stem-like cells in diseased tissues with normal stem cells |
| Entrez ID | Symbol | Replicates | Species | Organ | Tissue | Adj P-value | Log2FC | Malignancy |
| 25937 | WWTR1 | CA_HPV_3 | Human | Cervix | CC | 2.68e-03 | 1.21e-01 | 0.0414 |
| 25937 | WWTR1 | CCI_1 | Human | Cervix | CC | 2.45e-02 | 7.22e-01 | 0.528 |
| 25937 | WWTR1 | CCI_2 | Human | Cervix | CC | 2.19e-16 | 1.85e+00 | 0.5249 |
| 25937 | WWTR1 | CCI_3 | Human | Cervix | CC | 1.52e-13 | 9.59e-01 | 0.516 |
| 25937 | WWTR1 | T1 | Human | Cervix | CC | 3.93e-10 | 4.51e-01 | 0.0918 |
| 25937 | WWTR1 | HTA11_1938_2000001011 | Human | Colorectum | AD | 3.21e-05 | 2.92e-01 | -0.0811 |
| 25937 | WWTR1 | HTA11_347_2000001011 | Human | Colorectum | AD | 2.23e-10 | 3.10e-01 | -0.1954 |
| 25937 | WWTR1 | HTA11_411_2000001011 | Human | Colorectum | SER | 1.27e-02 | 5.72e-01 | -0.2602 |
| 25937 | WWTR1 | HTA11_1391_2000001011 | Human | Colorectum | AD | 9.49e-08 | 3.78e-01 | -0.059 |
| 25937 | WWTR1 | HTA11_7862_2000001011 | Human | Colorectum | AD | 2.25e-02 | 2.64e-01 | -0.0179 |
| 25937 | WWTR1 | HTA11_866_3004761011 | Human | Colorectum | AD | 4.18e-05 | 3.62e-01 | 0.096 |
| 25937 | WWTR1 | HTA11_99999970781_79442 | Human | Colorectum | MSS | 5.50e-21 | 5.46e-01 | 0.294 |
| 25937 | WWTR1 | HTA11_99999965062_69753 | Human | Colorectum | MSI-H | 9.49e-08 | 9.05e-01 | 0.3487 |
| 25937 | WWTR1 | A001-C-119 | Human | Colorectum | FAP | 6.01e-04 | 4.34e-01 | -0.1557 |
| 25937 | WWTR1 | AEH-subject1 | Human | Endometrium | AEH | 1.24e-07 | 3.40e-01 | -0.3059 |
| 25937 | WWTR1 | AEH-subject2 | Human | Endometrium | AEH | 5.66e-08 | 2.41e-01 | -0.2525 |
| 25937 | WWTR1 | AEH-subject3 | Human | Endometrium | AEH | 1.33e-07 | 9.98e-02 | -0.2576 |
| 25937 | WWTR1 | AEH-subject4 | Human | Endometrium | AEH | 2.00e-08 | 3.56e-01 | -0.2657 |
| 25937 | WWTR1 | AEH-subject5 | Human | Endometrium | AEH | 1.96e-33 | 8.33e-01 | -0.2953 |
| 25937 | WWTR1 | EEC-subject1 | Human | Endometrium | EEC | 2.73e-26 | 6.79e-01 | -0.2682 |
| Page: 1 2 3 4 5 6 7 8 9 |
| Tissue | Expression Dynamics | Abbreviation |
| Cervix | 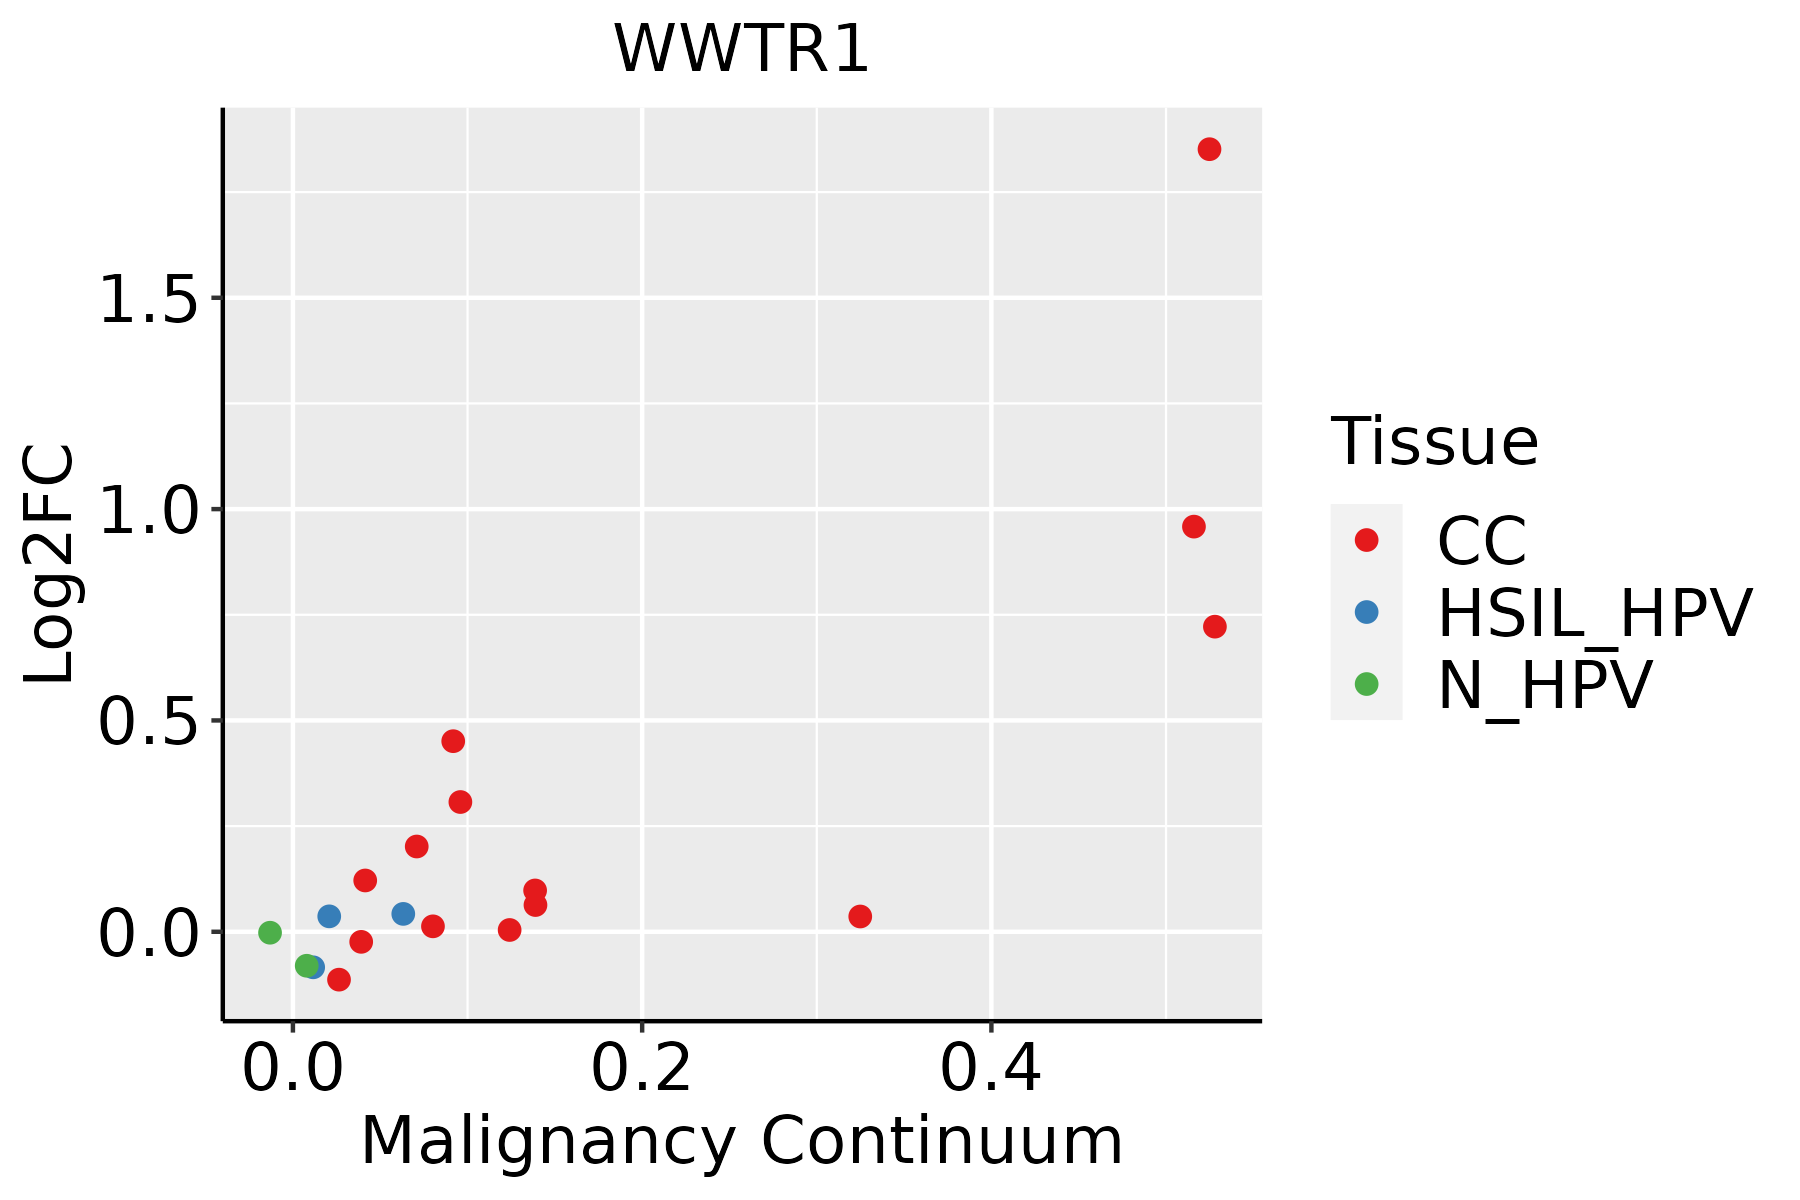 | CC: Cervix cancer |
| HSIL_HPV: HPV-infected high-grade squamous intraepithelial lesions | ||
| N_HPV: HPV-infected normal cervix | ||
| Colorectum (GSE201348) |  | FAP: Familial adenomatous polyposis |
| CRC: Colorectal cancer | ||
| Colorectum (HTA11) |  | AD: Adenomas |
| SER: Sessile serrated lesions | ||
| MSI-H: Microsatellite-high colorectal cancer | ||
| MSS: Microsatellite stable colorectal cancer | ||
| Endometrium |  | AEH: Atypical endometrial hyperplasia |
| EEC: Endometrioid Cancer | ||
| Esophagus | 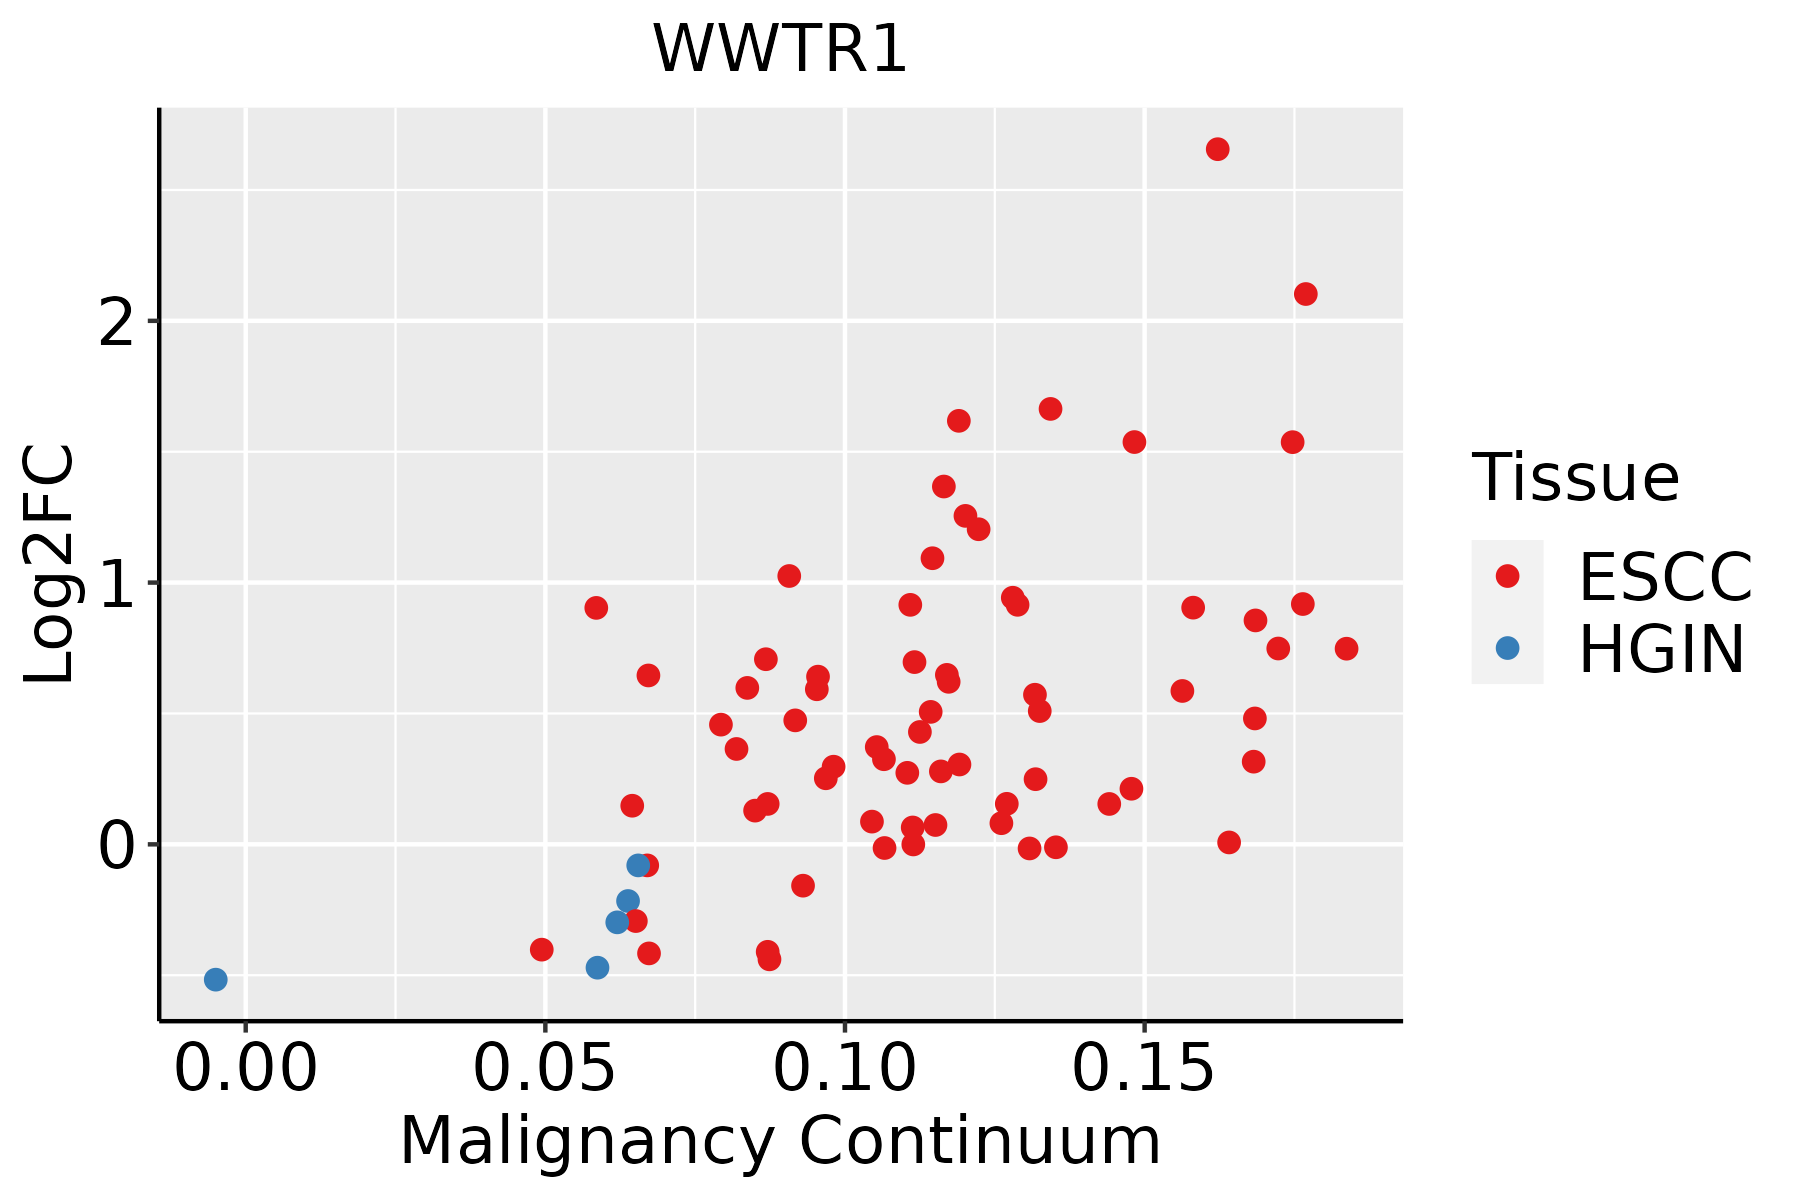 | ESCC: Esophageal squamous cell carcinoma |
| HGIN: High-grade intraepithelial neoplasias | ||
| LGIN: Low-grade intraepithelial neoplasias | ||
| Liver |  | HCC: Hepatocellular carcinoma |
| NAFLD: Non-alcoholic fatty liver disease | ||
| Lung |  | AAH: Atypical adenomatous hyperplasia |
| AIS: Adenocarcinoma in situ | ||
| IAC: Invasive lung adenocarcinoma | ||
| MIA: Minimally invasive adenocarcinoma | ||
| Oral Cavity | 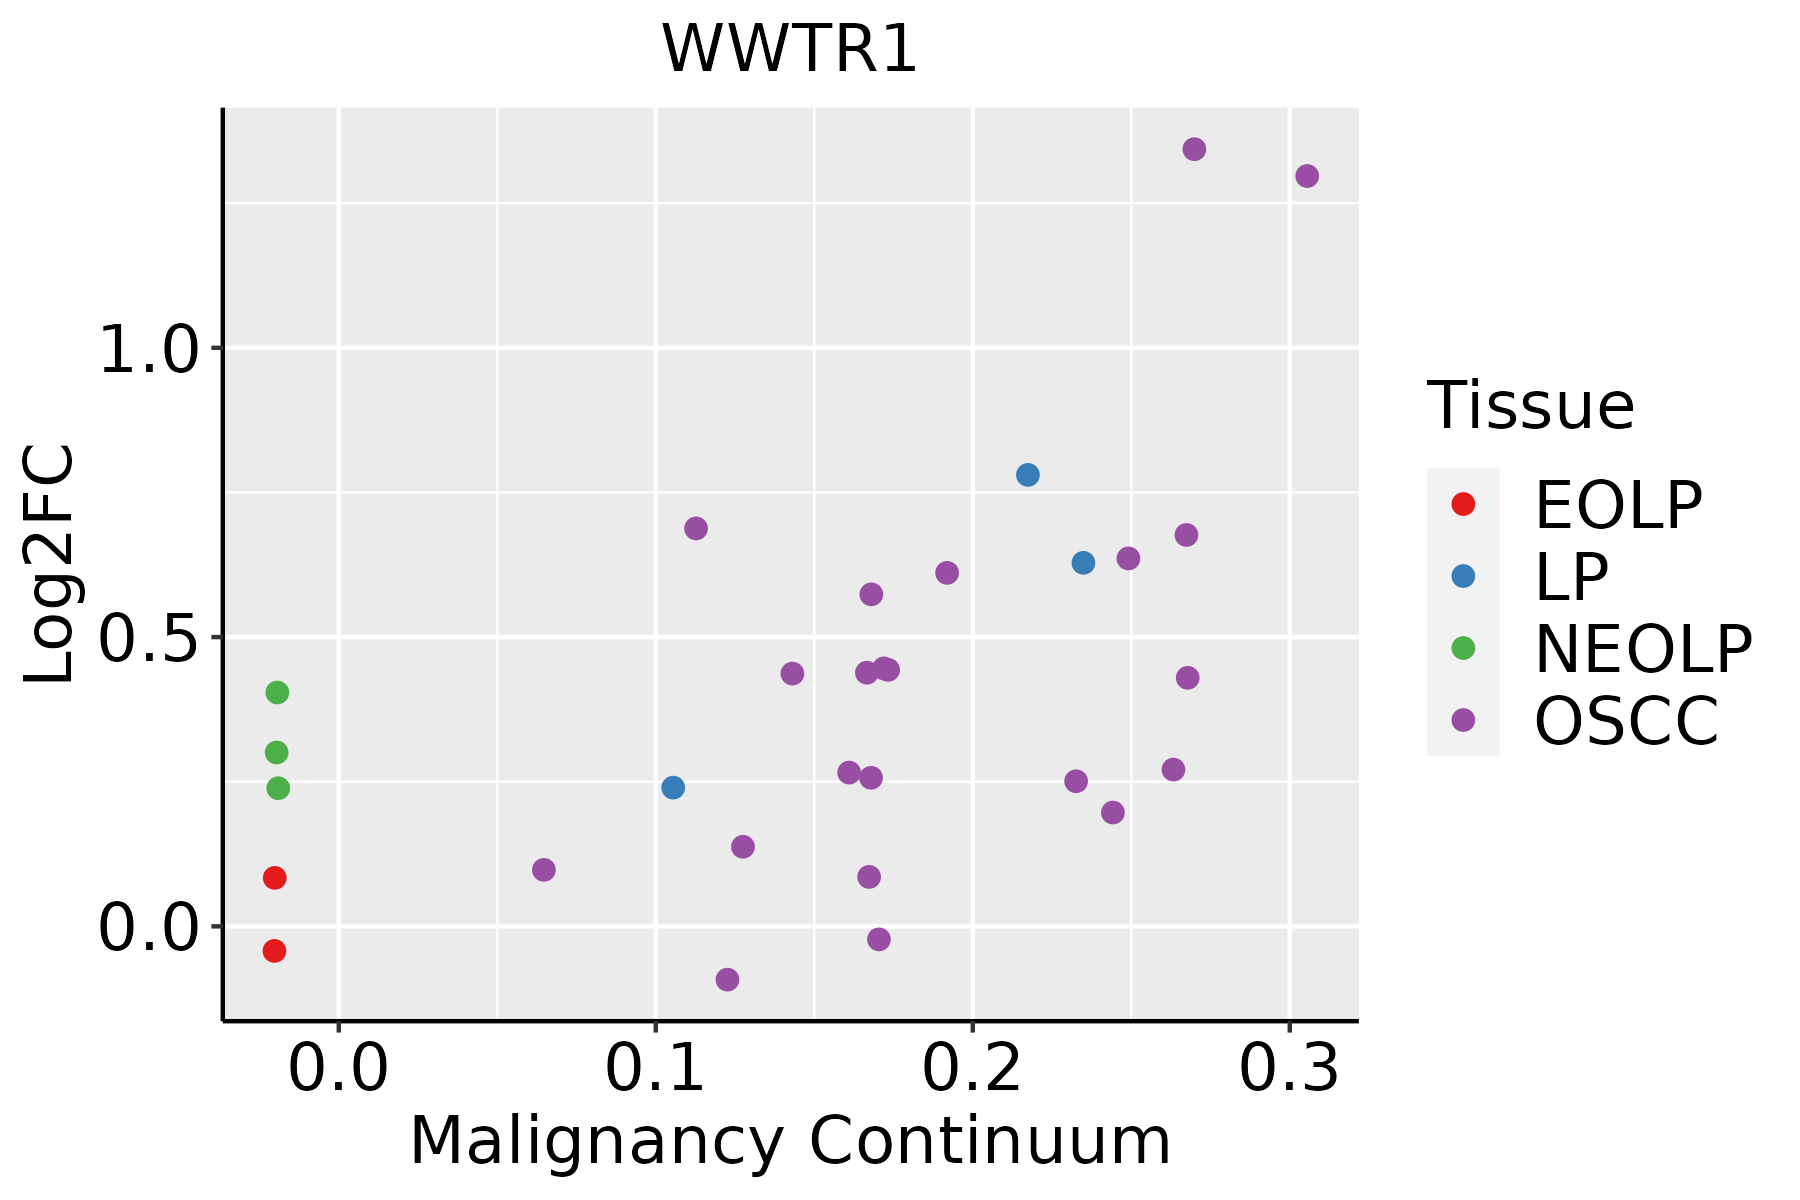 | EOLP: Erosive Oral lichen planus |
| LP: leukoplakia | ||
| NEOLP: Non-erosive oral lichen planus | ||
| OSCC: Oral squamous cell carcinoma | ||
| Prostate | 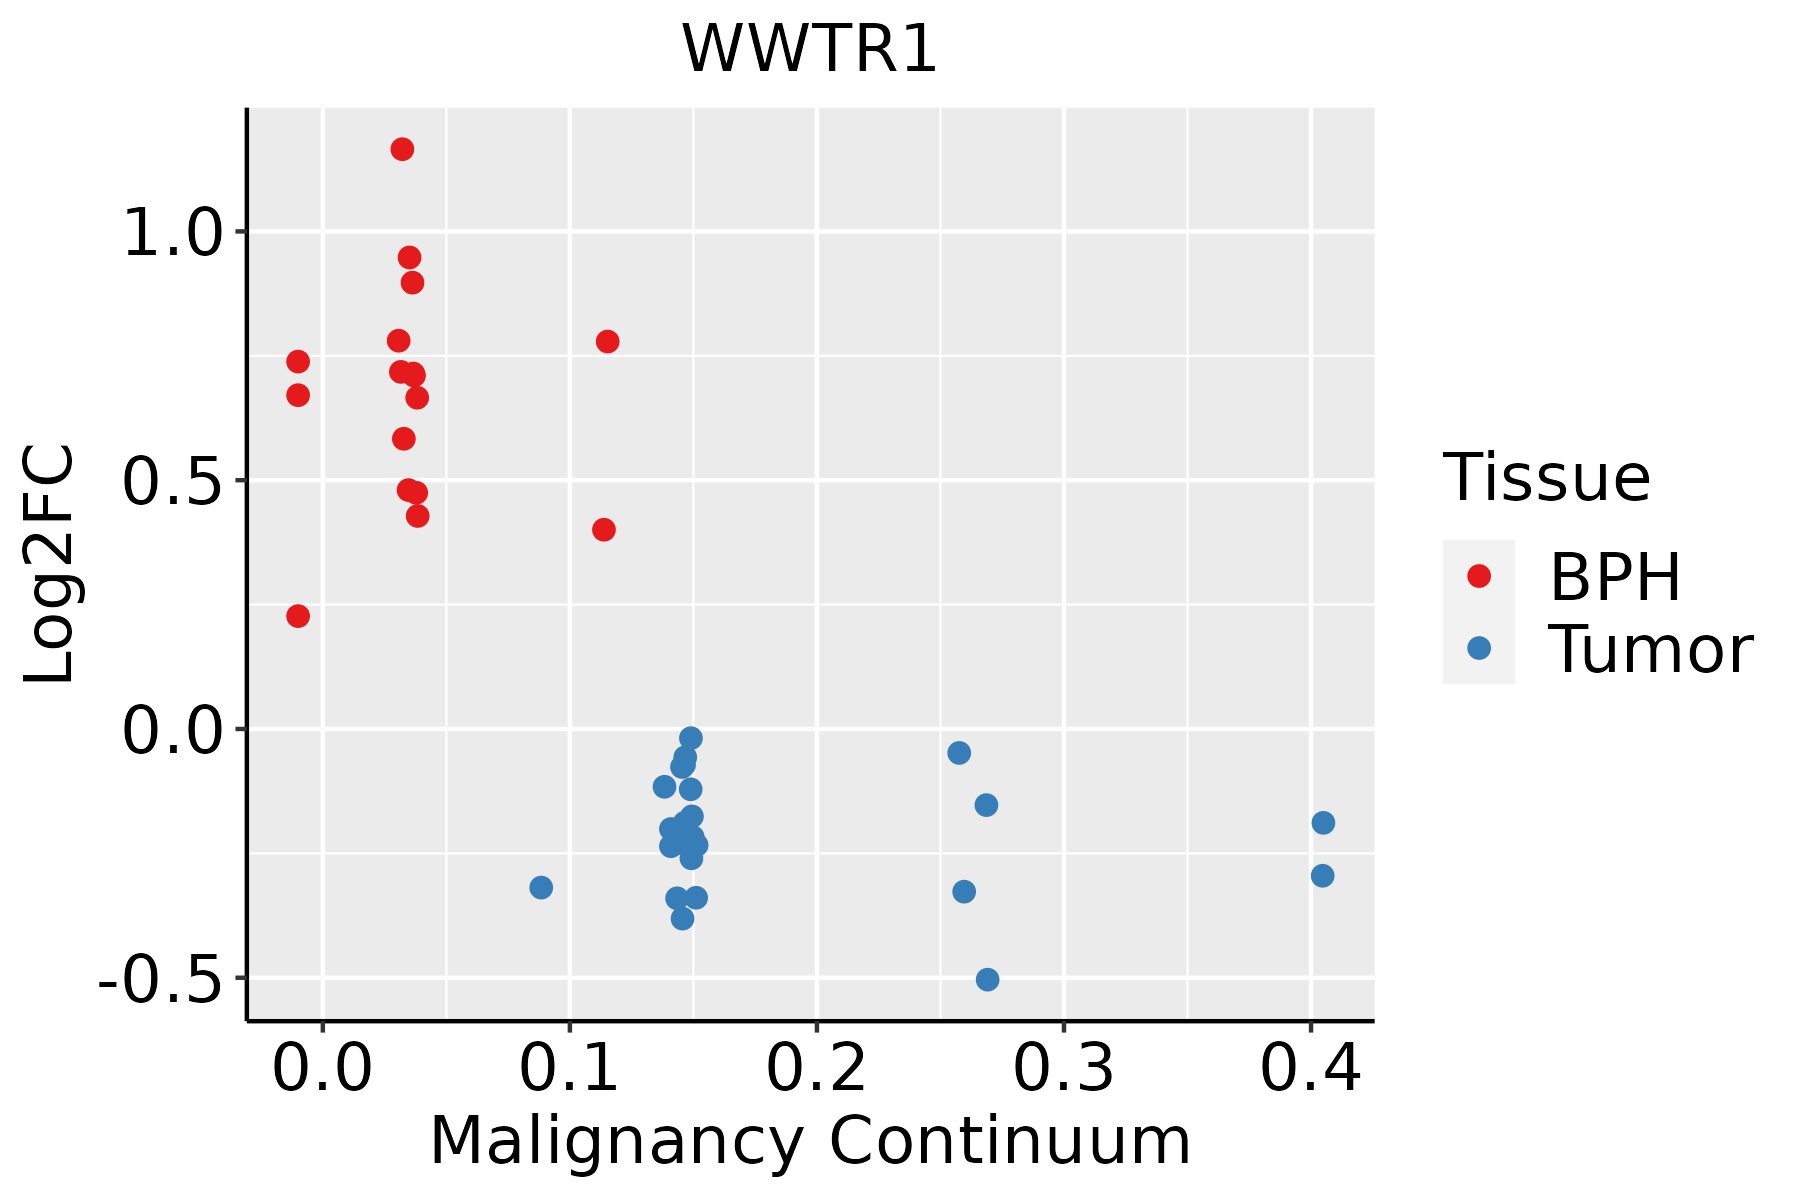 | BPH: Benign Prostatic Hyperplasia |
| Thyroid | 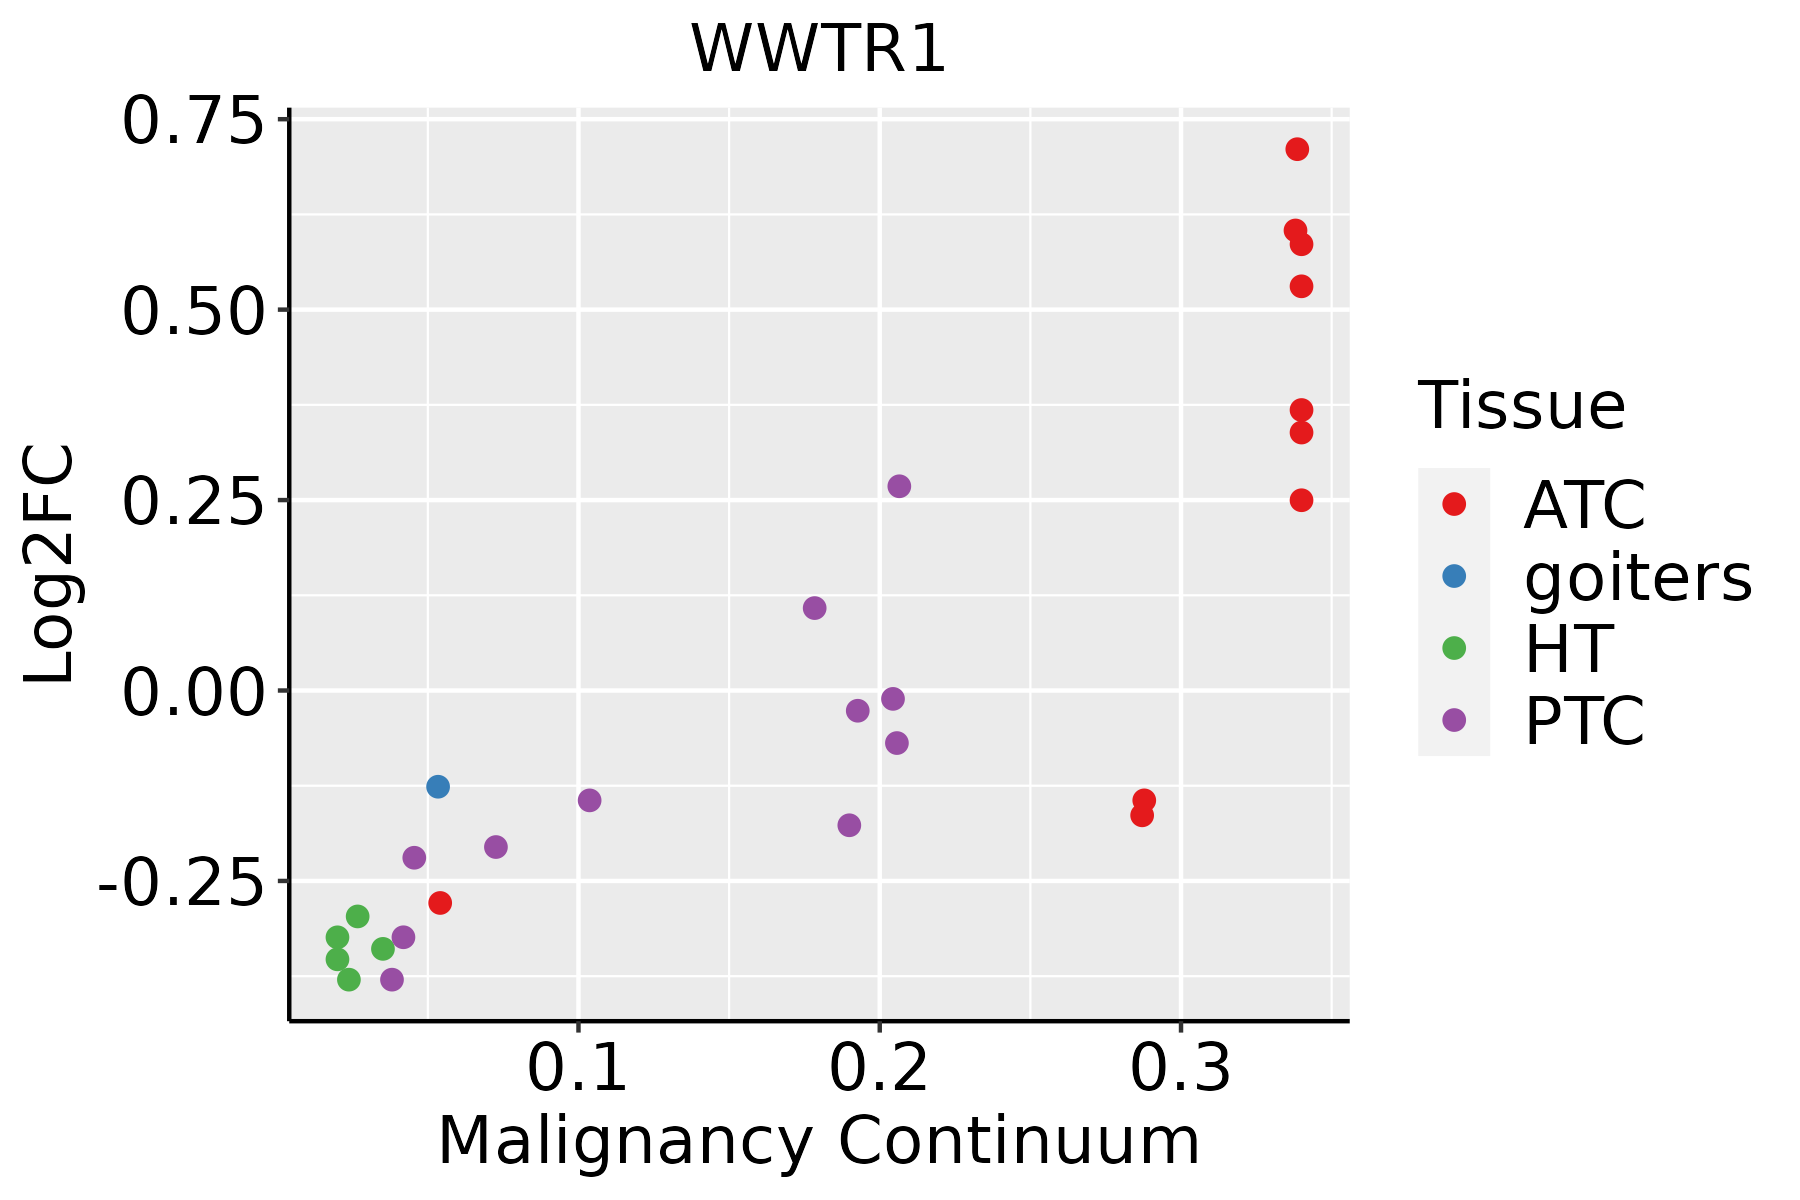 | ATC: Anaplastic thyroid cancer |
| HT: Hashimoto's thyroiditis | ||
| PTC: Papillary thyroid cancer |
| ∗log2FC in expression of this searched gene in stem-like cells from each diseased tissue sample relative to stem-like cells in normal samples in each tissue plotted against the malignancy continuum. Samples are colored based on if they are from different disease stage. |
Top |
Malignant transformation related pathway analysis |
| Find out the enriched GO biological processes and KEGG pathways involved in transition from healthy to precancer to cancer |
| Tissue | Disease Stage | Enriched GO biological Processes |
| Colorectum | AD |  |
| Colorectum | SER |  |
| Colorectum | MSS |  |
| Colorectum | MSI-H |  |
| Colorectum | FAP |  |
| ∗Top 15 enriched GO BP terms are showed in the bar plot of each disease state in each tissue. Each row represents a significant GO biological process which is colored according to the -log10(p.adjust). |
| Page: 1 2 3 4 5 6 7 8 9 |
| GO ID | Tissue | Disease Stage | Description | Gene Ratio | Bg Ratio | pvalue | p.adjust | Count |
| GO:000165517 | Thyroid | PTC | urogenital system development | 149/5968 | 338/18723 | 1.41e-06 | 2.01e-05 | 149 |
| GO:007200114 | Thyroid | PTC | renal system development | 135/5968 | 302/18723 | 1.76e-06 | 2.43e-05 | 135 |
| GO:000183715 | Thyroid | PTC | epithelial to mesenchymal transition | 76/5968 | 157/18723 | 1.10e-05 | 1.21e-04 | 76 |
| GO:0001649111 | Thyroid | PTC | osteoblast differentiation | 102/5968 | 229/18723 | 3.66e-05 | 3.40e-04 | 102 |
| GO:004544418 | Thyroid | PTC | fat cell differentiation | 102/5968 | 229/18723 | 3.66e-05 | 3.40e-04 | 102 |
| GO:003532912 | Thyroid | PTC | hippo signaling | 24/5968 | 40/18723 | 2.27e-04 | 1.65e-03 | 24 |
| GO:001071812 | Thyroid | PTC | positive regulation of epithelial to mesenchymal transition | 29/5968 | 52/18723 | 3.09e-04 | 2.15e-03 | 29 |
| GO:004876215 | Thyroid | PTC | mesenchymal cell differentiation | 99/5968 | 236/18723 | 6.72e-04 | 4.22e-03 | 99 |
| GO:003017810 | Thyroid | PTC | negative regulation of Wnt signaling pathway | 74/5968 | 170/18723 | 8.99e-04 | 5.48e-03 | 74 |
| GO:00107175 | Thyroid | PTC | regulation of epithelial to mesenchymal transition | 46/5968 | 99/18723 | 1.66e-03 | 9.13e-03 | 46 |
| GO:007207316 | Thyroid | PTC | kidney epithelium development | 60/5968 | 136/18723 | 1.78e-03 | 9.66e-03 | 60 |
| GO:00720067 | Thyroid | PTC | nephron development | 61/5968 | 142/18723 | 3.49e-03 | 1.69e-02 | 61 |
| GO:00900907 | Thyroid | PTC | negative regulation of canonical Wnt signaling pathway | 59/5968 | 137/18723 | 3.76e-03 | 1.80e-02 | 59 |
| GO:004559814 | Thyroid | PTC | regulation of fat cell differentiation | 59/5968 | 139/18723 | 5.50e-03 | 2.50e-02 | 59 |
| GO:00352648 | Thyroid | PTC | multicellular organism growth | 56/5968 | 132/18723 | 6.79e-03 | 2.92e-02 | 56 |
| GO:00456697 | Thyroid | PTC | positive regulation of osteoblast differentiation | 32/5968 | 69/18723 | 8.16e-03 | 3.44e-02 | 32 |
| GO:006048514 | Thyroid | PTC | mesenchyme development | 112/5968 | 291/18723 | 9.48e-03 | 3.90e-02 | 112 |
| GO:00328356 | Thyroid | PTC | glomerulus development | 29/5968 | 62/18723 | 9.96e-03 | 4.07e-02 | 29 |
| GO:00610056 | Thyroid | PTC | cell differentiation involved in kidney development | 27/5968 | 57/18723 | 1.04e-02 | 4.18e-02 | 27 |
| GO:00171452 | Thyroid | PTC | stem cell division | 16/5968 | 30/18723 | 1.19e-02 | 4.69e-02 | 16 |
| Page: 1 2 3 4 5 6 7 8 9 10 11 12 13 14 15 16 17 18 19 20 21 22 23 24 25 26 27 28 29 30 31 32 33 34 35 36 37 38 39 40 |
| Pathway ID | Tissue | Disease Stage | Description | Gene Ratio | Bg Ratio | pvalue | p.adjust | qvalue | Count |
| hsa043908 | Cervix | CC | Hippo signaling pathway | 40/1267 | 157/8465 | 3.64e-04 | 1.82e-03 | 1.07e-03 | 40 |
| hsa0439013 | Cervix | CC | Hippo signaling pathway | 40/1267 | 157/8465 | 3.64e-04 | 1.82e-03 | 1.07e-03 | 40 |
| hsa04390 | Colorectum | MSS | Hippo signaling pathway | 48/1875 | 157/8465 | 8.32e-03 | 3.10e-02 | 1.90e-02 | 48 |
| hsa043901 | Colorectum | MSS | Hippo signaling pathway | 48/1875 | 157/8465 | 8.32e-03 | 3.10e-02 | 1.90e-02 | 48 |
| hsa043902 | Colorectum | FAP | Hippo signaling pathway | 41/1404 | 157/8465 | 1.49e-03 | 7.91e-03 | 4.81e-03 | 41 |
| hsa043903 | Colorectum | FAP | Hippo signaling pathway | 41/1404 | 157/8465 | 1.49e-03 | 7.91e-03 | 4.81e-03 | 41 |
| hsa043909 | Endometrium | AEH | Hippo signaling pathway | 38/1197 | 157/8465 | 4.79e-04 | 3.38e-03 | 2.47e-03 | 38 |
| hsa0439014 | Endometrium | AEH | Hippo signaling pathway | 38/1197 | 157/8465 | 4.79e-04 | 3.38e-03 | 2.47e-03 | 38 |
| hsa0439023 | Endometrium | EEC | Hippo signaling pathway | 39/1237 | 157/8465 | 4.54e-04 | 3.47e-03 | 2.59e-03 | 39 |
| hsa0439033 | Endometrium | EEC | Hippo signaling pathway | 39/1237 | 157/8465 | 4.54e-04 | 3.47e-03 | 2.59e-03 | 39 |
| hsa0439018 | Esophagus | ESCC | Hippo signaling pathway | 92/4205 | 157/8465 | 1.46e-02 | 3.31e-02 | 1.69e-02 | 92 |
| hsa0439019 | Esophagus | ESCC | Hippo signaling pathway | 92/4205 | 157/8465 | 1.46e-02 | 3.31e-02 | 1.69e-02 | 92 |
| hsa043907 | Lung | IAC | Hippo signaling pathway | 35/1053 | 157/8465 | 3.60e-04 | 3.45e-03 | 2.29e-03 | 35 |
| hsa0439012 | Lung | IAC | Hippo signaling pathway | 35/1053 | 157/8465 | 3.60e-04 | 3.45e-03 | 2.29e-03 | 35 |
| hsa0439022 | Lung | AIS | Hippo signaling pathway | 34/961 | 157/8465 | 1.36e-04 | 1.63e-03 | 1.05e-03 | 34 |
| hsa0439032 | Lung | AIS | Hippo signaling pathway | 34/961 | 157/8465 | 1.36e-04 | 1.63e-03 | 1.05e-03 | 34 |
| hsa0439041 | Lung | MIAC | Hippo signaling pathway | 21/507 | 157/8465 | 4.20e-04 | 7.19e-03 | 5.20e-03 | 21 |
| hsa0439051 | Lung | MIAC | Hippo signaling pathway | 21/507 | 157/8465 | 4.20e-04 | 7.19e-03 | 5.20e-03 | 21 |
| hsa0439016 | Oral cavity | OSCC | Hippo signaling pathway | 86/3704 | 157/8465 | 3.30e-03 | 8.24e-03 | 4.20e-03 | 86 |
| hsa0439017 | Oral cavity | OSCC | Hippo signaling pathway | 86/3704 | 157/8465 | 3.30e-03 | 8.24e-03 | 4.20e-03 | 86 |
| Page: 1 2 |
Top |
Cell-cell communication analysis |
| Identification of potential cell-cell interactions between two cell types and their ligand-receptor pairs for different disease states |
| Ligand | Receptor | LRpair | Pathway | Tissue | Disease Stage |
| Page: 1 |
Top |
Single-cell gene regulatory network inference analysis |
| Find out the significant the regulons (TFs) and the target genes of each regulon across cell types for different disease states |
| TF | Cell Type | Tissue | Disease Stage | Target Gene | RSS | Regulon Activity |
| ∗The dot plots of a searched regulon are shown for all cell subpopulations in each disease state of each tissue based on the regulon specific score inferred using pySCENIC and by calculating the average expression. |
| Page: 1 |
Top |
Somatic mutation of malignant transformation related genes |
| Annotation of somatic variants for genes involved in malignant transformation |
| Hugo Symbol | Variant Class | Variant Classification | dbSNP RS | HGVSc | HGVSp | HGVSp Short | SWISSPROT | BIOTYPE | SIFT | PolyPhen | Tumor Sample Barcode | Tissue | Histology | Sex | Age | Stage | Therapy Types | Drugs | Outcome |
| WWTR1 | SNV | Missense_Mutation | c.32C>T | p.Pro11Leu | p.P11L | Q9GZV5 | protein_coding | deleterious(0) | benign(0.007) | TCGA-AQ-A04J-01 | Breast | breast invasive carcinoma | Female | <65 | I/II | Chemotherapy | cytoxan | SD | |
| WWTR1 | SNV | Missense_Mutation | rs756242761 | c.235N>T | p.Ala79Ser | p.A79S | Q9GZV5 | protein_coding | tolerated(0.47) | benign(0.038) | TCGA-D8-A27G-01 | Breast | breast invasive carcinoma | Female | >=65 | I/II | Unknown | Unknown | SD |
| WWTR1 | deletion | Frame_Shift_Del | novel | c.666delN | p.Asn223MetfsTer3 | p.N223Mfs*3 | Q9GZV5 | protein_coding | TCGA-D8-A27V-01 | Breast | breast invasive carcinoma | Female | <65 | I/II | Hormone Therapy | tamoxiphen | SD | ||
| WWTR1 | SNV | Missense_Mutation | novel | c.1125N>T | p.Glu375Asp | p.E375D | Q9GZV5 | protein_coding | deleterious(0.02) | benign(0.124) | TCGA-A6-5665-01 | Colorectum | colon adenocarcinoma | Female | >=65 | I/II | Unknown | Unknown | PD |
| WWTR1 | SNV | Missense_Mutation | c.872N>C | p.Ile291Thr | p.I291T | Q9GZV5 | protein_coding | tolerated(0.07) | benign(0.003) | TCGA-A6-6780-01 | Colorectum | colon adenocarcinoma | Male | >=65 | I/II | Unknown | Unknown | SD | |
| WWTR1 | SNV | Missense_Mutation | c.14N>T | p.Ser5Leu | p.S5L | Q9GZV5 | protein_coding | deleterious_low_confidence(0.01) | benign(0.028) | TCGA-AA-3710-01 | Colorectum | colon adenocarcinoma | Female | >=65 | I/II | Unknown | Unknown | SD | |
| WWTR1 | deletion | Frame_Shift_Del | c.603delC | p.Ser202ValfsTer3 | p.S202Vfs*3 | Q9GZV5 | protein_coding | TCGA-AA-3672-01 | Colorectum | colon adenocarcinoma | Female | >=65 | III/IV | Unknown | Unknown | SD | |||
| WWTR1 | SNV | Missense_Mutation | novel | c.910N>A | p.Pro304Thr | p.P304T | Q9GZV5 | protein_coding | tolerated(1) | benign(0.006) | TCGA-AJ-A3BH-01 | Endometrium | uterine corpus endometrioid carcinoma | Female | Unknown | I/II | Unknown | Unknown | SD |
| WWTR1 | SNV | Missense_Mutation | rs766572084 | c.671C>T | p.Ala224Val | p.A224V | Q9GZV5 | protein_coding | tolerated(0.08) | benign(0.23) | TCGA-AX-A2HD-01 | Endometrium | uterine corpus endometrioid carcinoma | Female | >=65 | III/IV | Unknown | Unknown | SD |
| WWTR1 | SNV | Missense_Mutation | novel | c.364G>A | p.Asp122Asn | p.D122N | Q9GZV5 | protein_coding | deleterious(0) | benign(0.169) | TCGA-AX-A2HD-01 | Endometrium | uterine corpus endometrioid carcinoma | Female | >=65 | III/IV | Unknown | Unknown | SD |
| Page: 1 2 3 |
Top |
Related drugs of malignant transformation related genes |
| Identification of chemicals and drugs interact with genes involved in malignant transfromation |
| (DGIdb 4.0) |
| Entrez ID | Symbol | Category | Interaction Types | Drug Claim Name | Drug Name | PMIDs |
| Page: 1 |

Copyright 2023-Present -The University of Texas Health Science Center at Houston |