
|
|||||
|
 | |
| |
| |
| |
| |
| |
|
Gene: TGFBR2 |
Gene summary for TGFBR2 |
| Gene information | Species | Human | Gene symbol | TGFBR2 | Gene ID | 7048 |
| Gene name | transforming growth factor beta receptor 2 | |
| Gene Alias | AAT3 | |
| Cytomap | 3p24.1 | |
| Gene Type | protein-coding | GO ID | GO:0000003 | UniProtAcc | D2JYI1 |
Top |
Malignant transformation analysis |
| Identification of the aberrant gene expression in precancerous and cancerous lesions by comparing the gene expression of stem-like cells in diseased tissues with normal stem cells |
| Entrez ID | Symbol | Replicates | Species | Organ | Tissue | Adj P-value | Log2FC | Malignancy |
| 7048 | TGFBR2 | HTA11_1938_2000001011 | Human | Colorectum | AD | 4.42e-08 | 6.63e-01 | -0.0811 |
| 7048 | TGFBR2 | HTA11_6818_2000001021 | Human | Colorectum | AD | 8.58e-04 | 4.28e-01 | 0.0588 |
| 7048 | TGFBR2 | HTA11_99999965104_69814 | Human | Colorectum | MSS | 7.15e-11 | 8.02e-01 | 0.281 |
| 7048 | TGFBR2 | HTA11_99999971662_82457 | Human | Colorectum | MSS | 6.01e-04 | 5.01e-01 | 0.3859 |
| 7048 | TGFBR2 | A015-C-203 | Human | Colorectum | FAP | 1.17e-12 | -2.96e-01 | -0.1294 |
| 7048 | TGFBR2 | A002-C-201 | Human | Colorectum | FAP | 5.16e-03 | -1.02e-01 | 0.0324 |
| 7048 | TGFBR2 | A001-C-108 | Human | Colorectum | FAP | 4.37e-04 | 8.66e-02 | -0.0272 |
| 7048 | TGFBR2 | A002-C-205 | Human | Colorectum | FAP | 1.18e-09 | -2.78e-01 | -0.1236 |
| 7048 | TGFBR2 | A015-C-006 | Human | Colorectum | FAP | 8.49e-07 | -2.07e-01 | -0.0994 |
| 7048 | TGFBR2 | A015-C-106 | Human | Colorectum | FAP | 4.31e-02 | -1.07e-01 | -0.0511 |
| 7048 | TGFBR2 | A002-C-114 | Human | Colorectum | FAP | 2.17e-08 | -2.08e-01 | -0.1561 |
| 7048 | TGFBR2 | A015-C-104 | Human | Colorectum | FAP | 8.39e-14 | -3.09e-01 | -0.1899 |
| 7048 | TGFBR2 | A001-C-014 | Human | Colorectum | FAP | 4.63e-03 | 3.74e-02 | 0.0135 |
| 7048 | TGFBR2 | A002-C-016 | Human | Colorectum | FAP | 7.59e-08 | -1.22e-01 | 0.0521 |
| 7048 | TGFBR2 | A015-C-002 | Human | Colorectum | FAP | 1.65e-03 | 1.62e-02 | -0.0763 |
| 7048 | TGFBR2 | A002-C-116 | Human | Colorectum | FAP | 2.83e-13 | -2.22e-01 | -0.0452 |
| 7048 | TGFBR2 | A014-C-008 | Human | Colorectum | FAP | 1.05e-07 | -3.42e-01 | -0.191 |
| 7048 | TGFBR2 | A018-E-020 | Human | Colorectum | FAP | 7.30e-10 | -3.20e-01 | -0.2034 |
| 7048 | TGFBR2 | F034 | Human | Colorectum | FAP | 2.20e-08 | -2.53e-01 | -0.0665 |
| 7048 | TGFBR2 | LZE8T | Human | Esophagus | ESCC | 4.14e-02 | -1.15e-01 | 0.067 |
| Page: 1 2 3 4 5 6 |
| Tissue | Expression Dynamics | Abbreviation |
| Colorectum (GSE201348) |  | FAP: Familial adenomatous polyposis |
| CRC: Colorectal cancer | ||
| Colorectum (HTA11) |  | AD: Adenomas |
| SER: Sessile serrated lesions | ||
| MSI-H: Microsatellite-high colorectal cancer | ||
| MSS: Microsatellite stable colorectal cancer | ||
| Esophagus | 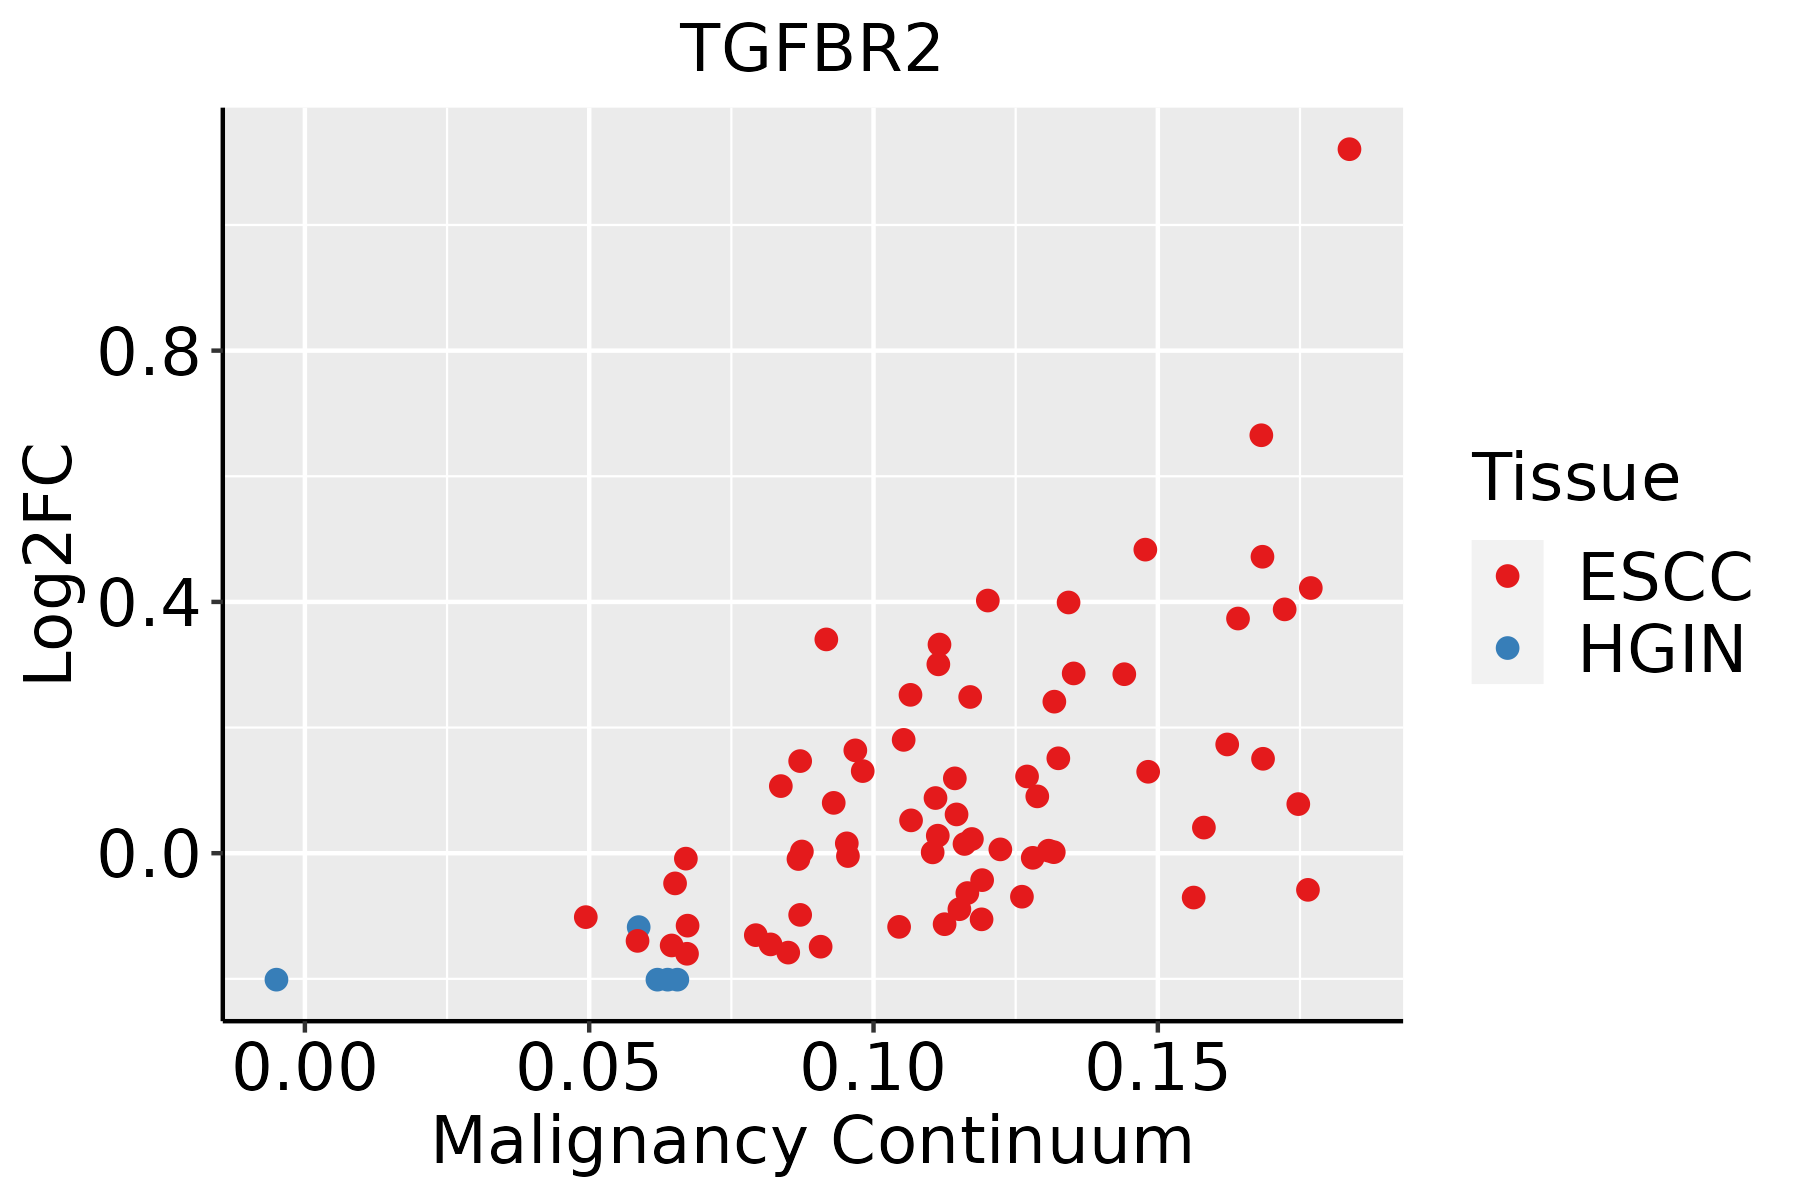 | ESCC: Esophageal squamous cell carcinoma |
| HGIN: High-grade intraepithelial neoplasias | ||
| LGIN: Low-grade intraepithelial neoplasias | ||
| Liver | 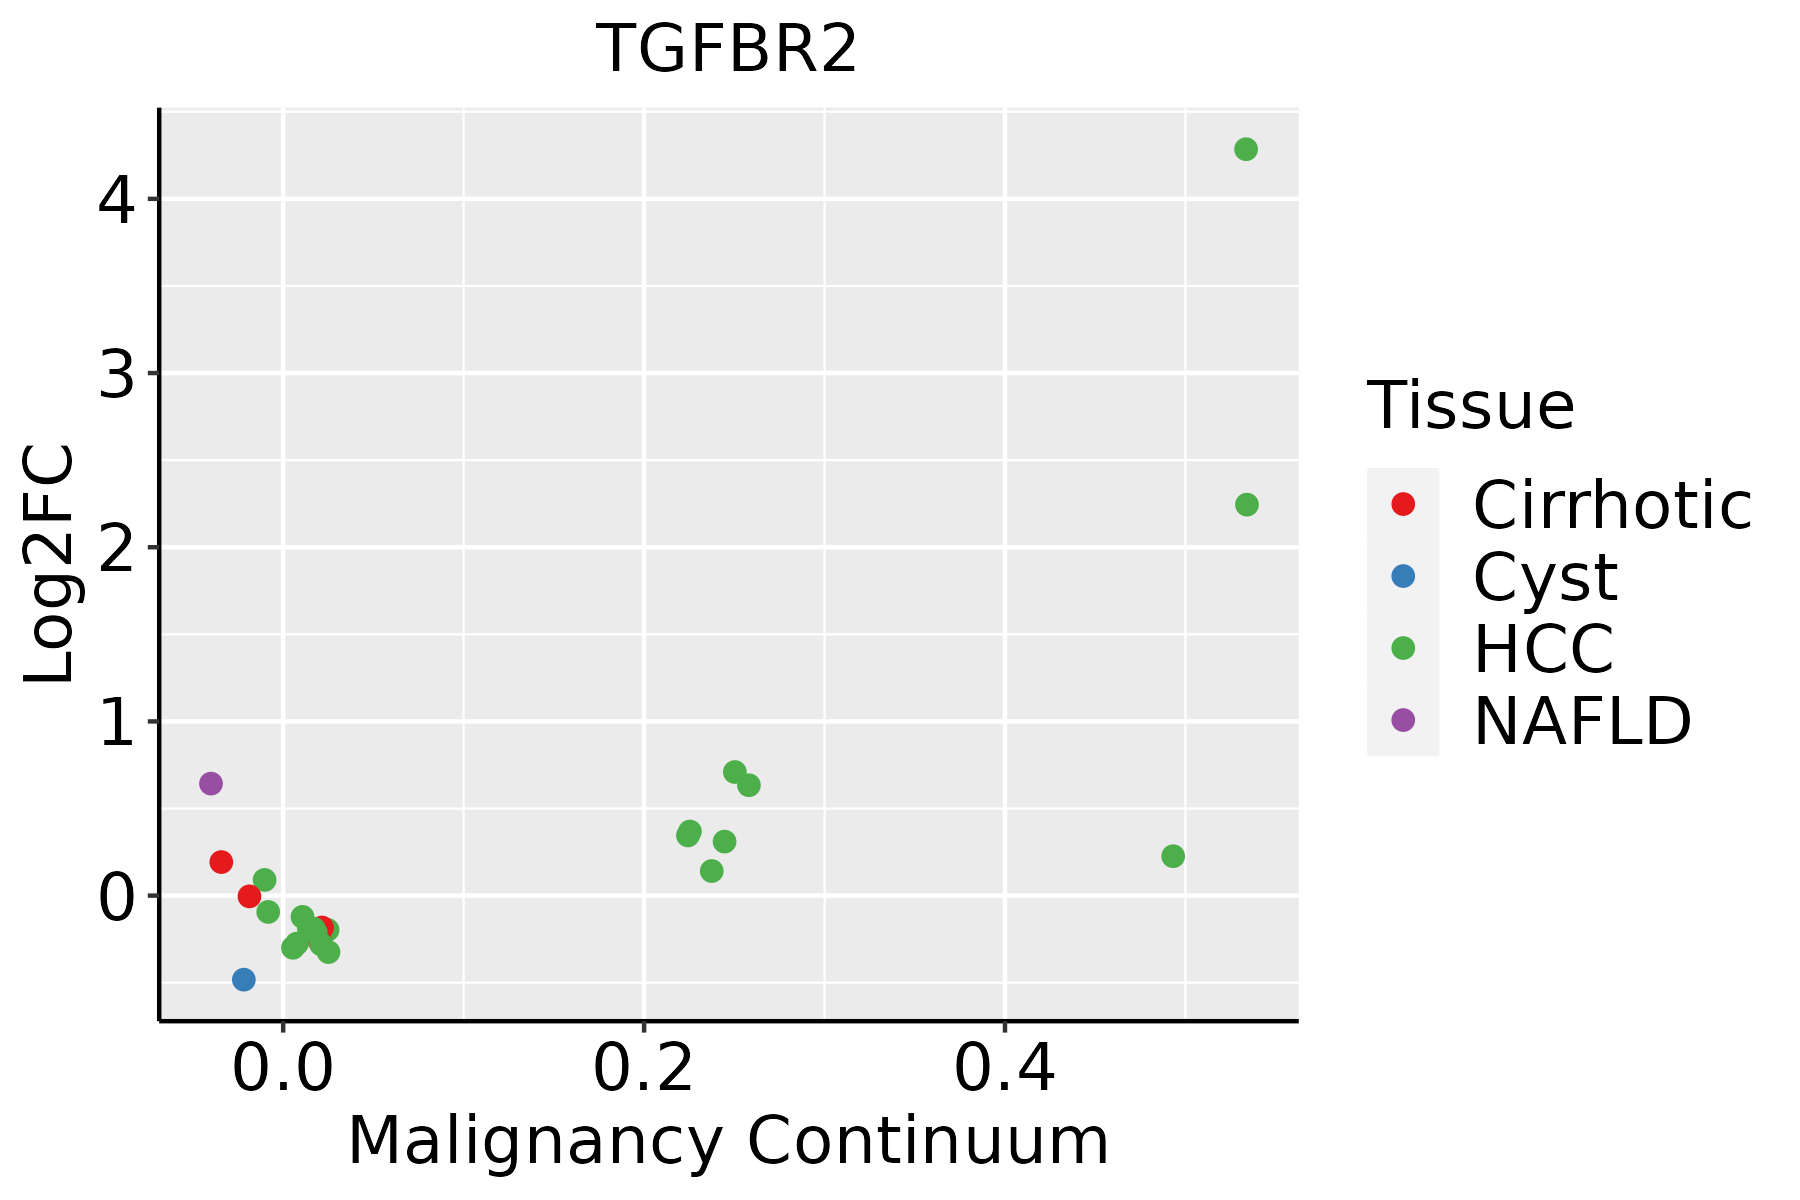 | HCC: Hepatocellular carcinoma |
| NAFLD: Non-alcoholic fatty liver disease | ||
| Oral Cavity |  | EOLP: Erosive Oral lichen planus |
| LP: leukoplakia | ||
| NEOLP: Non-erosive oral lichen planus | ||
| OSCC: Oral squamous cell carcinoma | ||
| Prostate |  | BPH: Benign Prostatic Hyperplasia |
| Thyroid | 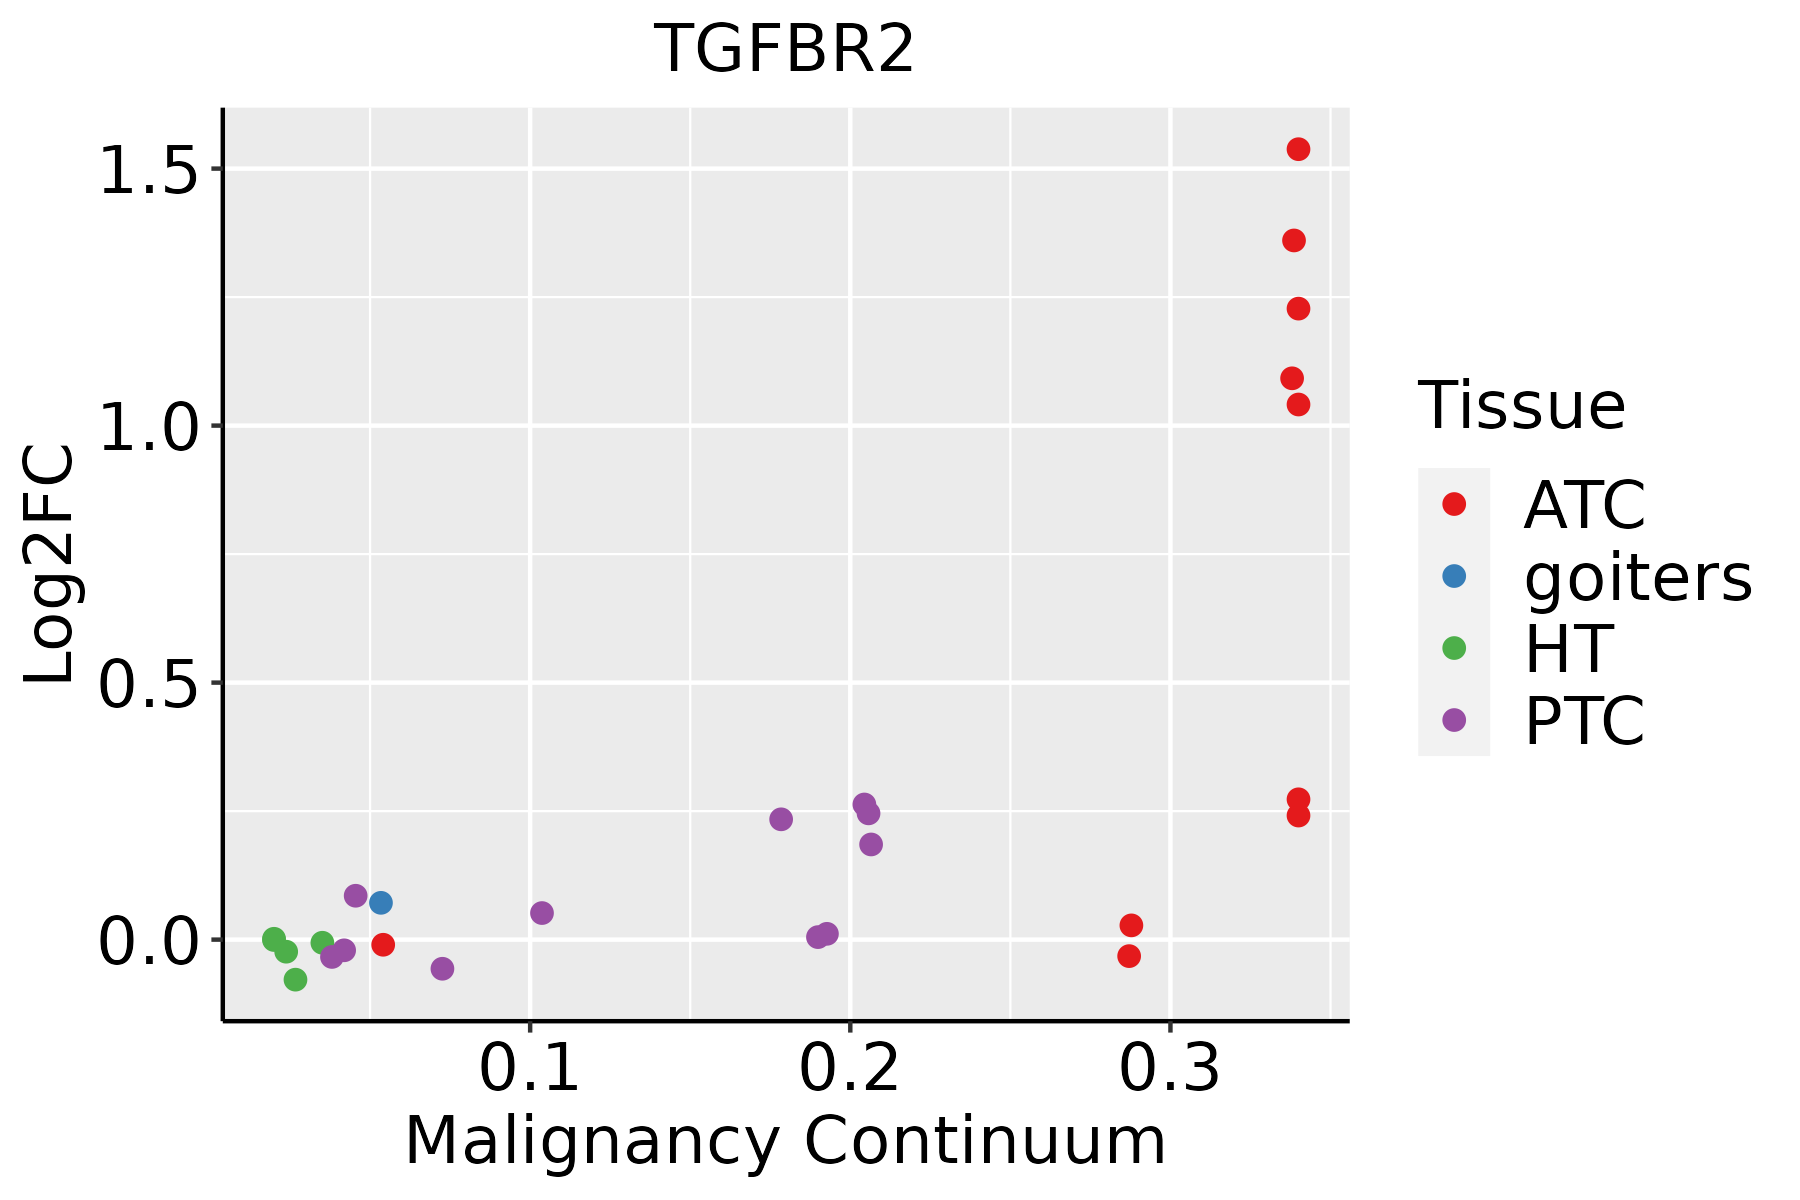 | ATC: Anaplastic thyroid cancer |
| HT: Hashimoto's thyroiditis | ||
| PTC: Papillary thyroid cancer |
| ∗log2FC in expression of this searched gene in stem-like cells from each diseased tissue sample relative to stem-like cells in normal samples in each tissue plotted against the malignancy continuum. Samples are colored based on if they are from different disease stage. |
Top |
Malignant transformation related pathway analysis |
| Find out the enriched GO biological processes and KEGG pathways involved in transition from healthy to precancer to cancer |
| Tissue | Disease Stage | Enriched GO biological Processes |
| Colorectum | AD |  |
| Colorectum | SER |  |
| Colorectum | MSS |  |
| Colorectum | MSI-H |  |
| Colorectum | FAP |  |
| ∗Top 15 enriched GO BP terms are showed in the bar plot of each disease state in each tissue. Each row represents a significant GO biological process which is colored according to the -log10(p.adjust). |
| Page: 1 2 3 4 5 6 7 8 9 |
| GO ID | Tissue | Disease Stage | Description | Gene Ratio | Bg Ratio | pvalue | p.adjust | Count |
| GO:000170110 | Prostate | BPH | in utero embryonic development | 104/3107 | 367/18723 | 9.17e-09 | 3.10e-07 | 104 |
| GO:001063216 | Prostate | BPH | regulation of epithelial cell migration | 87/3107 | 292/18723 | 1.18e-08 | 3.87e-07 | 87 |
| GO:000640316 | Prostate | BPH | RNA localization | 65/3107 | 201/18723 | 2.76e-08 | 8.13e-07 | 65 |
| GO:003367416 | Prostate | BPH | positive regulation of kinase activity | 122/3107 | 467/18723 | 8.59e-08 | 2.14e-06 | 122 |
| GO:00715597 | Prostate | BPH | response to transforming growth factor beta | 76/3107 | 256/18723 | 1.14e-07 | 2.73e-06 | 76 |
| GO:004586010 | Prostate | BPH | positive regulation of protein kinase activity | 104/3107 | 386/18723 | 1.52e-07 | 3.51e-06 | 104 |
| GO:001063416 | Prostate | BPH | positive regulation of epithelial cell migration | 57/3107 | 176/18723 | 1.82e-07 | 4.04e-06 | 57 |
| GO:00017638 | Prostate | BPH | morphogenesis of a branching structure | 61/3107 | 196/18723 | 3.33e-07 | 7.06e-06 | 61 |
| GO:003166718 | Prostate | BPH | response to nutrient levels | 121/3107 | 474/18723 | 3.68e-07 | 7.70e-06 | 121 |
| GO:002261210 | Prostate | BPH | gland morphogenesis | 42/3107 | 118/18723 | 4.36e-07 | 8.87e-06 | 42 |
| GO:00715607 | Prostate | BPH | cellular response to transforming growth factor beta stimulus | 72/3107 | 250/18723 | 8.71e-07 | 1.61e-05 | 72 |
| GO:190370616 | Prostate | BPH | regulation of hemopoiesis | 97/3107 | 367/18723 | 1.01e-06 | 1.83e-05 | 97 |
| GO:00611385 | Prostate | BPH | morphogenesis of a branching epithelium | 56/3107 | 182/18723 | 1.48e-06 | 2.56e-05 | 56 |
| GO:00605628 | Prostate | BPH | epithelial tube morphogenesis | 87/3107 | 325/18723 | 2.05e-06 | 3.39e-05 | 87 |
| GO:00071797 | Prostate | BPH | transforming growth factor beta receptor signaling pathway | 57/3107 | 198/18723 | 1.17e-05 | 1.58e-04 | 57 |
| GO:00459265 | Prostate | BPH | negative regulation of growth | 68/3107 | 249/18723 | 1.26e-05 | 1.69e-04 | 68 |
| GO:00605377 | Prostate | BPH | muscle tissue development | 100/3107 | 403/18723 | 1.35e-05 | 1.76e-04 | 100 |
| GO:002240716 | Prostate | BPH | regulation of cell-cell adhesion | 109/3107 | 448/18723 | 1.43e-05 | 1.85e-04 | 109 |
| GO:00071788 | Prostate | BPH | transmembrane receptor protein serine/threonine kinase signaling pathway | 90/3107 | 355/18723 | 1.48e-05 | 1.90e-04 | 90 |
| GO:00018376 | Prostate | BPH | epithelial to mesenchymal transition | 47/3107 | 157/18723 | 2.21e-05 | 2.67e-04 | 47 |
| Page: 1 2 3 4 5 6 7 8 9 10 11 12 13 14 15 16 17 18 19 20 21 22 23 24 25 26 27 28 29 30 31 32 33 34 35 36 37 38 39 40 41 42 43 44 45 46 47 48 49 50 51 52 53 54 55 56 57 58 |
| Pathway ID | Tissue | Disease Stage | Description | Gene Ratio | Bg Ratio | pvalue | p.adjust | qvalue | Count |
| hsa05415 | Colorectum | AD | Diabetic cardiomyopathy | 114/2092 | 203/8465 | 3.65e-22 | 3.06e-20 | 1.95e-20 | 114 |
| hsa04144 | Colorectum | AD | Endocytosis | 111/2092 | 251/8465 | 5.95e-12 | 1.42e-10 | 9.08e-11 | 111 |
| hsa04520 | Colorectum | AD | Adherens junction | 50/2092 | 93/8465 | 1.52e-09 | 2.83e-08 | 1.81e-08 | 50 |
| hsa05210 | Colorectum | AD | Colorectal cancer | 35/2092 | 86/8465 | 7.54e-04 | 5.49e-03 | 3.50e-03 | 35 |
| hsa05220 | Colorectum | AD | Chronic myeloid leukemia | 31/2092 | 76/8465 | 1.41e-03 | 8.46e-03 | 5.39e-03 | 31 |
| hsa05225 | Colorectum | AD | Hepatocellular carcinoma | 59/2092 | 168/8465 | 1.50e-03 | 8.69e-03 | 5.54e-03 | 59 |
| hsa05166 | Colorectum | AD | Human T-cell leukemia virus 1 infection | 72/2092 | 222/8465 | 5.24e-03 | 2.44e-02 | 1.55e-02 | 72 |
| hsa04218 | Colorectum | AD | Cellular senescence | 53/2092 | 156/8465 | 5.55e-03 | 2.48e-02 | 1.58e-02 | 53 |
| hsa05212 | Colorectum | AD | Pancreatic cancer | 29/2092 | 76/8465 | 6.25e-03 | 2.68e-02 | 1.71e-02 | 29 |
| hsa054151 | Colorectum | AD | Diabetic cardiomyopathy | 114/2092 | 203/8465 | 3.65e-22 | 3.06e-20 | 1.95e-20 | 114 |
| hsa041441 | Colorectum | AD | Endocytosis | 111/2092 | 251/8465 | 5.95e-12 | 1.42e-10 | 9.08e-11 | 111 |
| hsa045201 | Colorectum | AD | Adherens junction | 50/2092 | 93/8465 | 1.52e-09 | 2.83e-08 | 1.81e-08 | 50 |
| hsa052101 | Colorectum | AD | Colorectal cancer | 35/2092 | 86/8465 | 7.54e-04 | 5.49e-03 | 3.50e-03 | 35 |
| hsa052201 | Colorectum | AD | Chronic myeloid leukemia | 31/2092 | 76/8465 | 1.41e-03 | 8.46e-03 | 5.39e-03 | 31 |
| hsa052251 | Colorectum | AD | Hepatocellular carcinoma | 59/2092 | 168/8465 | 1.50e-03 | 8.69e-03 | 5.54e-03 | 59 |
| hsa051661 | Colorectum | AD | Human T-cell leukemia virus 1 infection | 72/2092 | 222/8465 | 5.24e-03 | 2.44e-02 | 1.55e-02 | 72 |
| hsa042181 | Colorectum | AD | Cellular senescence | 53/2092 | 156/8465 | 5.55e-03 | 2.48e-02 | 1.58e-02 | 53 |
| hsa052121 | Colorectum | AD | Pancreatic cancer | 29/2092 | 76/8465 | 6.25e-03 | 2.68e-02 | 1.71e-02 | 29 |
| hsa054154 | Colorectum | MSS | Diabetic cardiomyopathy | 106/1875 | 203/8465 | 2.47e-21 | 1.62e-19 | 9.92e-20 | 106 |
| hsa041444 | Colorectum | MSS | Endocytosis | 102/1875 | 251/8465 | 1.85e-11 | 4.43e-10 | 2.71e-10 | 102 |
| Page: 1 2 3 4 5 6 7 8 9 10 11 12 13 14 15 |
Top |
Cell-cell communication analysis |
| Identification of potential cell-cell interactions between two cell types and their ligand-receptor pairs for different disease states |
| Ligand | Receptor | LRpair | Pathway | Tissue | Disease Stage |
| GDF15 | TGFBR2 | GDF15_TGFBR2 | GDF | Breast | ADJ |
| GDF15 | TGFBR2 | GDF15_TGFBR2 | GDF | Breast | Healthy |
| GDF15 | TGFBR2 | GDF15_TGFBR2 | GDF | Breast | Precancer |
| TGFB1 | ACVR1B_TGFbR2 | TGFB1_ACVR1B_TGFBR2 | TGFb | CRC | AD |
| GDF15 | TGFBR2 | GDF15_TGFBR2 | GDF | CRC | AD |
| TGFB1 | ACVR1B_TGFbR2 | TGFB1_ACVR1B_TGFBR2 | TGFb | CRC | CRC |
| TGFB1 | ACVR1C_TGFbR2 | TGFB1_ACVR1C_TGFBR2 | TGFb | CRC | CRC |
| GDF15 | TGFBR2 | GDF15_TGFBR2 | GDF | CRC | MSI-H |
| TGFB1 | ACVR1B_TGFbR2 | TGFB1_ACVR1B_TGFBR2 | TGFb | CRC | MSI-H |
| GDF15 | TGFBR2 | GDF15_TGFBR2 | GDF | CRC | MSS |
| GDF15 | TGFBR2 | GDF15_TGFBR2 | GDF | Endometrium | AEH |
| TGFB1 | ACVR1B_TGFbR2 | TGFB1_ACVR1B_TGFBR2 | TGFb | Endometrium | AEH |
| GDF15 | TGFBR2 | GDF15_TGFBR2 | GDF | Endometrium | EEC |
| GDF15 | TGFBR2 | GDF15_TGFBR2 | GDF | Endometrium | Healthy |
| GDF15 | TGFBR2 | GDF15_TGFBR2 | GDF | Esophagus | ESCC |
| GDF15 | TGFBR2 | GDF15_TGFBR2 | GDF | GC | Healthy |
| GDF15 | TGFBR2 | GDF15_TGFBR2 | GDF | HNSCC | ADJ |
| GDF15 | TGFBR2 | GDF15_TGFBR2 | GDF | Liver | HCC |
| TGFB1 | ACVR1B_TGFbR2 | TGFB1_ACVR1B_TGFBR2 | TGFb | Liver | Healthy |
| TGFB1 | ACVR1B_TGFbR2 | TGFB1_ACVR1B_TGFBR2 | TGFb | Liver | Precancer |
| Page: 1 |
Top |
Single-cell gene regulatory network inference analysis |
| Find out the significant the regulons (TFs) and the target genes of each regulon across cell types for different disease states |
| TF | Cell Type | Tissue | Disease Stage | Target Gene | RSS | Regulon Activity |
| ∗The dot plots of a searched regulon are shown for all cell subpopulations in each disease state of each tissue based on the regulon specific score inferred using pySCENIC and by calculating the average expression. |
| Page: 1 |
Top |
Somatic mutation of malignant transformation related genes |
| Annotation of somatic variants for genes involved in malignant transformation |
| Hugo Symbol | Variant Class | Variant Classification | dbSNP RS | HGVSc | HGVSp | HGVSp Short | SWISSPROT | BIOTYPE | SIFT | PolyPhen | Tumor Sample Barcode | Tissue | Histology | Sex | Age | Stage | Therapy Types | Drugs | Outcome |
| TGFBR2 | SNV | Missense_Mutation | c.1528G>A | p.Glu510Lys | p.E510K | P37173 | protein_coding | deleterious(0) | probably_damaging(0.993) | TCGA-AR-A1AP-01 | Breast | breast invasive carcinoma | Female | >=65 | I/II | Hormone Therapy | anastrozole | SD | |
| TGFBR2 | SNV | Missense_Mutation | c.382G>A | p.Asp128Asn | p.D128N | P37173 | protein_coding | tolerated(0.83) | benign(0.061) | TCGA-BH-A0B5-01 | Breast | breast invasive carcinoma | Female | <65 | III/IV | Chemotherapy | adriamycin | CR | |
| TGFBR2 | SNV | Missense_Mutation | novel | c.673A>G | p.Thr225Ala | p.T225A | P37173 | protein_coding | tolerated(0.89) | benign(0) | TCGA-LL-A50Y-01 | Breast | breast invasive carcinoma | Female | >=65 | I/II | Hormone Therapy | arimidex | CR |
| TGFBR2 | SNV | Missense_Mutation | c.1559N>A | p.Arg520Gln | p.R520Q | P37173 | protein_coding | deleterious(0) | probably_damaging(0.998) | TCGA-LL-A9Q3-01 | Breast | breast invasive carcinoma | Female | >=65 | III/IV | Immunotherapy | herceptin | CR | |
| TGFBR2 | insertion | Nonsense_Mutation | novel | c.939_940insTTGCAGTGAGCAGAGATCGTGCCATTGCACTGCTGCCTGGGTA | p.Thr314LeufsTer3 | p.T314Lfs*3 | P37173 | protein_coding | TCGA-AN-A04A-01 | Breast | breast invasive carcinoma | Female | <65 | III/IV | Unknown | Unknown | SD | ||
| TGFBR2 | SNV | Missense_Mutation | novel | c.116A>C | p.Lys39Thr | p.K39T | P37173 | protein_coding | tolerated_low_confidence(0.15) | benign(0.026) | TCGA-2W-A8YY-01 | Cervix | cervical & endocervical cancer | Female | <65 | I/II | Chemotherapy | cisplatin | CR |
| TGFBR2 | SNV | Missense_Mutation | rs886039551 | c.1411N>A | p.Asp471Asn | p.D471N | P37173 | protein_coding | deleterious(0) | probably_damaging(1) | TCGA-DS-A5RQ-01 | Cervix | cervical & endocervical cancer | Female | >=65 | I/II | Chemotherapy | cisplatin | CR |
| TGFBR2 | SNV | Missense_Mutation | c.1664N>T | p.Thr555Ile | p.T555I | P37173 | protein_coding | deleterious(0) | probably_damaging(1) | TCGA-EK-A2RE-01 | Cervix | cervical & endocervical cancer | Female | <65 | I/II | Unknown | Unknown | SD | |
| TGFBR2 | SNV | Missense_Mutation | c.1393G>A | p.Glu465Lys | p.E465K | P37173 | protein_coding | deleterious(0) | probably_damaging(0.999) | TCGA-Q1-A73O-01 | Cervix | cervical & endocervical cancer | Female | <65 | I/II | Chemotherapy | cisplatin | CR | |
| TGFBR2 | SNV | Missense_Mutation | rs104893809 | c.1684C>T | p.Arg562Cys | p.R562C | P37173 | protein_coding | deleterious(0) | probably_damaging(1) | TCGA-VS-A8QM-01 | Cervix | cervical & endocervical cancer | Female | <65 | I/II | Chemotherapy | cisplatin | PD |
| Page: 1 2 3 4 5 6 7 8 9 10 |
Top |
Related drugs of malignant transformation related genes |
| Identification of chemicals and drugs interact with genes involved in malignant transfromation |
| (DGIdb 4.0) |
| Entrez ID | Symbol | Category | Interaction Types | Drug Claim Name | Drug Name | PMIDs |
| 7048 | TGFBR2 | KINASE, SERINE THREONINE KINASE, DRUGGABLE GENOME, CLINICALLY ACTIONABLE, EXTERNAL SIDE OF PLASMA MEMBRANE, ENZYME | agonist | 178101755 | ||
| 7048 | TGFBR2 | KINASE, SERINE THREONINE KINASE, DRUGGABLE GENOME, CLINICALLY ACTIONABLE, EXTERNAL SIDE OF PLASMA MEMBRANE, ENZYME | TGF-BR2 mab | |||
| 7048 | TGFBR2 | KINASE, SERINE THREONINE KINASE, DRUGGABLE GENOME, CLINICALLY ACTIONABLE, EXTERNAL SIDE OF PLASMA MEMBRANE, ENZYME | TG-C | |||
| 7048 | TGFBR2 | KINASE, SERINE THREONINE KINASE, DRUGGABLE GENOME, CLINICALLY ACTIONABLE, EXTERNAL SIDE OF PLASMA MEMBRANE, ENZYME | inhibitor | 249565755 | ||
| 7048 | TGFBR2 | KINASE, SERINE THREONINE KINASE, DRUGGABLE GENOME, CLINICALLY ACTIONABLE, EXTERNAL SIDE OF PLASMA MEMBRANE, ENZYME | inhibitor | 249565835 | ||
| 7048 | TGFBR2 | KINASE, SERINE THREONINE KINASE, DRUGGABLE GENOME, CLINICALLY ACTIONABLE, EXTERNAL SIDE OF PLASMA MEMBRANE, ENZYME | agonist | 348353672 | ||
| 7048 | TGFBR2 | KINASE, SERINE THREONINE KINASE, DRUGGABLE GENOME, CLINICALLY ACTIONABLE, EXTERNAL SIDE OF PLASMA MEMBRANE, ENZYME | irinotecan | IRINOTECAN | 27160286 | |
| 7048 | TGFBR2 | KINASE, SERINE THREONINE KINASE, DRUGGABLE GENOME, CLINICALLY ACTIONABLE, EXTERNAL SIDE OF PLASMA MEMBRANE, ENZYME | inhibitor | 249565874 | ||
| 7048 | TGFBR2 | KINASE, SERINE THREONINE KINASE, DRUGGABLE GENOME, CLINICALLY ACTIONABLE, EXTERNAL SIDE OF PLASMA MEMBRANE, ENZYME | inhibitor | 223366128 | GALUNISERTIB | |
| 7048 | TGFBR2 | KINASE, SERINE THREONINE KINASE, DRUGGABLE GENOME, CLINICALLY ACTIONABLE, EXTERNAL SIDE OF PLASMA MEMBRANE, ENZYME | inhibitor | 249565800 |
| Page: 1 2 |

Copyright 2023-Present -The University of Texas Health Science Center at Houston |