
|
|||||
|
 | |
| |
| |
| |
| |
| |
|
Gene: SOX4 |
Gene summary for SOX4 |
| Gene information | Species | Human | Gene symbol | SOX4 | Gene ID | 6659 |
| Gene name | SRY-box transcription factor 4 | |
| Gene Alias | CSS10 | |
| Cytomap | 6p22.3 | |
| Gene Type | protein-coding | GO ID | GO:0000075 | UniProtAcc | Q06945 |
Top |
Malignant transformation analysis |
| Identification of the aberrant gene expression in precancerous and cancerous lesions by comparing the gene expression of stem-like cells in diseased tissues with normal stem cells |
| Entrez ID | Symbol | Replicates | Species | Organ | Tissue | Adj P-value | Log2FC | Malignancy |
| 6659 | SOX4 | GSM4909280 | Human | Breast | Precancer | 3.15e-02 | 2.05e-01 | 0.0305 |
| 6659 | SOX4 | GSM4909281 | Human | Breast | IDC | 1.62e-19 | 4.90e-01 | 0.21 |
| 6659 | SOX4 | GSM4909282 | Human | Breast | IDC | 5.35e-05 | 3.25e-01 | -0.0288 |
| 6659 | SOX4 | GSM4909285 | Human | Breast | IDC | 1.84e-09 | 3.15e-01 | 0.21 |
| 6659 | SOX4 | GSM4909286 | Human | Breast | IDC | 4.56e-33 | 5.72e-01 | 0.1081 |
| 6659 | SOX4 | GSM4909293 | Human | Breast | IDC | 3.76e-03 | 1.30e-01 | 0.1581 |
| 6659 | SOX4 | GSM4909294 | Human | Breast | IDC | 4.88e-06 | -4.46e-01 | 0.2022 |
| 6659 | SOX4 | GSM4909296 | Human | Breast | IDC | 8.39e-03 | 7.04e-02 | 0.1524 |
| 6659 | SOX4 | GSM4909297 | Human | Breast | IDC | 1.63e-10 | -4.43e-02 | 0.1517 |
| 6659 | SOX4 | GSM4909302 | Human | Breast | IDC | 1.25e-13 | -5.79e-01 | 0.1545 |
| 6659 | SOX4 | GSM4909304 | Human | Breast | IDC | 9.88e-04 | -2.44e-01 | 0.1636 |
| 6659 | SOX4 | GSM4909311 | Human | Breast | IDC | 3.84e-33 | -3.33e-01 | 0.1534 |
| 6659 | SOX4 | GSM4909313 | Human | Breast | IDC | 2.12e-05 | 2.96e-01 | 0.0391 |
| 6659 | SOX4 | GSM4909315 | Human | Breast | IDC | 2.72e-12 | 1.93e-01 | 0.21 |
| 6659 | SOX4 | GSM4909316 | Human | Breast | IDC | 5.26e-04 | -3.50e-01 | 0.21 |
| 6659 | SOX4 | GSM4909317 | Human | Breast | IDC | 4.98e-07 | 3.98e-01 | 0.1355 |
| 6659 | SOX4 | GSM4909319 | Human | Breast | IDC | 1.32e-48 | -8.41e-01 | 0.1563 |
| 6659 | SOX4 | GSM4909320 | Human | Breast | IDC | 3.57e-02 | 1.83e-01 | 0.1575 |
| 6659 | SOX4 | GSM4909321 | Human | Breast | IDC | 5.88e-05 | -4.46e-02 | 0.1559 |
| 6659 | SOX4 | ctrl6 | Human | Breast | Precancer | 3.33e-12 | 5.34e-01 | -0.0061 |
| Page: 1 2 3 4 5 6 7 8 9 10 11 12 13 14 |
| Tissue | Expression Dynamics | Abbreviation |
| Breast | 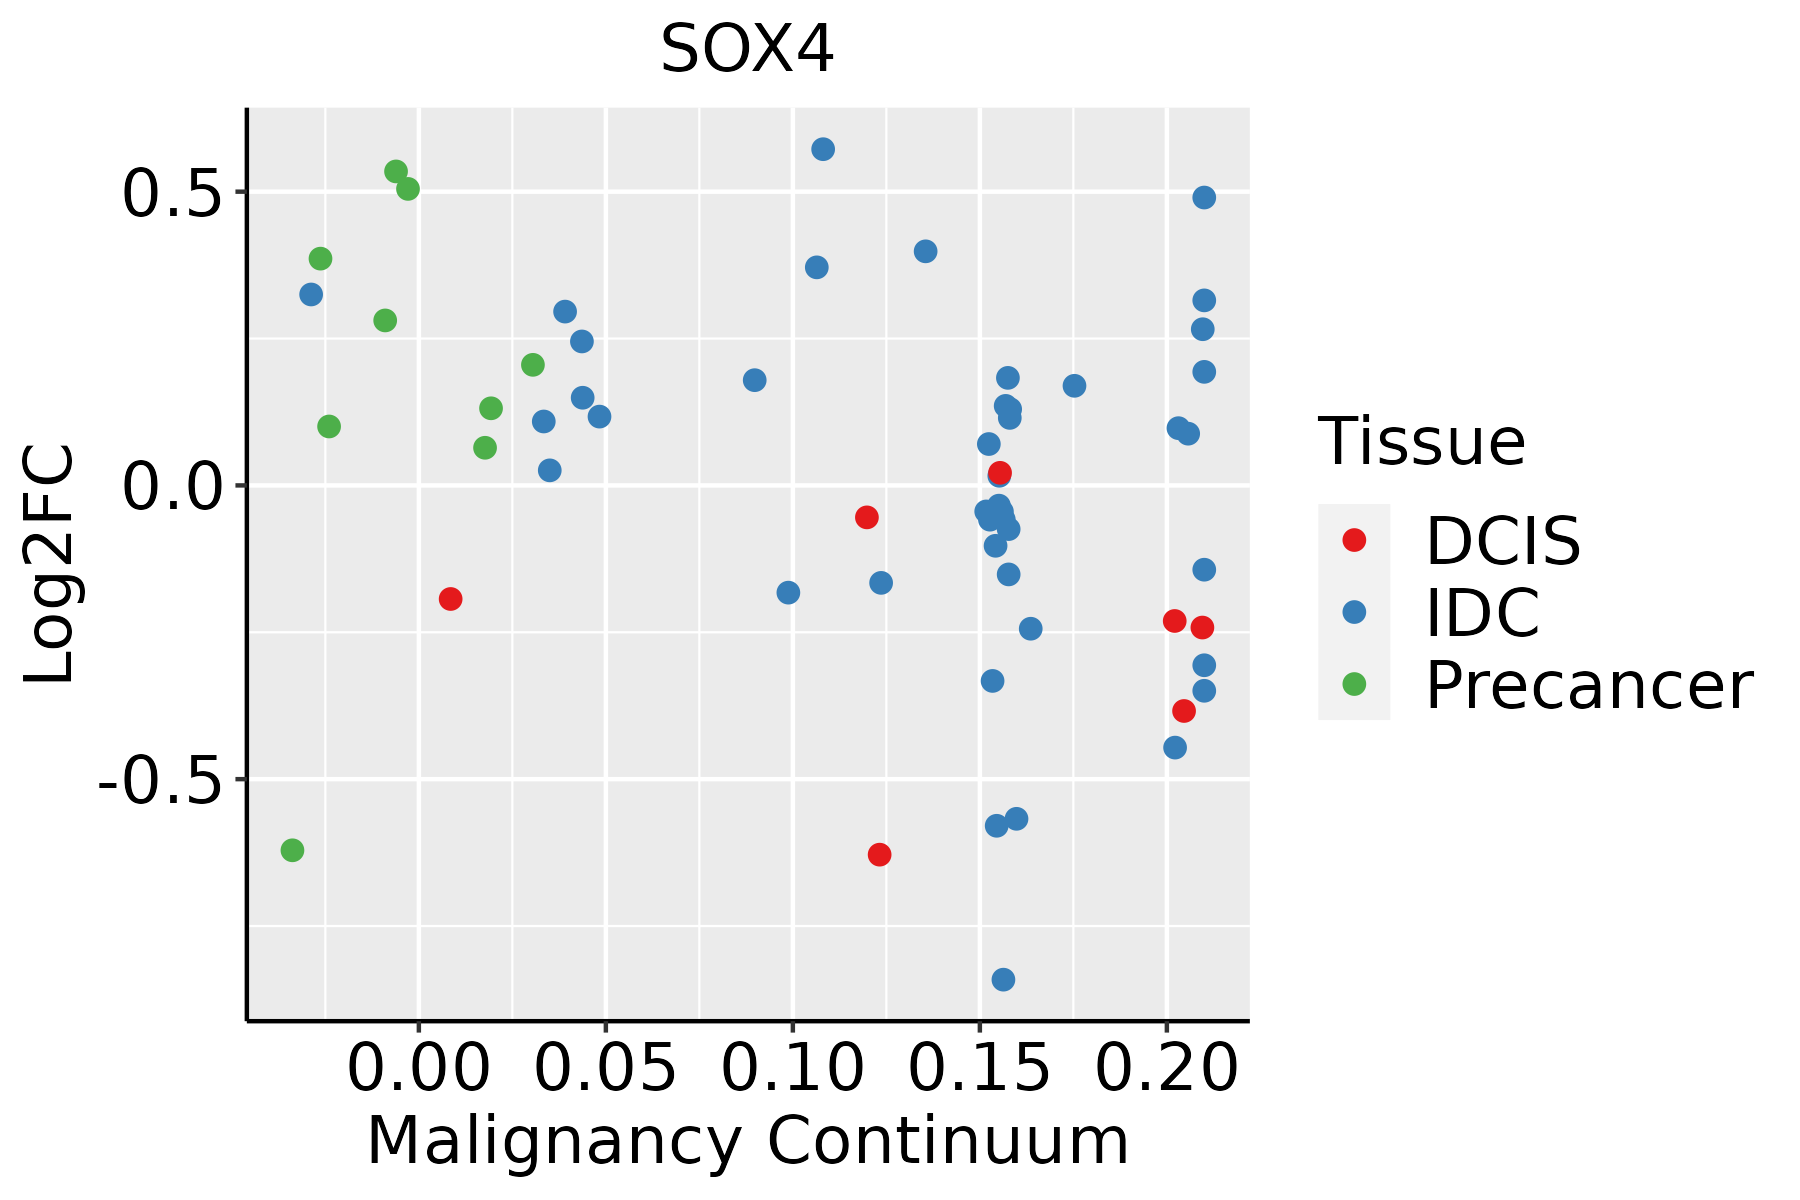 | IDC: Invasive ductal carcinoma |
| DCIS: Ductal carcinoma in situ | ||
| Precancer(BRCA1-mut): Precancerous lesion from BRCA1 mutation carriers | ||
| Colorectum (GSE201348) | 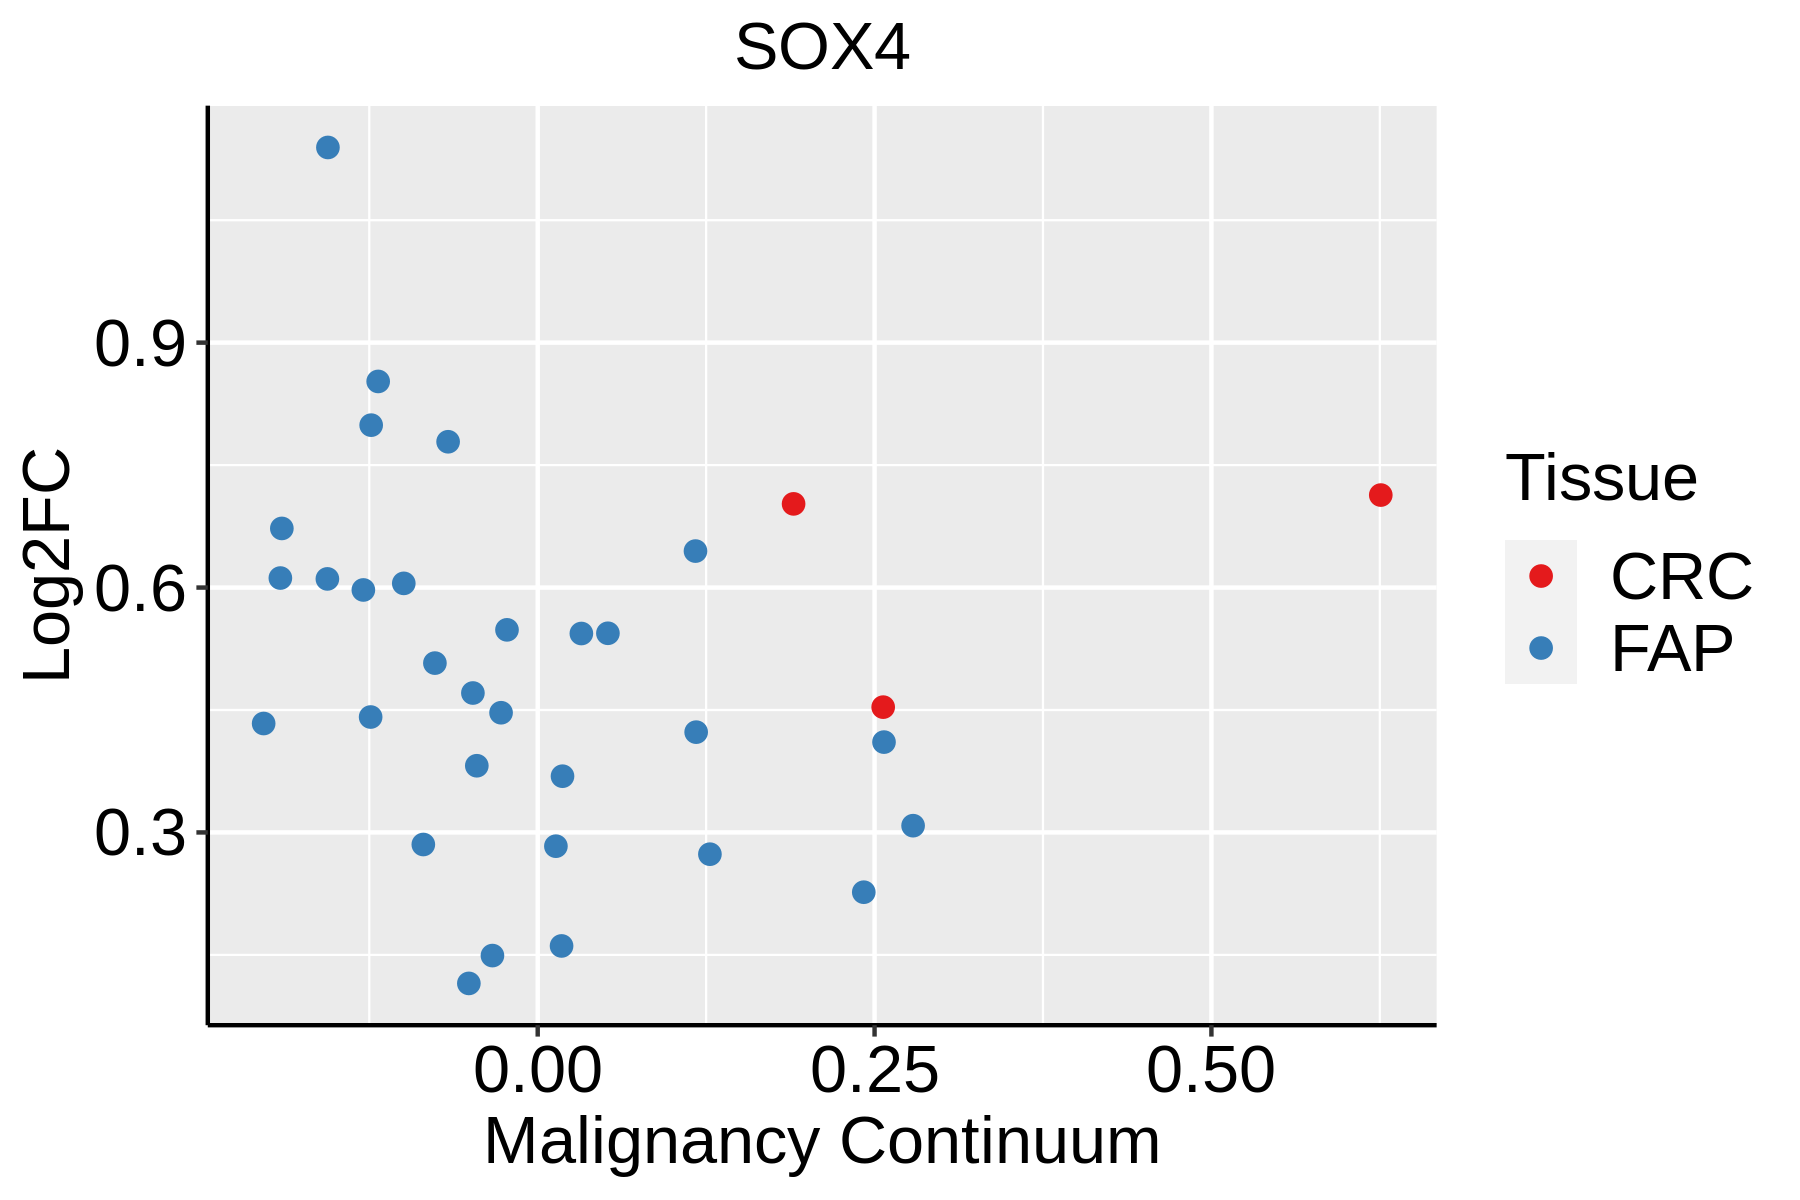 | FAP: Familial adenomatous polyposis |
| CRC: Colorectal cancer | ||
| Colorectum (HTA11) |  | AD: Adenomas |
| SER: Sessile serrated lesions | ||
| MSI-H: Microsatellite-high colorectal cancer | ||
| MSS: Microsatellite stable colorectal cancer | ||
| Endometrium | 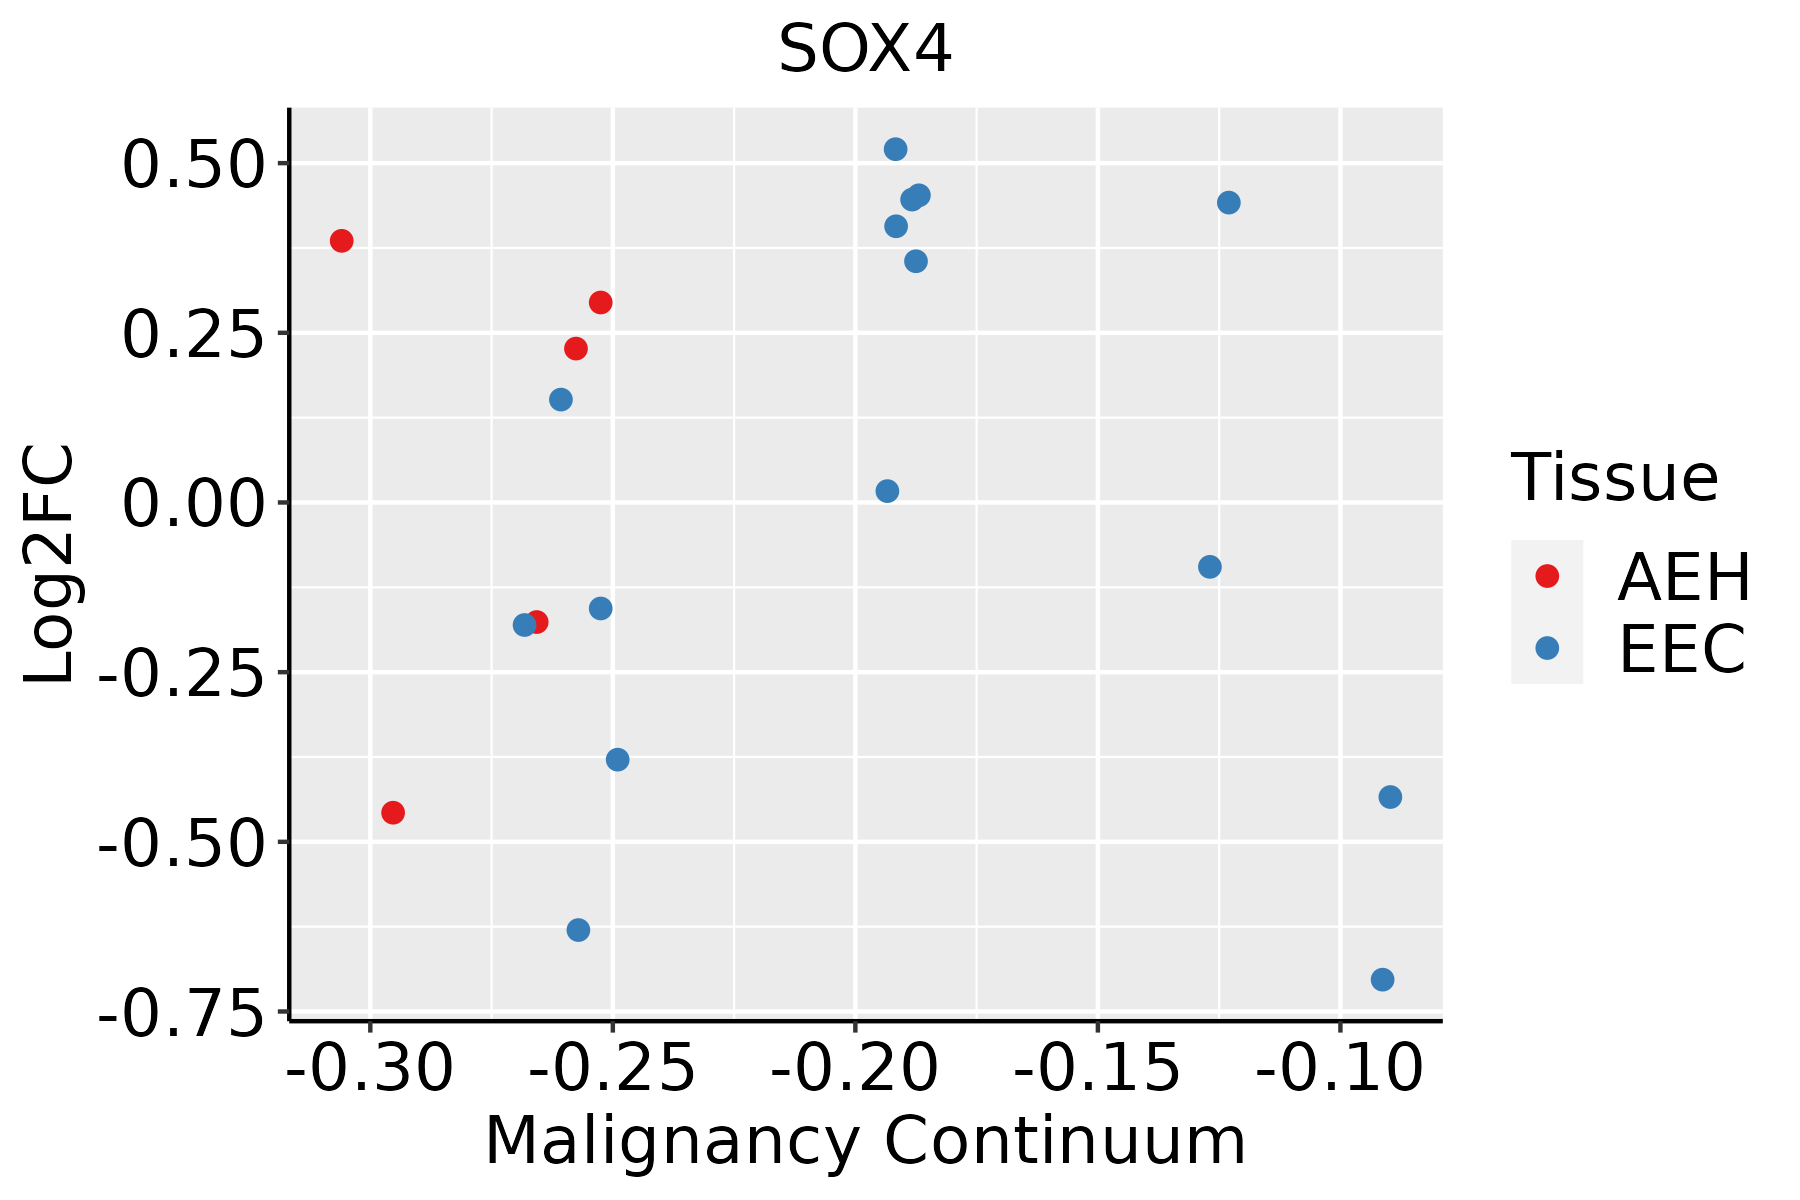 | AEH: Atypical endometrial hyperplasia |
| EEC: Endometrioid Cancer | ||
| Esophagus | 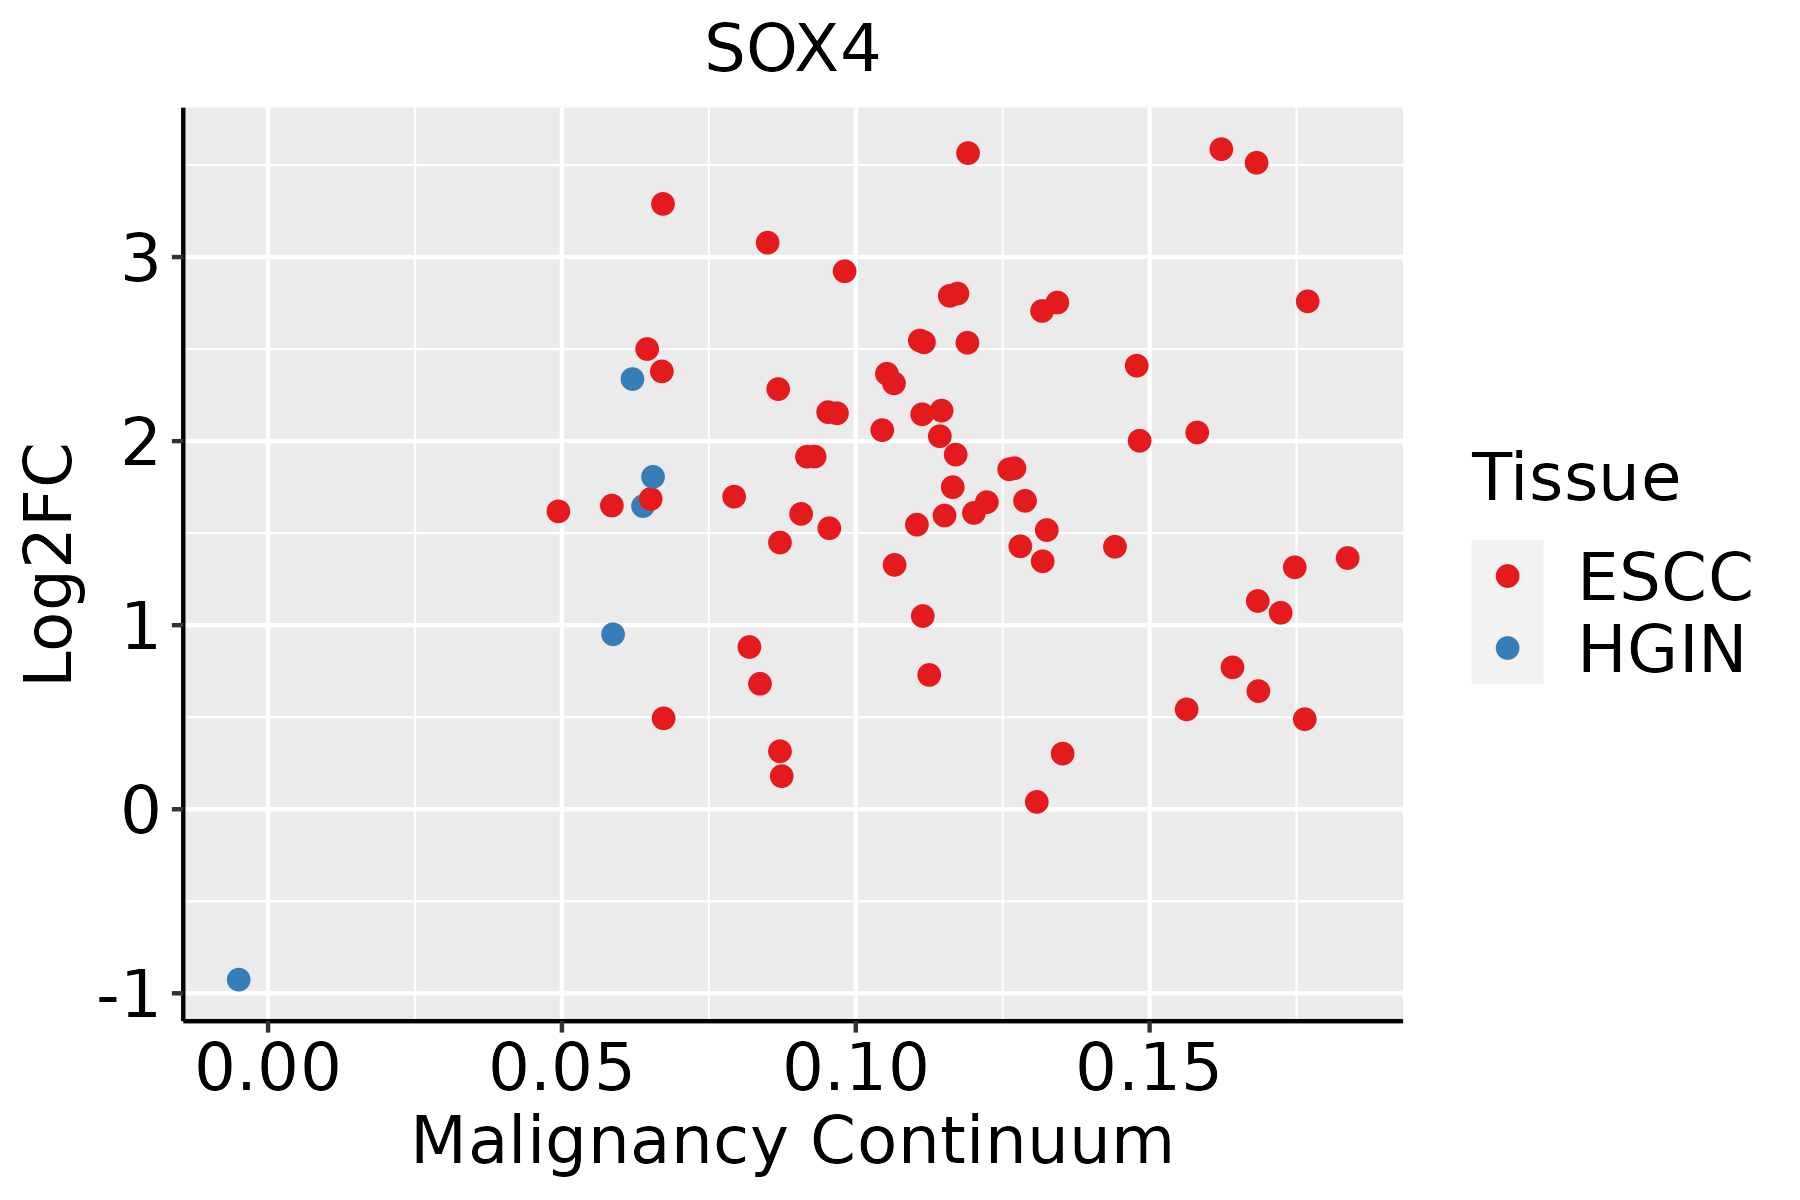 | ESCC: Esophageal squamous cell carcinoma |
| HGIN: High-grade intraepithelial neoplasias | ||
| LGIN: Low-grade intraepithelial neoplasias | ||
| GC |  | CAG: Chronic atrophic gastritis |
| CAG with IM: Chronic atrophic gastritis with intestinal metaplasia | ||
| CSG: Chronic superficial gastritis | ||
| GC: Gastric cancer | ||
| SIM: Severe intestinal metaplasia | ||
| WIM: Wild intestinal metaplasia | ||
| Liver |  | HCC: Hepatocellular carcinoma |
| NAFLD: Non-alcoholic fatty liver disease | ||
| Lung |  | AAH: Atypical adenomatous hyperplasia |
| AIS: Adenocarcinoma in situ | ||
| IAC: Invasive lung adenocarcinoma | ||
| MIA: Minimally invasive adenocarcinoma | ||
| Oral Cavity |  | EOLP: Erosive Oral lichen planus |
| LP: leukoplakia | ||
| NEOLP: Non-erosive oral lichen planus | ||
| OSCC: Oral squamous cell carcinoma | ||
| Prostate | 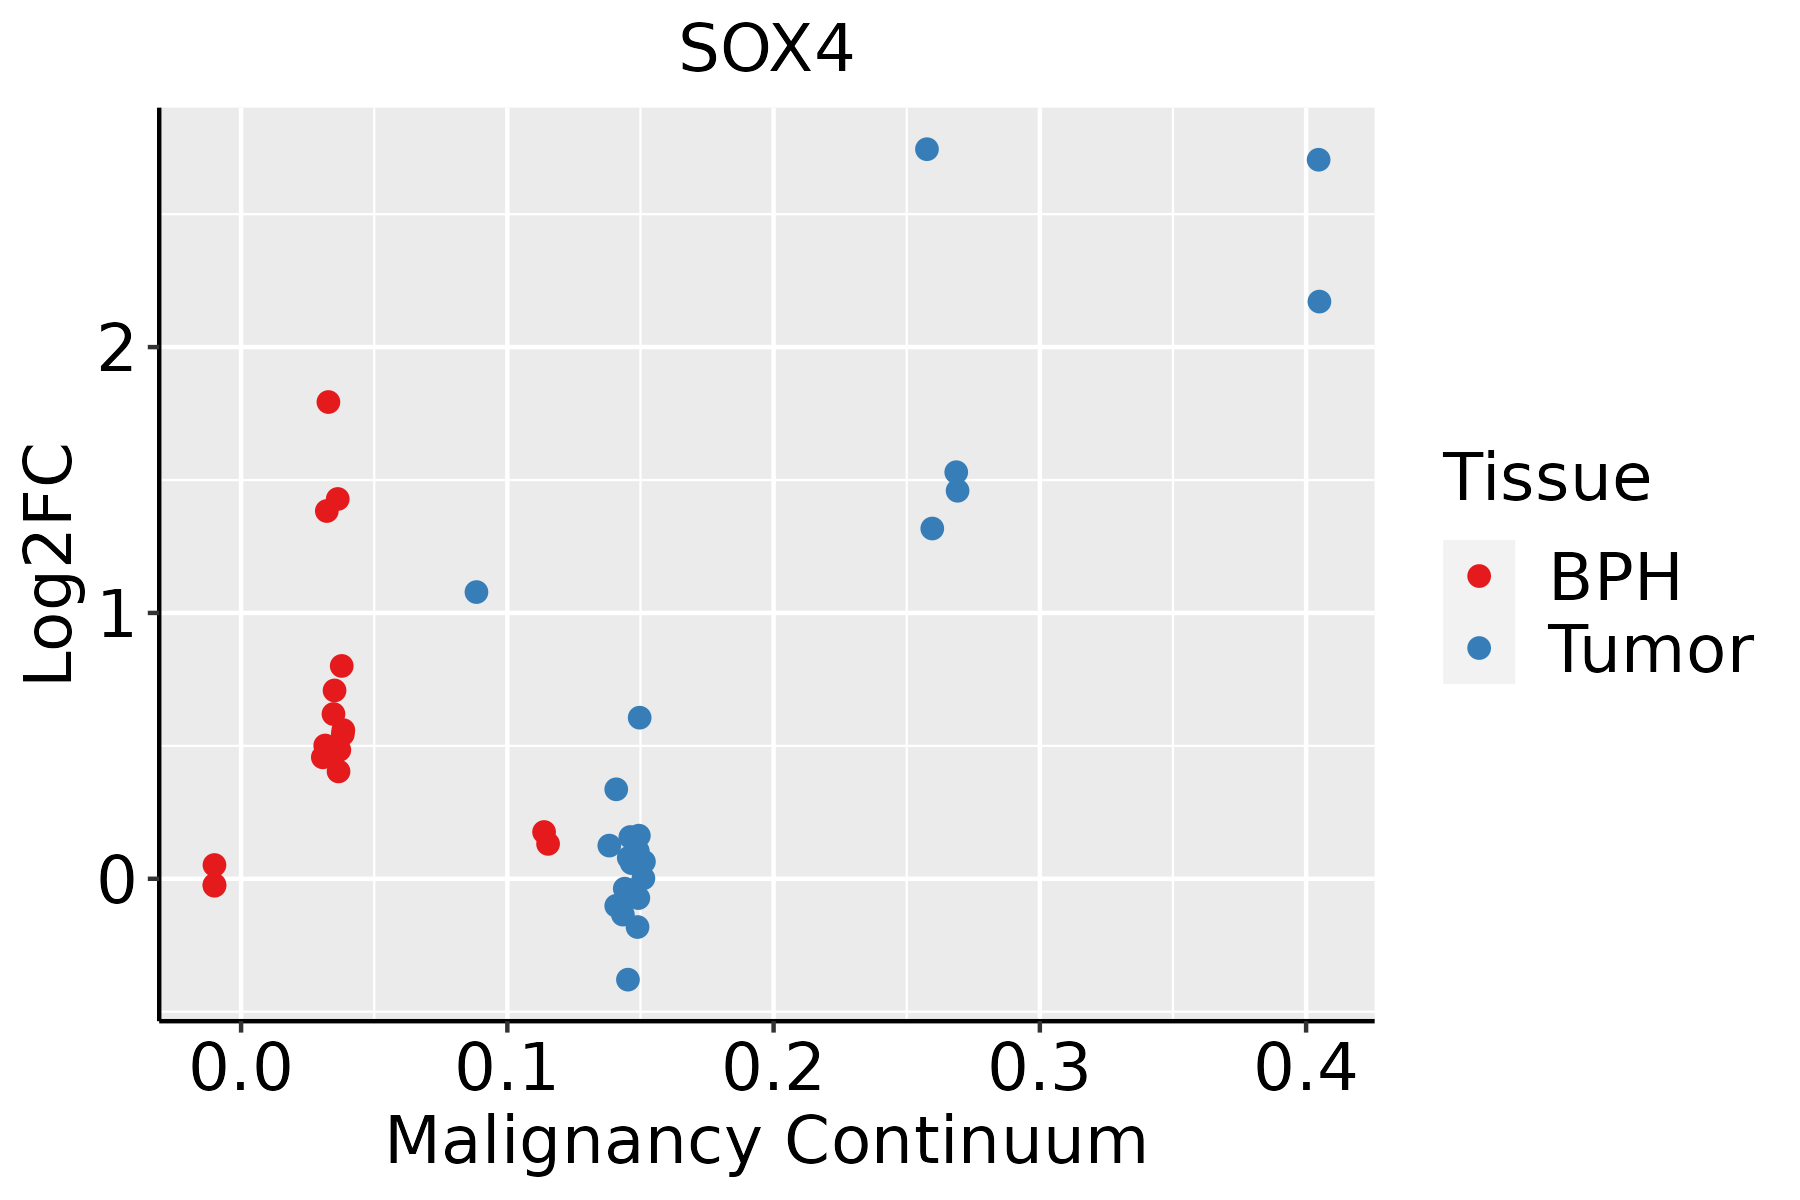 | BPH: Benign Prostatic Hyperplasia |
| Skin |  | AK: Actinic keratosis |
| cSCC: Cutaneous squamous cell carcinoma | ||
| SCCIS:squamous cell carcinoma in situ | ||
| Thyroid | 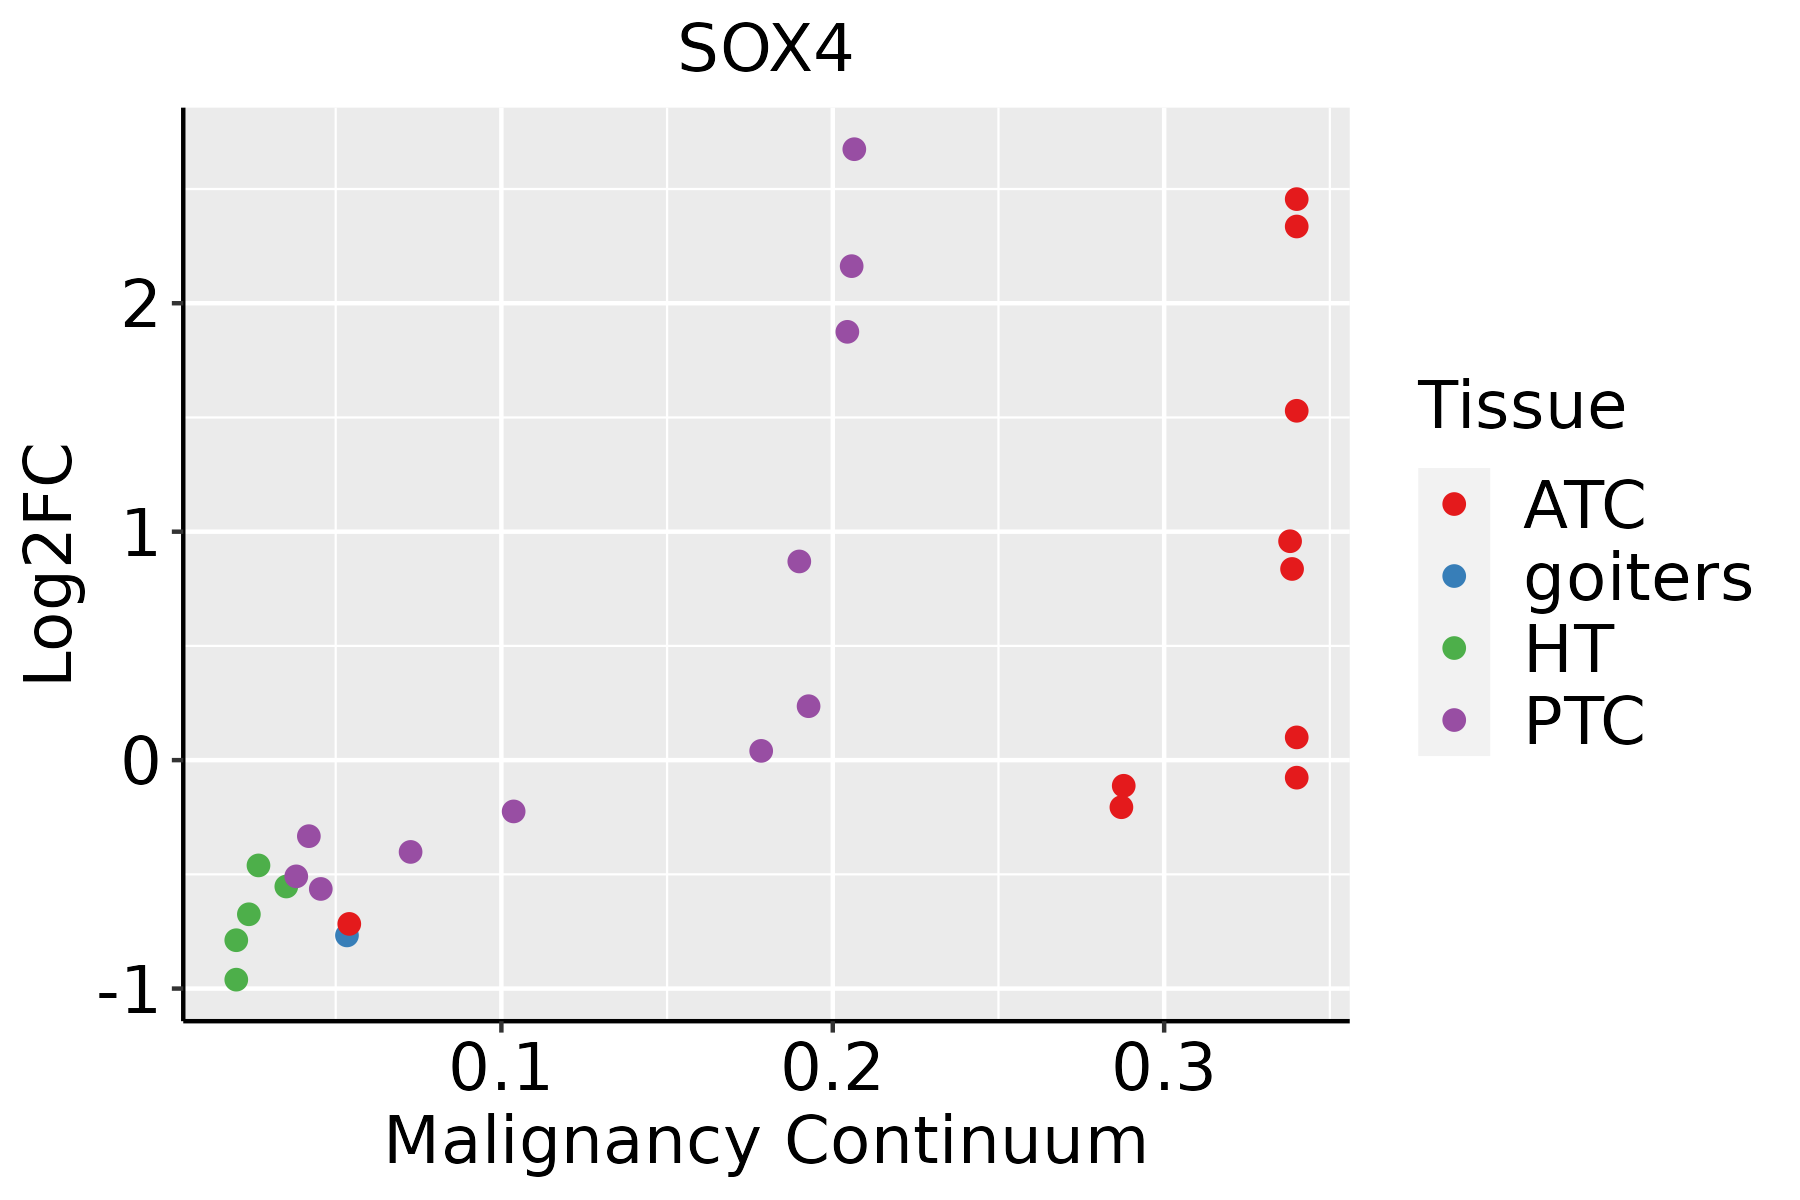 | ATC: Anaplastic thyroid cancer |
| HT: Hashimoto's thyroiditis | ||
| PTC: Papillary thyroid cancer |
| ∗log2FC in expression of this searched gene in stem-like cells from each diseased tissue sample relative to stem-like cells in normal samples in each tissue plotted against the malignancy continuum. Samples are colored based on if they are from different disease stage. |
Top |
Malignant transformation related pathway analysis |
| Find out the enriched GO biological processes and KEGG pathways involved in transition from healthy to precancer to cancer |
| Tissue | Disease Stage | Enriched GO biological Processes |
| Colorectum | AD |  |
| Colorectum | SER |  |
| Colorectum | MSS |  |
| Colorectum | MSI-H |  |
| Colorectum | FAP |  |
| ∗Top 15 enriched GO BP terms are showed in the bar plot of each disease state in each tissue. Each row represents a significant GO biological process which is colored according to the -log10(p.adjust). |
| Page: 1 2 3 4 5 6 7 8 9 |
| GO ID | Tissue | Disease Stage | Description | Gene Ratio | Bg Ratio | pvalue | p.adjust | Count |
| GO:001982714 | Esophagus | ESCC | stem cell population maintenance | 88/8552 | 131/18723 | 5.23e-07 | 6.97e-06 | 88 |
| GO:003011117 | Esophagus | ESCC | regulation of Wnt signaling pathway | 194/8552 | 328/18723 | 5.39e-07 | 7.14e-06 | 194 |
| GO:004484314 | Esophagus | ESCC | cell cycle G1/S phase transition | 148/8552 | 241/18723 | 5.68e-07 | 7.48e-06 | 148 |
| GO:00315705 | Esophagus | ESCC | DNA integrity checkpoint | 83/8552 | 123/18723 | 8.17e-07 | 1.06e-05 | 83 |
| GO:006007016 | Esophagus | ESCC | canonical Wnt signaling pathway | 180/8552 | 303/18723 | 9.15e-07 | 1.17e-05 | 180 |
| GO:00000775 | Esophagus | ESCC | DNA damage checkpoint | 78/8552 | 115/18723 | 1.27e-06 | 1.56e-05 | 78 |
| GO:19019883 | Esophagus | ESCC | negative regulation of cell cycle phase transition | 151/8552 | 249/18723 | 1.28e-06 | 1.57e-05 | 151 |
| GO:0030330110 | Esophagus | ESCC | DNA damage response, signal transduction by p53 class mediator | 53/8552 | 72/18723 | 1.34e-06 | 1.63e-05 | 53 |
| GO:006082817 | Esophagus | ESCC | regulation of canonical Wnt signaling pathway | 153/8552 | 253/18723 | 1.38e-06 | 1.67e-05 | 153 |
| GO:0048872111 | Esophagus | ESCC | homeostasis of number of cells | 163/8552 | 272/18723 | 1.40e-06 | 1.69e-05 | 163 |
| GO:004593013 | Esophagus | ESCC | negative regulation of mitotic cell cycle | 143/8552 | 235/18723 | 1.84e-06 | 2.15e-05 | 143 |
| GO:003514815 | Esophagus | ESCC | tube formation | 96/8552 | 148/18723 | 1.86e-06 | 2.16e-05 | 96 |
| GO:190199113 | Esophagus | ESCC | negative regulation of mitotic cell cycle phase transition | 112/8552 | 179/18723 | 3.69e-06 | 4.03e-05 | 112 |
| GO:00721759 | Esophagus | ESCC | epithelial tube formation | 86/8552 | 132/18723 | 4.81e-06 | 5.10e-05 | 86 |
| GO:006056210 | Esophagus | ESCC | epithelial tube morphogenesis | 187/8552 | 325/18723 | 9.95e-06 | 9.44e-05 | 187 |
| GO:00420636 | Esophagus | ESCC | gliogenesis | 172/8552 | 301/18723 | 3.75e-05 | 3.04e-04 | 172 |
| GO:009026316 | Esophagus | ESCC | positive regulation of canonical Wnt signaling pathway | 69/8552 | 106/18723 | 4.22e-05 | 3.39e-04 | 69 |
| GO:003017716 | Esophagus | ESCC | positive regulation of Wnt signaling pathway | 87/8552 | 140/18723 | 6.18e-05 | 4.73e-04 | 87 |
| GO:00140091 | Esophagus | ESCC | glial cell proliferation | 37/8552 | 51/18723 | 9.01e-05 | 6.50e-04 | 37 |
| GO:004477312 | Esophagus | ESCC | mitotic DNA damage checkpoint | 54/8552 | 81/18723 | 1.09e-04 | 7.64e-04 | 54 |
| Page: 1 2 3 4 5 6 7 8 9 10 11 12 13 14 15 16 17 18 19 20 21 22 23 24 25 26 27 28 29 30 31 32 33 34 35 36 37 38 39 40 41 42 43 44 45 46 47 48 49 50 51 52 53 54 55 56 57 58 59 60 61 62 63 64 65 66 67 68 69 70 71 72 73 74 75 76 77 78 79 80 81 82 83 84 85 86 87 88 89 90 91 92 93 94 95 96 97 98 99 100 101 102 103 104 105 106 107 |
| Pathway ID | Tissue | Disease Stage | Description | Gene Ratio | Bg Ratio | pvalue | p.adjust | qvalue | Count |
| Page: 1 |
Top |
Cell-cell communication analysis |
| Identification of potential cell-cell interactions between two cell types and their ligand-receptor pairs for different disease states |
| Ligand | Receptor | LRpair | Pathway | Tissue | Disease Stage |
| Page: 1 |
Top |
Single-cell gene regulatory network inference analysis |
| Find out the significant the regulons (TFs) and the target genes of each regulon across cell types for different disease states |
| TF | Cell Type | Tissue | Disease Stage | Target Gene | RSS | Regulon Activity |
| SOX4 | INCAF | Cervix | N_HPV | MMP2,MGP,MAF, etc. | 7.86e-01 |  |
| SOX4 | STM | Colorectum | AD | SLC12A2,ASCL2,MEX3A, etc. | 1.53e-01 |  |
| SOX4 | STM | Colorectum | SER | SLC12A2,ASCL2,MEX3A, etc. | 8.09e-02 |  |
| SOX4 | CD8TEXP | Colorectum | CRC | GPX2,TTC32,OLFM4, etc. | 3.55e-01 |  |
| SOX4 | MAST | Colorectum | SER | GPX2,TTC32,OLFM4, etc. | 2.36e-01 | |
| SOX4 | MYOFIB | Colorectum | SER | GPX2,TMA16,BICDL2, etc. | 2.38e-01 | |
| SOX4 | STM | Esophagus | LGIN | MARCKSL1,ZNF428,MFAP2, etc. | 7.24e-01 |  |
| SOX4 | STM | Liver | Healthy | DEFB1,ZNF664,TMSB10, etc. | 6.49e-01 |  |
| SOX4 | pDC | Liver | Cirrhotic | ARMH1,CCR9,RPS26, etc. | 2.43e-01 |  |
| SOX4 | DC | Liver | HCC | ARMH1,CCR9,RPS26, etc. | 3.68e-02 |  |
| ∗The dot plots of a searched regulon are shown for all cell subpopulations in each disease state of each tissue based on the regulon specific score inferred using pySCENIC and by calculating the average expression. |
| Page: 1 2 |
Top |
Somatic mutation of malignant transformation related genes |
| Annotation of somatic variants for genes involved in malignant transformation |
| Hugo Symbol | Variant Class | Variant Classification | dbSNP RS | HGVSc | HGVSp | HGVSp Short | SWISSPROT | BIOTYPE | SIFT | PolyPhen | Tumor Sample Barcode | Tissue | Histology | Sex | Age | Stage | Therapy Types | Drugs | Outcome |
| SOX4 | SNV | Missense_Mutation | rs777539753 | c.1172N>T | p.Ser391Phe | p.S391F | Q06945 | protein_coding | deleterious(0) | possibly_damaging(0.854) | TCGA-A7-A6VW-01 | Breast | breast invasive carcinoma | Female | <65 | I/II | Chemotherapy | doxorubicin | CR |
| SOX4 | SNV | Missense_Mutation | novel | c.1367A>T | p.Glu456Val | p.E456V | Q06945 | protein_coding | deleterious(0) | probably_damaging(0.996) | TCGA-AC-A8OP-01 | Breast | breast invasive carcinoma | Female | >=65 | I/II | Unknown | Unknown | SD |
| SOX4 | SNV | Missense_Mutation | novel | c.1210N>T | p.Asp404Tyr | p.D404Y | Q06945 | protein_coding | deleterious(0.01) | probably_damaging(0.936) | TCGA-MY-A5BD-01 | Cervix | cervical & endocervical cancer | Female | <65 | I/II | Chemotherapy | cisplatin | CR |
| SOX4 | SNV | Missense_Mutation | novel | c.1390G>C | p.Glu464Gln | p.E464Q | Q06945 | protein_coding | deleterious(0) | probably_damaging(0.997) | TCGA-VS-A9UC-01 | Cervix | cervical & endocervical cancer | Female | <65 | I/II | Chemotherapy | cisplatin | SD |
| SOX4 | SNV | Missense_Mutation | c.331G>C | p.Glu111Gln | p.E111Q | Q06945 | protein_coding | deleterious(0) | probably_damaging(0.997) | TCGA-CM-6674-01 | Colorectum | colon adenocarcinoma | Male | <65 | I/II | Unknown | Unknown | SD | |
| SOX4 | SNV | Missense_Mutation | c.299N>G | p.Leu100Arg | p.L100R | Q06945 | protein_coding | deleterious(0) | probably_damaging(1) | TCGA-G4-6588-01 | Colorectum | colon adenocarcinoma | Female | <65 | I/II | Unknown | Unknown | SD | |
| SOX4 | SNV | Missense_Mutation | c.237N>T | p.Glu79Asp | p.E79D | Q06945 | protein_coding | tolerated(0.06) | benign(0.444) | TCGA-AG-A002-01 | Colorectum | rectum adenocarcinoma | Male | <65 | I/II | Unknown | Unknown | SD | |
| SOX4 | SNV | Missense_Mutation | c.237N>T | p.Glu79Asp | p.E79D | Q06945 | protein_coding | tolerated(0.06) | benign(0.444) | TCGA-A5-A1OF-01 | Endometrium | uterine corpus endometrioid carcinoma | Female | <65 | I/II | Unknown | Unknown | SD | |
| SOX4 | SNV | Missense_Mutation | novel | c.1252T>G | p.Ser418Ala | p.S418A | Q06945 | protein_coding | tolerated(0.16) | benign(0.021) | TCGA-AP-A1DV-01 | Endometrium | uterine corpus endometrioid carcinoma | Female | <65 | I/II | Unknown | Unknown | SD |
| SOX4 | SNV | Missense_Mutation | novel | c.1166N>G | p.Ser389Cys | p.S389C | Q06945 | protein_coding | deleterious(0) | benign(0.009) | TCGA-AX-A3G3-01 | Endometrium | uterine corpus endometrioid carcinoma | Female | <65 | III/IV | Unknown | Unknown | SD |
| Page: 1 2 |
Top |
Related drugs of malignant transformation related genes |
| Identification of chemicals and drugs interact with genes involved in malignant transfromation |
| (DGIdb 4.0) |
| Entrez ID | Symbol | Category | Interaction Types | Drug Claim Name | Drug Name | PMIDs |
| Page: 1 |

Copyright 2023-Present -The University of Texas Health Science Center at Houston |