Schematic overview of the cellular and molecular mechanisms involved in the cancer progression, including the proposed cellular and molecular mechanisms in cancer cells trajectory. AT1: alveolar type 1 cells; AT2: alveolar type 2 cells; AAH: atypical adenomatous hyperplasia; AIS: adenocarcinoma in situ; MIA: minimally invasive adenocarcinoma; IA: invasive adenocarcinoma; EMT: epithelial-mesenchymal transition

Home

Download

Statistics

Help

Contact

Center for Computational Systems Medicine
leaf

Gene summary

leaf

Malignant transformation analysis

leaf

Malignant transformation related pathway analysis

leaf

Cell-cell communication analysis

leaf

Single-cell gene regulatory network inference analysis

leaf

Somatic mutation of malignant transformation related genes

leaf

Related drugs of malignant transformation related genes

Gene: LASP1

Gene summary for LASP1

check button Gene summary.

Gene informationSpeciesHuman
Gene symbol

LASP1

Gene ID

3927

Gene nameLIM and SH3 protein 1
Gene AliasLasp-1
Cytomap17q12
Gene Typeprotein-coding
GO ID

GO:0006810

UniProtAcc

B4DIC4


Top

Malignant transformation analysis

check button Identification of the aberrant gene expression in precancerous and cancerous lesions by comparing the gene expression of stem-like cells in diseased tissues with normal stem cells
check button Malignant transformation involving gene list.
Entrez IDSymbolReplicatesSpeciesOrganTissueAdj P-valueLog2FCMalignancy
3927LASP1GSM4909290HumanBreastIDC8.06e-581.18e+000.2096
3927LASP1GSM4909292HumanBreastIDC1.97e-067.60e-010.1236
3927LASP1GSM4909293HumanBreastIDC3.59e-134.28e-010.1581
3927LASP1GSM4909298HumanBreastIDC1.86e-021.80e-030.1551
3927LASP1GSM4909311HumanBreastIDC2.84e-06-1.00e-010.1534
3927LASP1GSM4909313HumanBreastIDC1.64e-022.64e-010.0391
3927LASP1GSM4909319HumanBreastIDC6.33e-12-1.75e-010.1563
3927LASP1GSM4909320HumanBreastIDC3.41e-02-1.87e-010.1575
3927LASP1NCCBC5HumanBreastDCIS2.77e-094.12e-010.2046
3927LASP1P1HumanBreastIDC4.43e-09-6.48e-020.1527
3927LASP1DCIS2HumanBreastDCIS1.54e-34-8.79e-030.0085
3927LASP1LZE4THumanEsophagusESCC2.16e-062.37e-010.0811
3927LASP1LZE7THumanEsophagusESCC3.76e-022.08e-010.0667
3927LASP1LZE8THumanEsophagusESCC1.62e-052.27e-010.067
3927LASP1LZE20THumanEsophagusESCC7.87e-033.87e-020.0662
3927LASP1LZE24THumanEsophagusESCC4.93e-351.20e+000.0596
3927LASP1LZE21THumanEsophagusESCC4.71e-052.16e-010.0655
3927LASP1P1T-EHumanEsophagusESCC5.99e-125.60e-010.0875
3927LASP1P2T-EHumanEsophagusESCC1.32e-314.78e-010.1177
3927LASP1P4T-EHumanEsophagusESCC1.60e-164.15e-010.1323
Page: 1 2 3 4 5 6 7 8 

check button Transcriptomic changes along malignancy continuum.
TissueExpression DynamicsAbbreviation
BreastThe image shows the transcriptomic changes along malignancy continuum.log2FC in expression of this searched gene in stem-like cells from each diseased tissue sample relative to stem-like cells in normal samples in each tissue plotted against the malignancy continuum. Samples are colored based on if they are from different disease stage.
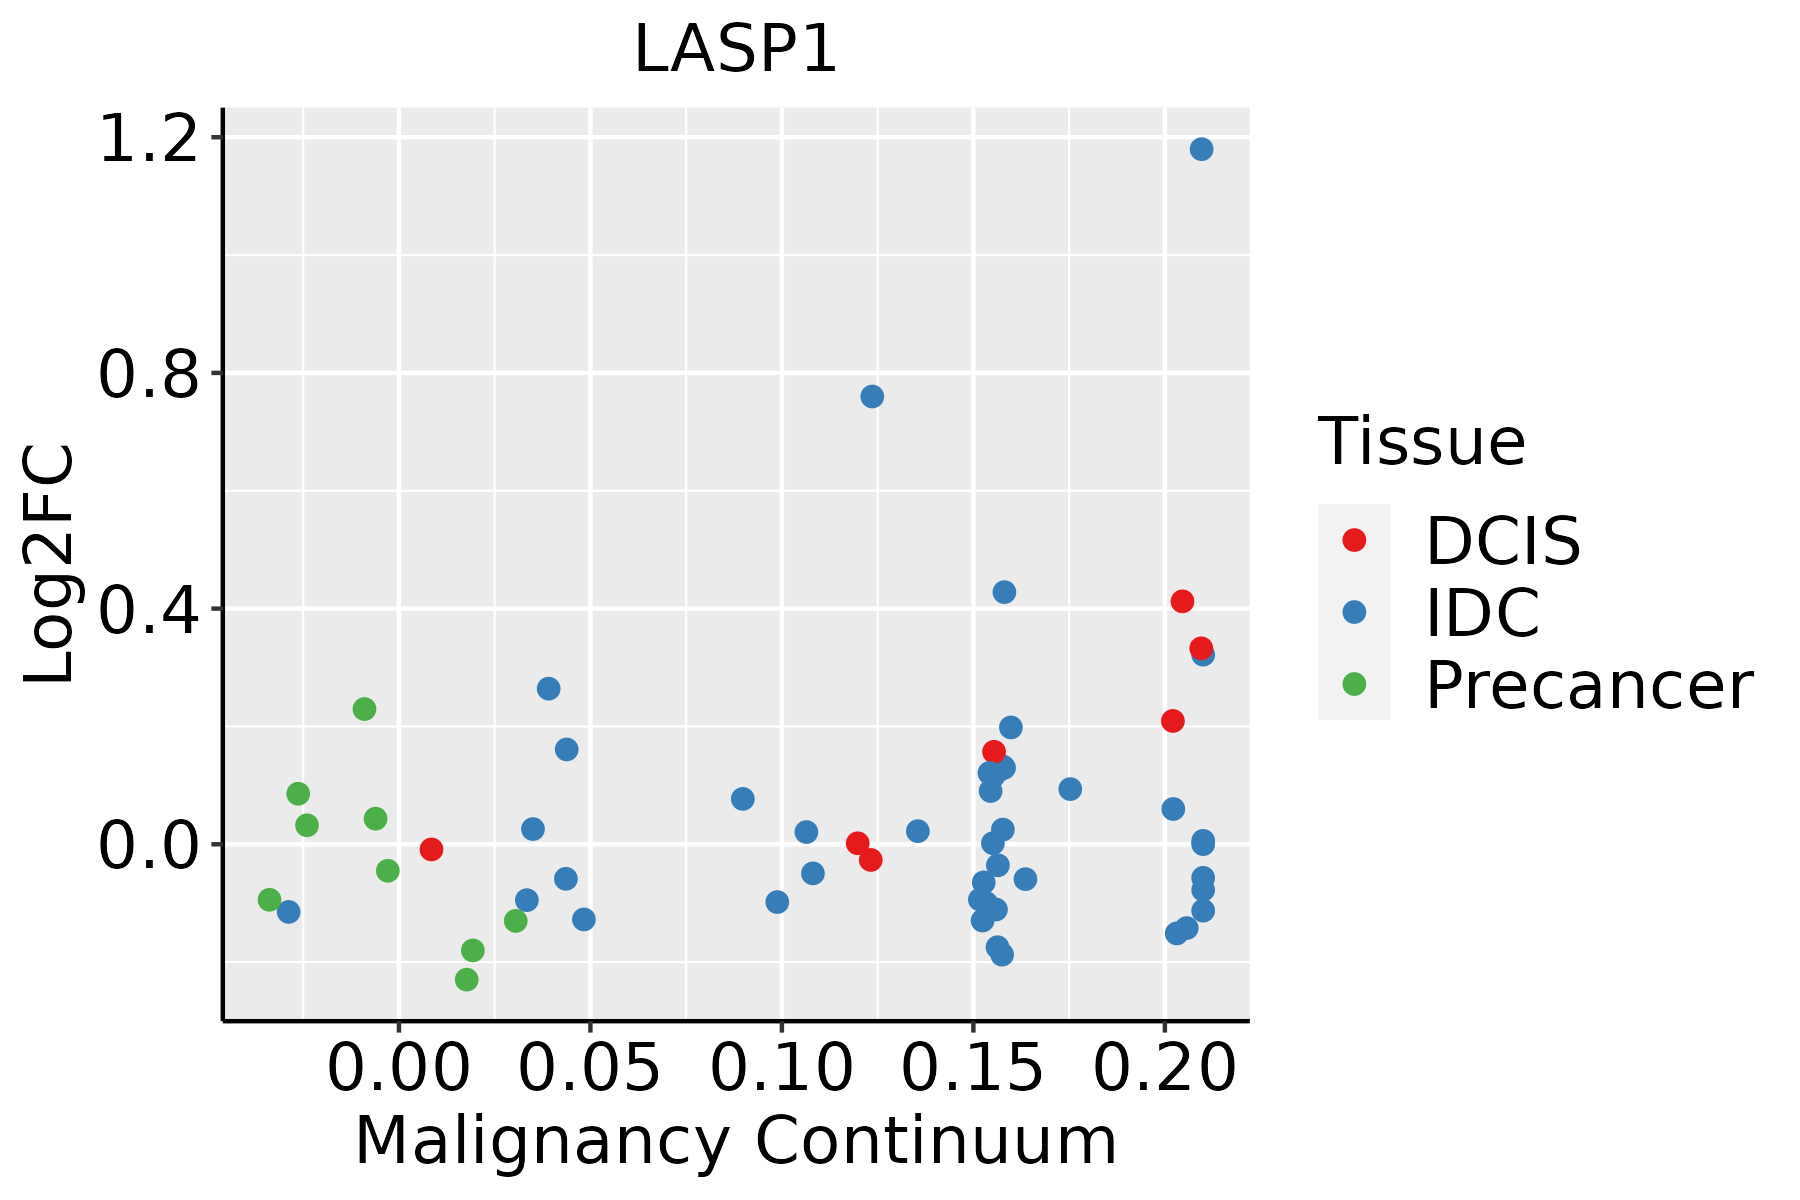
IDC: Invasive ductal carcinoma
DCIS: Ductal carcinoma in situ
Precancer(BRCA1-mut): Precancerous lesion from BRCA1 mutation carriers
EsophagusThe image shows the transcriptomic changes along malignancy continuum.log2FC in expression of this searched gene in stem-like cells from each diseased tissue sample relative to stem-like cells in normal samples in each tissue plotted against the malignancy continuum. Samples are colored based on if they are from different disease stage.
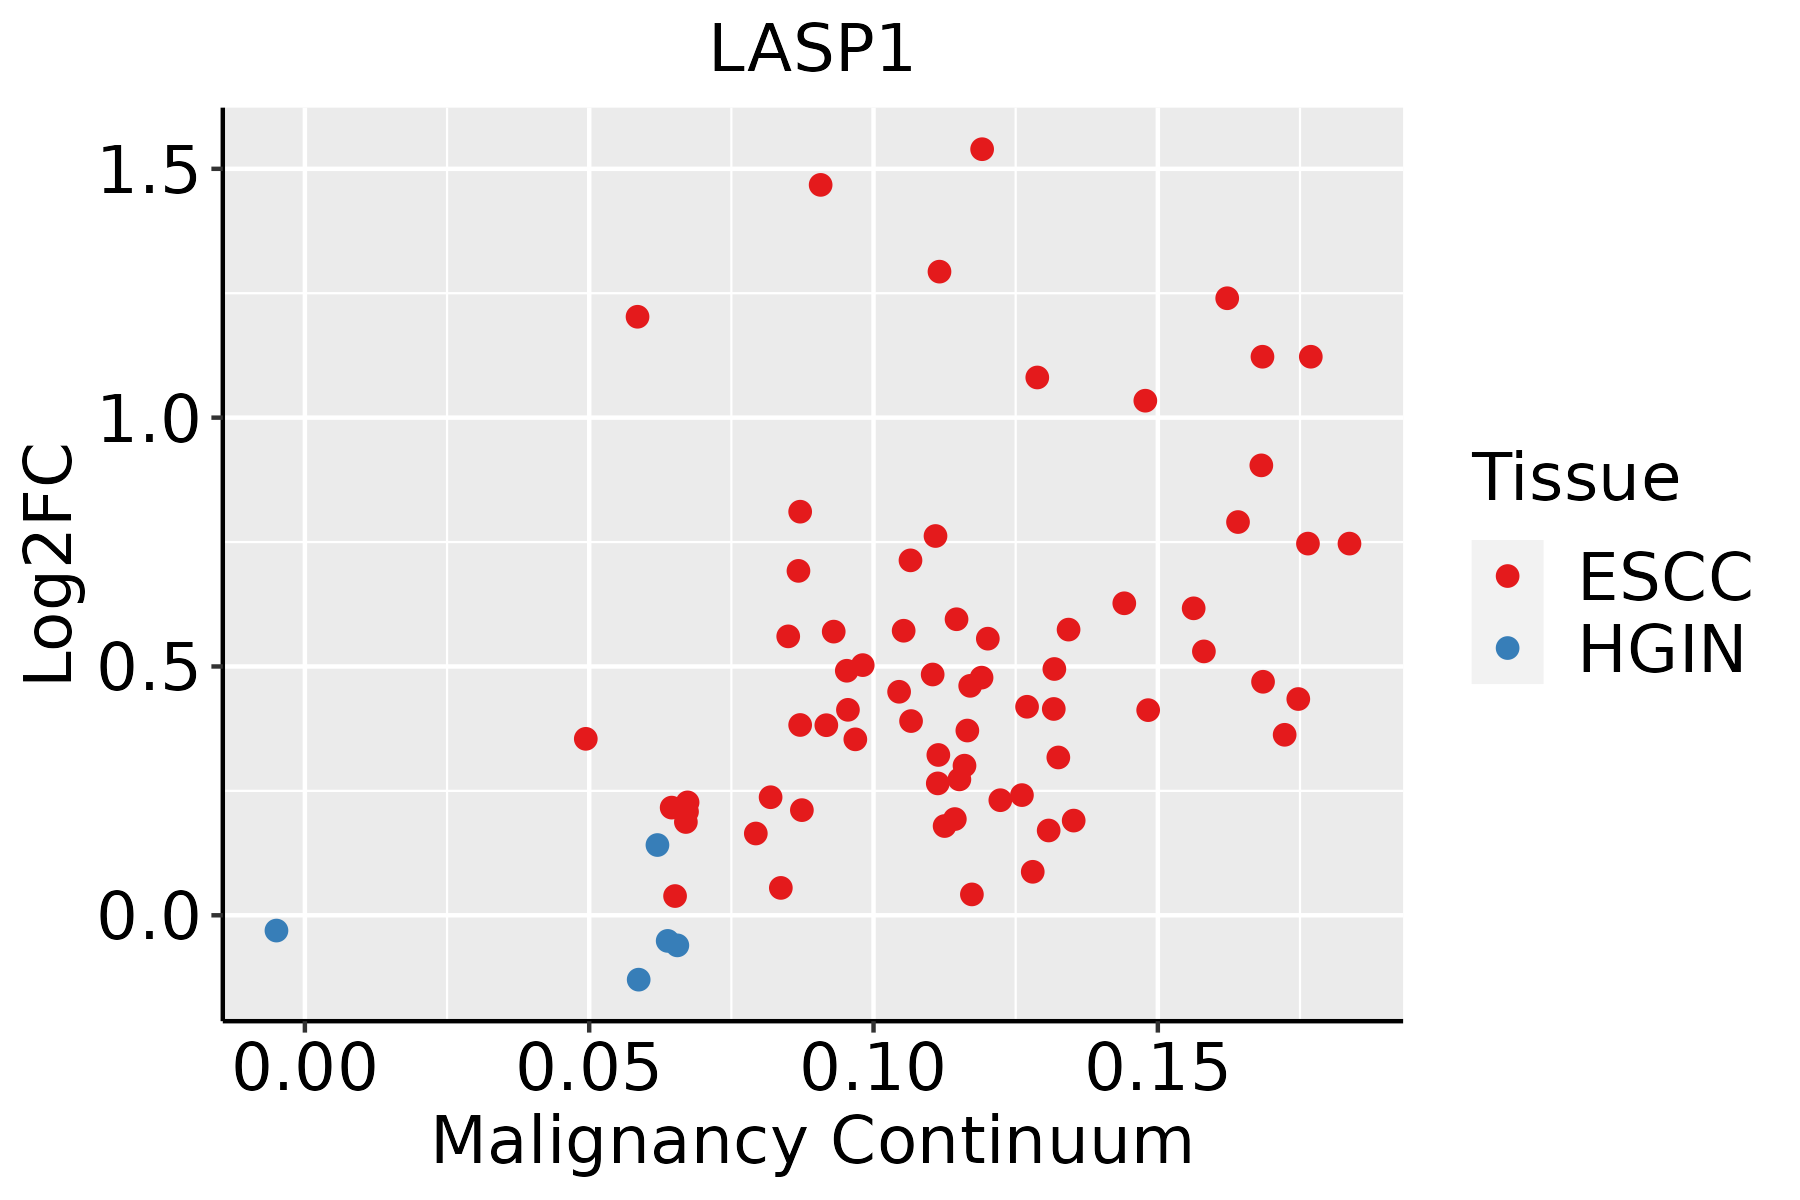
ESCC: Esophageal squamous cell carcinoma
HGIN: High-grade intraepithelial neoplasias
LGIN: Low-grade intraepithelial neoplasias
GCThe image shows the transcriptomic changes along malignancy continuum.log2FC in expression of this searched gene in stem-like cells from each diseased tissue sample relative to stem-like cells in normal samples in each tissue plotted against the malignancy continuum. Samples are colored based on if they are from different disease stage.
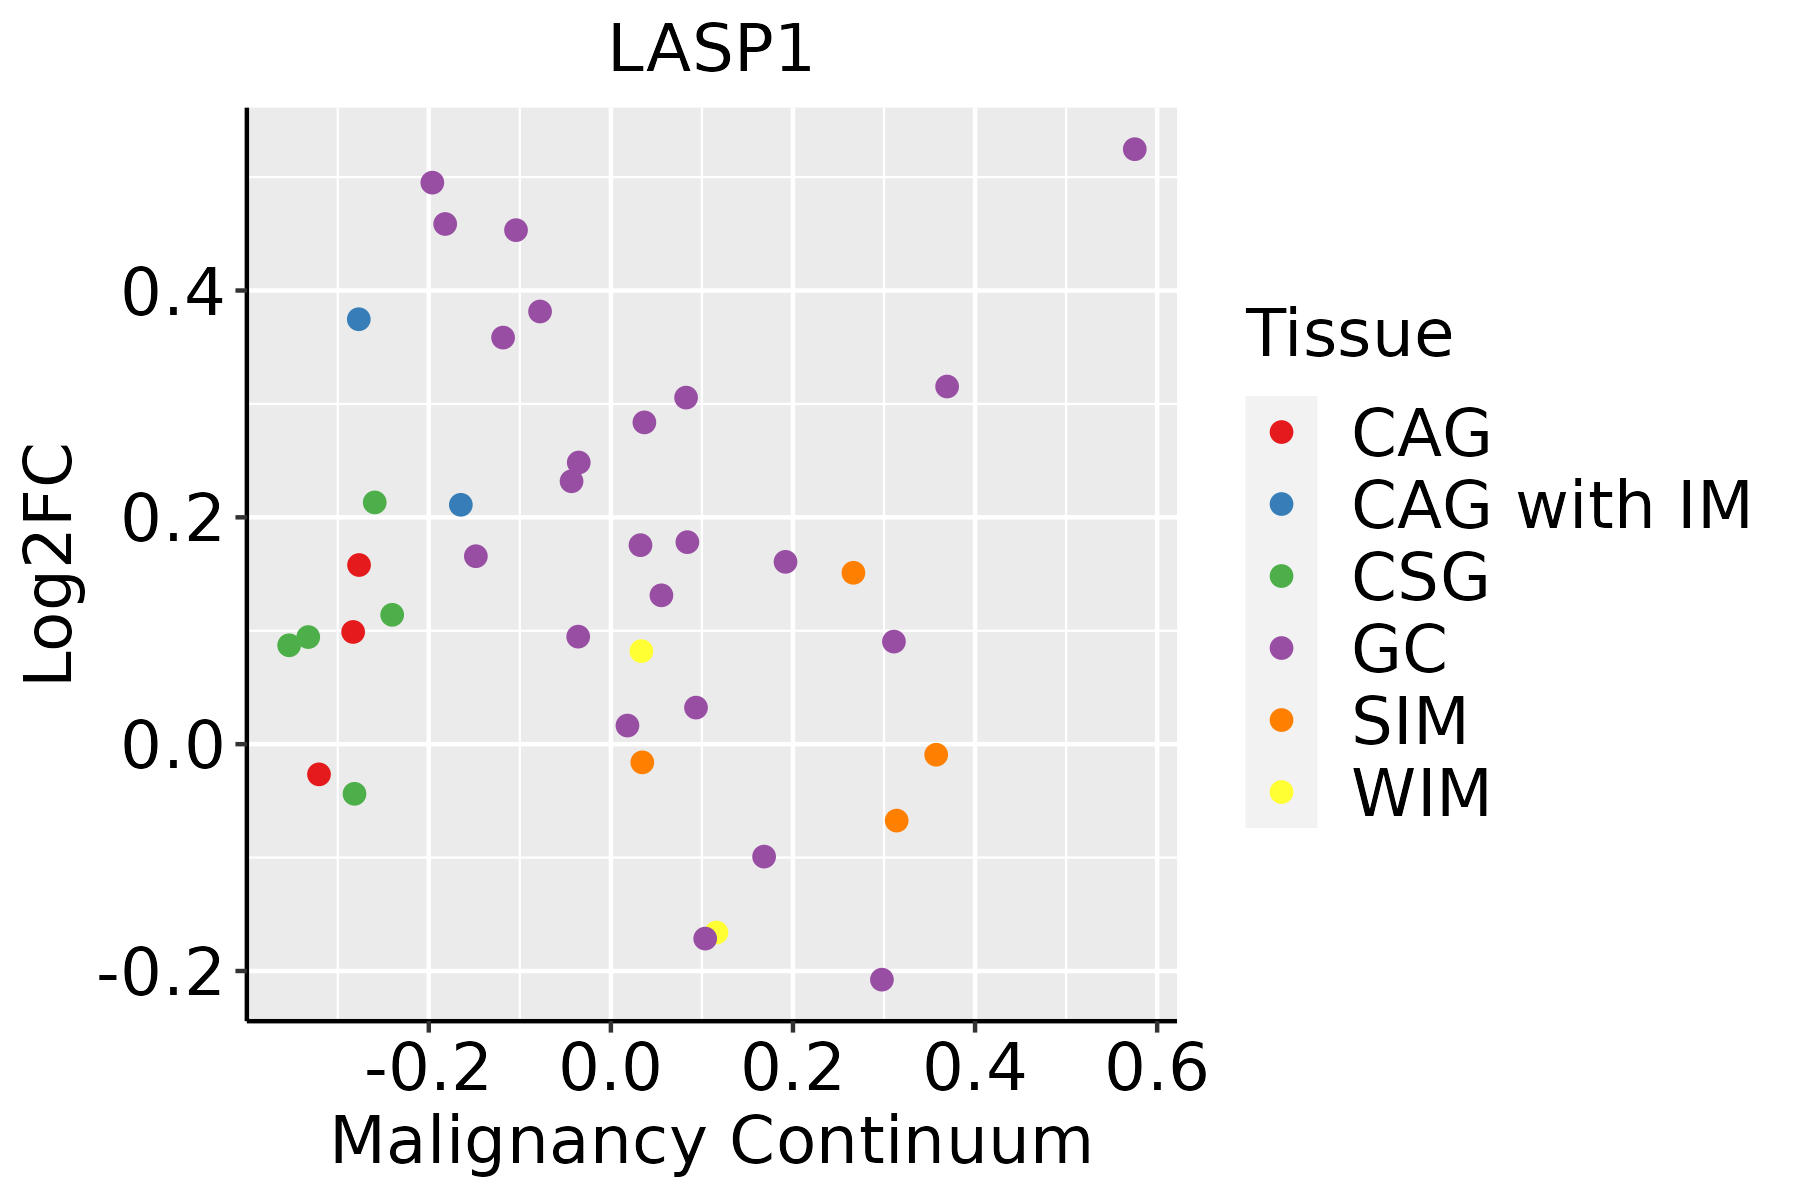
CAG: Chronic atrophic gastritis
CAG with IM: Chronic atrophic gastritis with intestinal metaplasia
CSG: Chronic superficial gastritis
GC: Gastric cancer
SIM: Severe intestinal metaplasia
WIM: Wild intestinal metaplasia
LiverThe image shows the transcriptomic changes along malignancy continuum.log2FC in expression of this searched gene in stem-like cells from each diseased tissue sample relative to stem-like cells in normal samples in each tissue plotted against the malignancy continuum. Samples are colored based on if they are from different disease stage.HCC: Hepatocellular carcinoma
NAFLD: Non-alcoholic fatty liver disease
Oral CavityThe image shows the transcriptomic changes along malignancy continuum.log2FC in expression of this searched gene in stem-like cells from each diseased tissue sample relative to stem-like cells in normal samples in each tissue plotted against the malignancy continuum. Samples are colored based on if they are from different disease stage.EOLP: Erosive Oral lichen planus
LP: leukoplakia
NEOLP: Non-erosive oral lichen planus
OSCC: Oral squamous cell carcinoma
SkinThe image shows the transcriptomic changes along malignancy continuum.log2FC in expression of this searched gene in stem-like cells from each diseased tissue sample relative to stem-like cells in normal samples in each tissue plotted against the malignancy continuum. Samples are colored based on if they are from different disease stage.
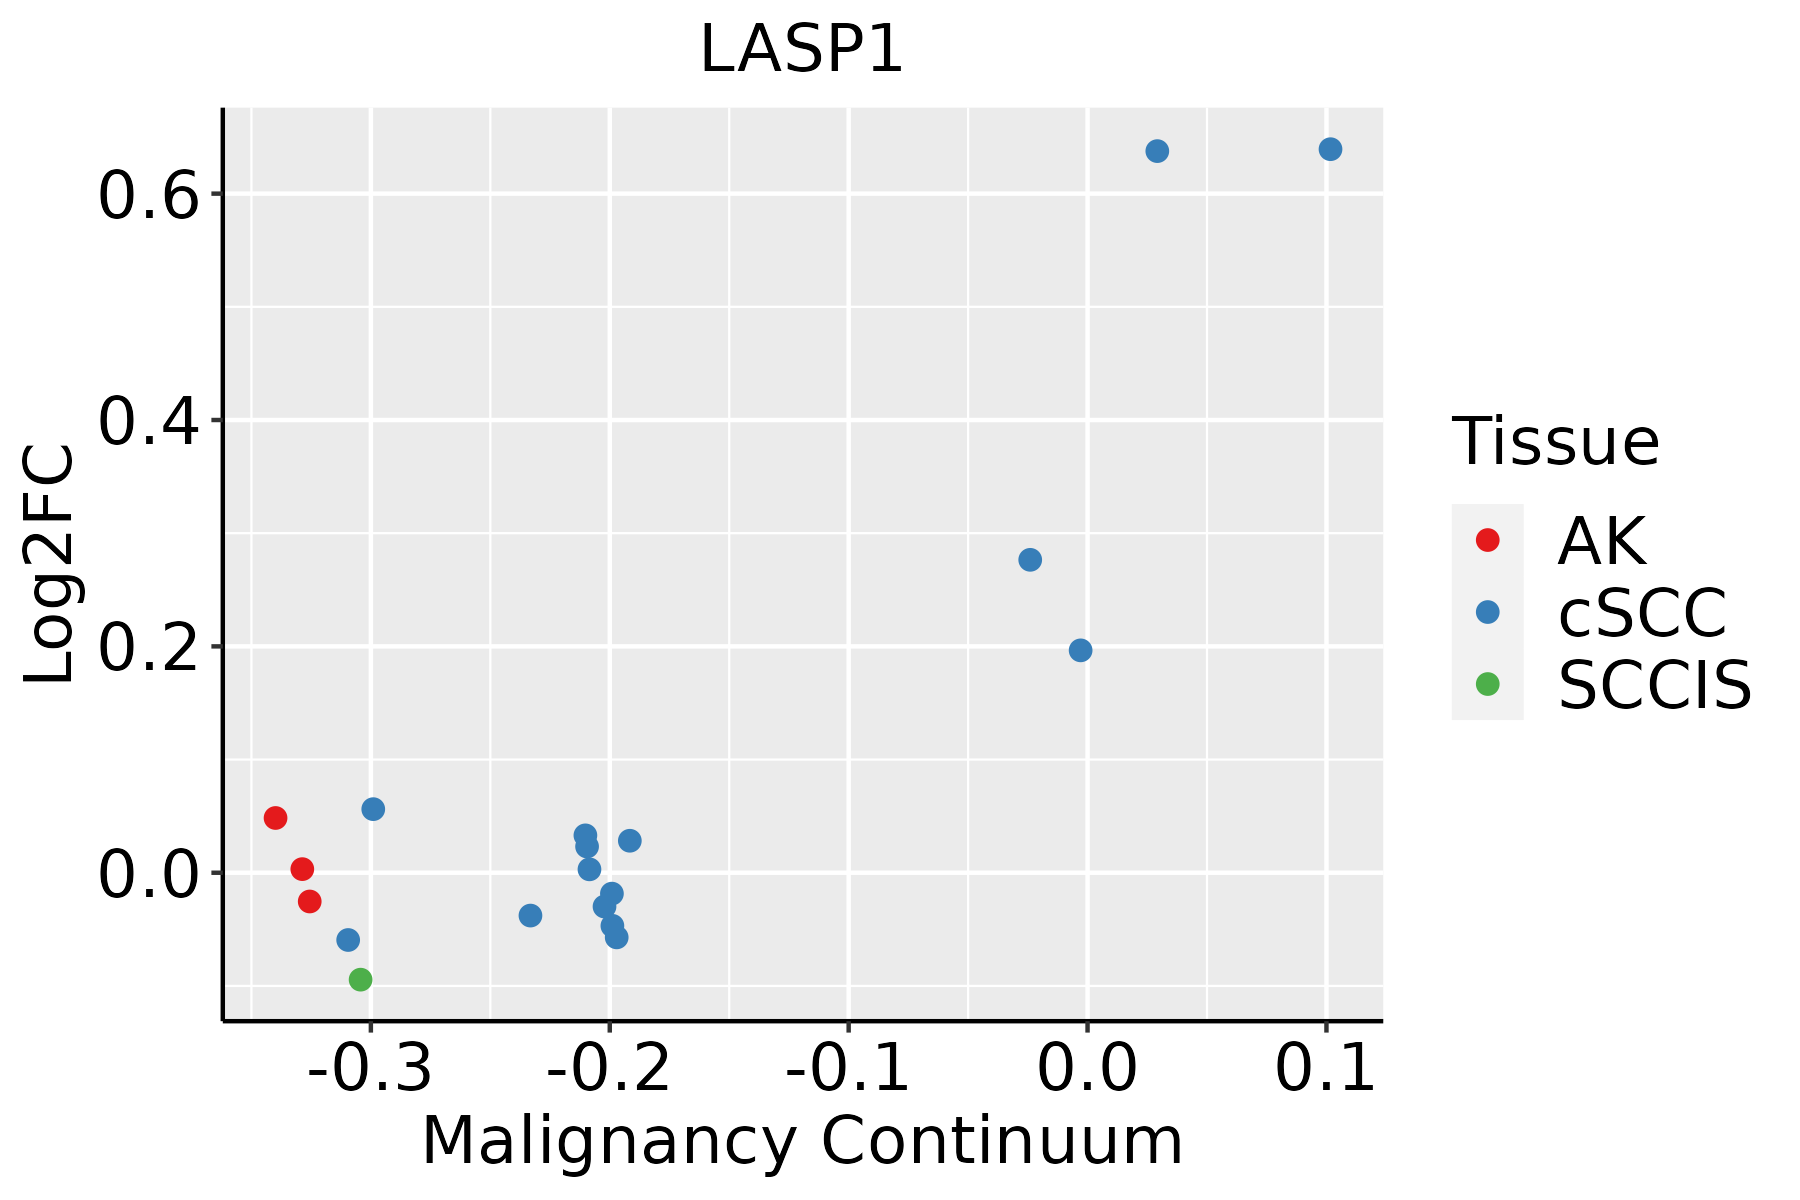
AK: Actinic keratosis
cSCC: Cutaneous squamous cell carcinoma
SCCIS:squamous cell carcinoma in situ
ThyroidThe image shows the transcriptomic changes along malignancy continuum.log2FC in expression of this searched gene in stem-like cells from each diseased tissue sample relative to stem-like cells in normal samples in each tissue plotted against the malignancy continuum. Samples are colored based on if they are from different disease stage.ATC: Anaplastic thyroid cancer
HT: Hashimoto's thyroiditis
PTC: Papillary thyroid cancer
∗log2FC in expression of this searched gene in stem-like cells from each diseased tissue sample relative to stem-like cells in normal samples in each tissue plotted against the malignancy continuum. Samples are colored based on if they are from different disease stage.

Top

Malignant transformation related pathway analysis

check buttonFind out the enriched GO biological processes and KEGG pathways involved in transition from healthy to precancer to cancer
check button Figure of enriched GO biological processes.
TissueDisease StageEnriched GO biological Processes
ColorectumADGO analysis - Figure of enriched GO biological processes: Top 15 enriched GO BP terms are showed in the bar plot of each disease state in each tissue. Each row represents a significant GO biological process which is colored according to the -log10(p.adjust).
ColorectumSERGO analysis - Figure of enriched GO biological processes: Top 15 enriched GO BP terms are showed in the bar plot of each disease state in each tissue. Each row represents a significant GO biological process which is colored according to the -log10(p.adjust).
ColorectumMSSGO analysis - Figure of enriched GO biological processes: Top 15 enriched GO BP terms are showed in the bar plot of each disease state in each tissue. Each row represents a significant GO biological process which is colored according to the -log10(p.adjust).
ColorectumMSI-HGO analysis - Figure of enriched GO biological processes: Top 15 enriched GO BP terms are showed in the bar plot of each disease state in each tissue. Each row represents a significant GO biological process which is colored according to the -log10(p.adjust).
ColorectumFAPGO analysis - Figure of enriched GO biological processes: Top 15 enriched GO BP terms are showed in the bar plot of each disease state in each tissue. Each row represents a significant GO biological process which is colored according to the -log10(p.adjust).
∗Top 15 enriched GO BP terms are showed in the bar plot of each disease state in each tissue. Each row represents a significant GO biological process which is colored according to the -log10(p.adjust).
Page: 1 2 3 4 5 6 7 8 9 

check button Enriched GO biological processes.
GO IDTissueDisease StageDescriptionGene RatioBg Ratiopvaluep.adjustCount
GO:000716023Oral cavityNEOLPcell-matrix adhesion62/2005233/187236.73e-121.14e-0962
GO:015011624Oral cavityNEOLPregulation of cell-substrate junction organization30/200571/187237.44e-121.17e-0930
GO:000701534Oral cavityNEOLPactin filament organization94/2005442/187234.49e-115.80e-0994
GO:000195223Oral cavityNEOLPregulation of cell-matrix adhesion41/2005128/187235.14e-116.30e-0941
GO:003297033Oral cavityNEOLPregulation of actin filament-based process85/2005397/187232.70e-102.51e-0885
GO:003432923Oral cavityNEOLPcell junction assembly88/2005420/187234.18e-103.44e-0888
GO:000166725Oral cavityNEOLPameboidal-type cell migration96/2005475/187235.16e-104.14e-0896
GO:003133433Oral cavityNEOLPpositive regulation of protein-containing complex assembly58/2005237/187231.09e-097.92e-0858
GO:001063123Oral cavityNEOLPepithelial cell migration77/2005357/187231.32e-099.43e-0877
GO:190290533Oral cavityNEOLPpositive regulation of supramolecular fiber organization53/2005209/187231.47e-091.01e-0753
GO:003295633Oral cavityNEOLPregulation of actin cytoskeleton organization77/2005358/187231.51e-091.02e-0777
GO:003227133Oral cavityNEOLPregulation of protein polymerization57/2005233/187231.54e-091.03e-0757
GO:009013023Oral cavityNEOLPtissue migration78/2005365/187231.61e-091.06e-0778
GO:009013223Oral cavityNEOLPepithelium migration77/2005360/187231.96e-091.24e-0777
GO:005125833Oral cavityNEOLPprotein polymerization67/2005297/187232.27e-091.40e-0767
GO:000716333Oral cavityNEOLPestablishment or maintenance of cell polarity53/2005218/187237.21e-093.82e-0753
GO:002241131Oral cavityNEOLPcellular component disassembly87/2005443/187231.39e-086.46e-0787
GO:00301982Oral cavityNEOLPextracellular matrix organization64/2005301/187235.66e-082.24e-0664
GO:00430622Oral cavityNEOLPextracellular structure organization64/2005302/187236.44e-082.50e-0664
GO:00452292Oral cavityNEOLPexternal encapsulating structure organization64/2005304/187238.33e-083.17e-0664
Page: 1 2 3 4 5 6 7 8 9 10 11 12 13 14 15 16 17 18 19 20 21 22 23 24 25 26 27 28 29 30 31 32 33 34 35 36 37 38 39 40 41 42 43 44 45 46 47 48 49 50 51 52 53 54 55 56 

check button Enriched KEGG pathways.
Pathway IDTissueDisease StageDescriptionGene RatioBg Ratiopvaluep.adjustqvalueCount
Page: 1 

Top

Cell-cell communication analysis

check buttonIdentification of potential cell-cell interactions between two cell types and their ligand-receptor pairs for different disease states
LigandReceptorLRpairPathwayTissueDisease Stage
Page: 1 

Top

Single-cell gene regulatory network inference analysis

check buttonFind out the significant the regulons (TFs) and the target genes of each regulon across cell types for different disease states
TFCell TypeTissueDisease StageTarget GeneRSSRegulon Activity
∗The dot plots of a searched regulon are shown for all cell subpopulations in each disease state of each tissue based on the regulon specific score inferred using pySCENIC and by calculating the average expression.
Page: 1 

Top

Somatic mutation of malignant transformation related genes

check buttonAnnotation of somatic variants for genes involved in malignant transformation
Hugo SymbolVariant ClassVariant ClassificationdbSNP RSHGVScHGVSpHGVSp ShortSWISSPROTBIOTYPESIFTPolyPhenTumor Sample BarcodeTissueHistologySexAgeStageTherapy TypesDrugsOutcome
LASP1SNVMissense_Mutationnovelc.108N>Tp.Lys36Asnp.K36NQ14847protein_codingtolerated(0.05)benign(0.033)TCGA-AN-A0FS-01Breastbreast invasive carcinomaFemale<65I/IIUnknownUnknownSD
LASP1SNVMissense_Mutationc.650N>Cp.Asp217Alap.D217AQ14847protein_codingdeleterious(0)probably_damaging(0.999)TCGA-BH-A0DH-01Breastbreast invasive carcinomaFemale<65I/IIChemotherapycyclophosphamideSD
LASP1SNVMissense_Mutationc.326N>Ap.Arg109Lysp.R109KQ14847protein_codingdeleterious(0.01)probably_damaging(0.964)TCGA-BH-A18P-01Breastbreast invasive carcinomaFemale<65I/IIUnknownUnknownPD
LASP1insertionIn_Frame_Insnovelc.233_234insAATACTATTCCTATTp.Ser78delinsArgIleLeuPheLeuPhep.S78delinsRILFLFQ14847protein_codingTCGA-A2-A0D2-01Breastbreast invasive carcinomaFemale<65I/IIChemotherapyadriamycinSD
LASP1insertionIn_Frame_Insnovelc.235_236insCAGATAp.Glu79delinsAlaAspLysp.E79delinsADKQ14847protein_codingTCGA-A2-A0D2-01Breastbreast invasive carcinomaFemale<65I/IIChemotherapyadriamycinSD
LASP1SNVMissense_Mutationc.90C>Gp.Phe30Leup.F30LQ14847protein_codingdeleterious(0)benign(0.442)TCGA-IR-A3LI-01Cervixcervical & endocervical cancerFemale<65I/IIChemotherapycisplatinCR
LASP1SNVMissense_Mutationc.164C>Tp.Ala55Valp.A55VQ14847protein_codingtolerated(0.06)benign(0.051)TCGA-AA-3949-01Colorectumcolon adenocarcinomaFemale>=65III/IVUnknownUnknownSD
LASP1SNVMissense_Mutationc.164N>Tp.Ala55Valp.A55VQ14847protein_codingtolerated(0.06)benign(0.051)TCGA-A5-A1OF-01Endometriumuterine corpus endometrioid carcinomaFemale<65I/IIUnknownUnknownSD
LASP1SNVMissense_Mutationnovelc.64N>Ap.Asp22Asnp.D22NQ14847protein_codingdeleterious(0)possibly_damaging(0.866)TCGA-A5-A2K5-01Endometriumuterine corpus endometrioid carcinomaFemale>=65I/IIUnknownUnknownSD
LASP1SNVMissense_Mutationc.616N>Tp.Arg206Trpp.R206WQ14847protein_codingdeleterious(0.01)probably_damaging(0.965)TCGA-AP-A051-01Endometriumuterine corpus endometrioid carcinomaFemale>=65I/IIUnknownUnknownSD
Page: 1 2 3 

Top

Related drugs of malignant transformation related genes

check buttonIdentification of chemicals and drugs interact with genes involved in malignant transfromation
(DGIdb 4.0)
Entrez IDSymbolCategoryInteraction TypesDrug Claim NameDrug NamePMIDs
Page: 1