| Tissue | Expression Dynamics | Abbreviation |
| Breast |  | IDC: Invasive ductal carcinoma |
| DCIS: Ductal carcinoma in situ |
| Precancer(BRCA1-mut): Precancerous lesion from BRCA1 mutation carriers |
| Cervix | 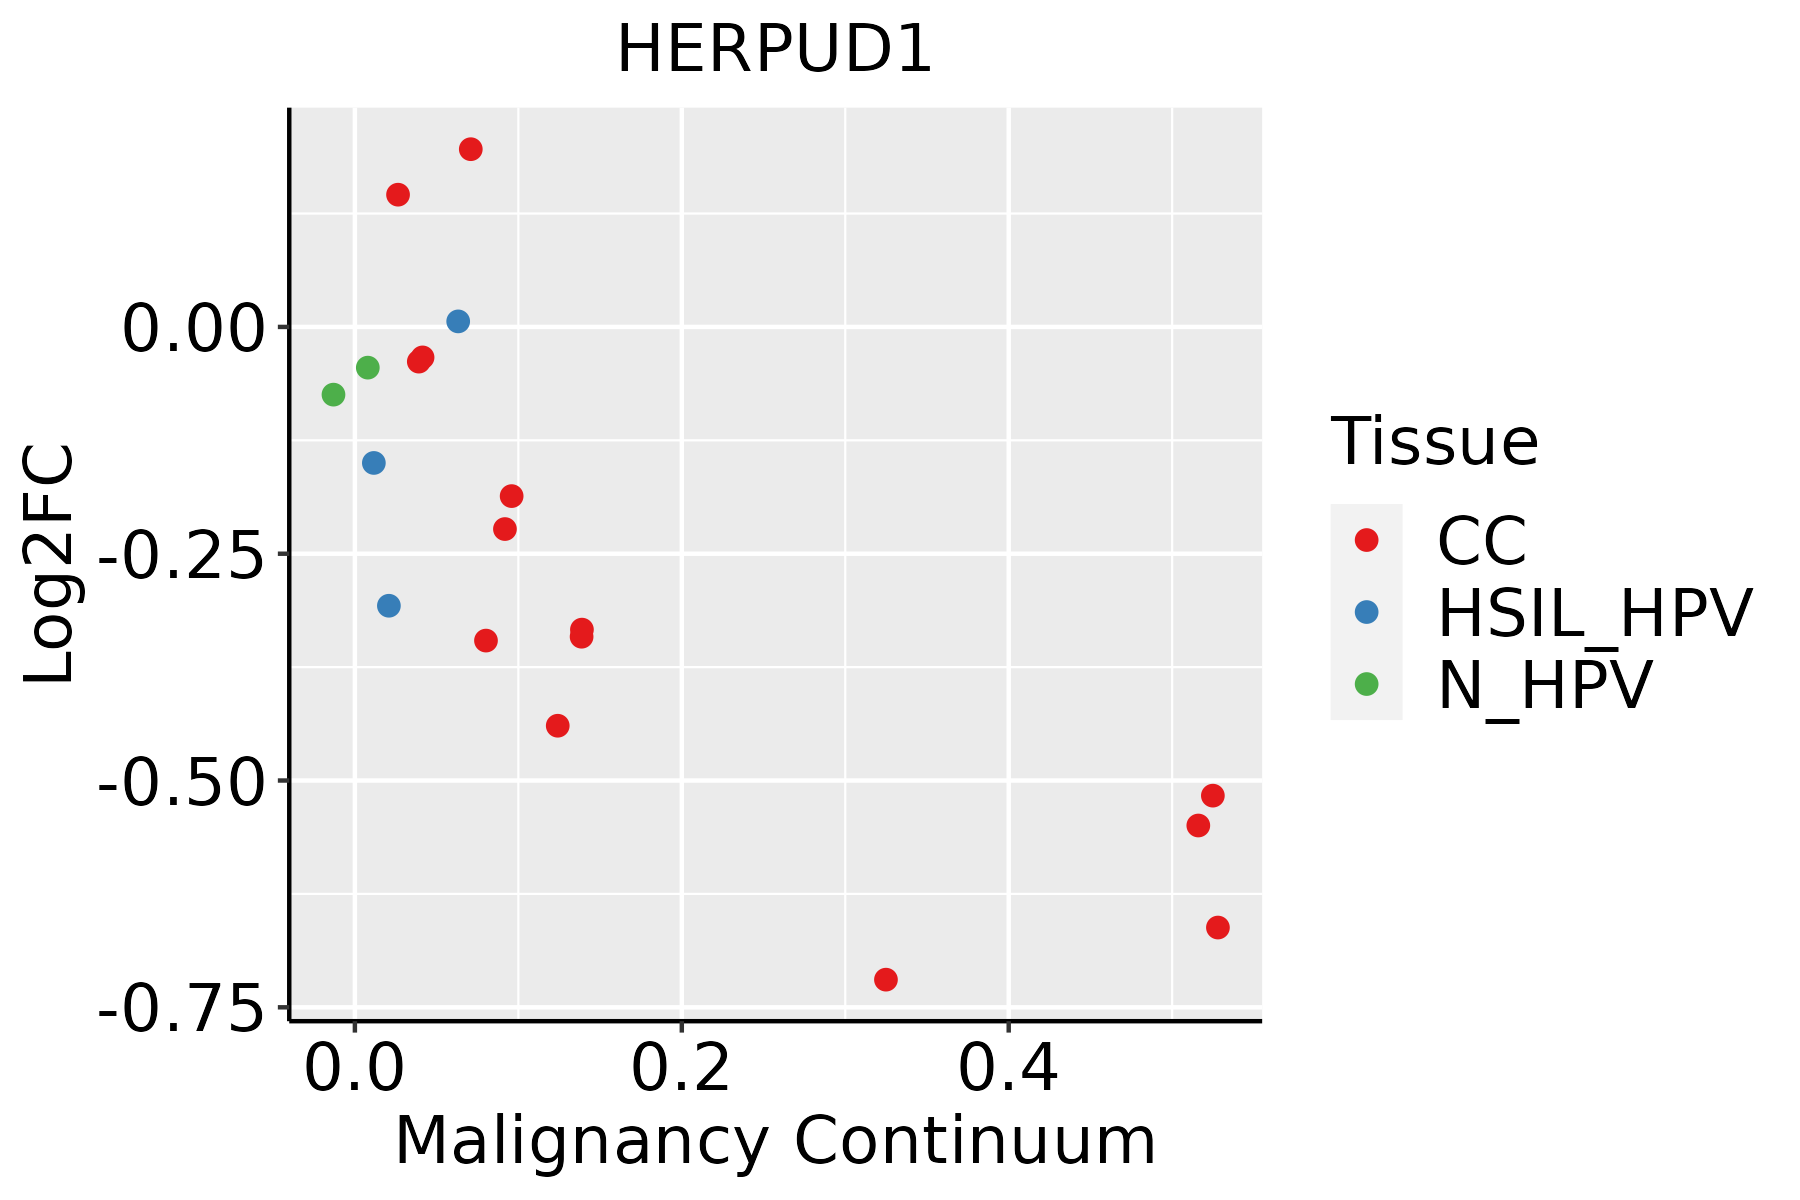 | CC: Cervix cancer |
| HSIL_HPV: HPV-infected high-grade squamous intraepithelial lesions |
| N_HPV: HPV-infected normal cervix |
| Colorectum (GSE201348) |  | FAP: Familial adenomatous polyposis |
| CRC: Colorectal cancer |
| Colorectum (HTA11) | 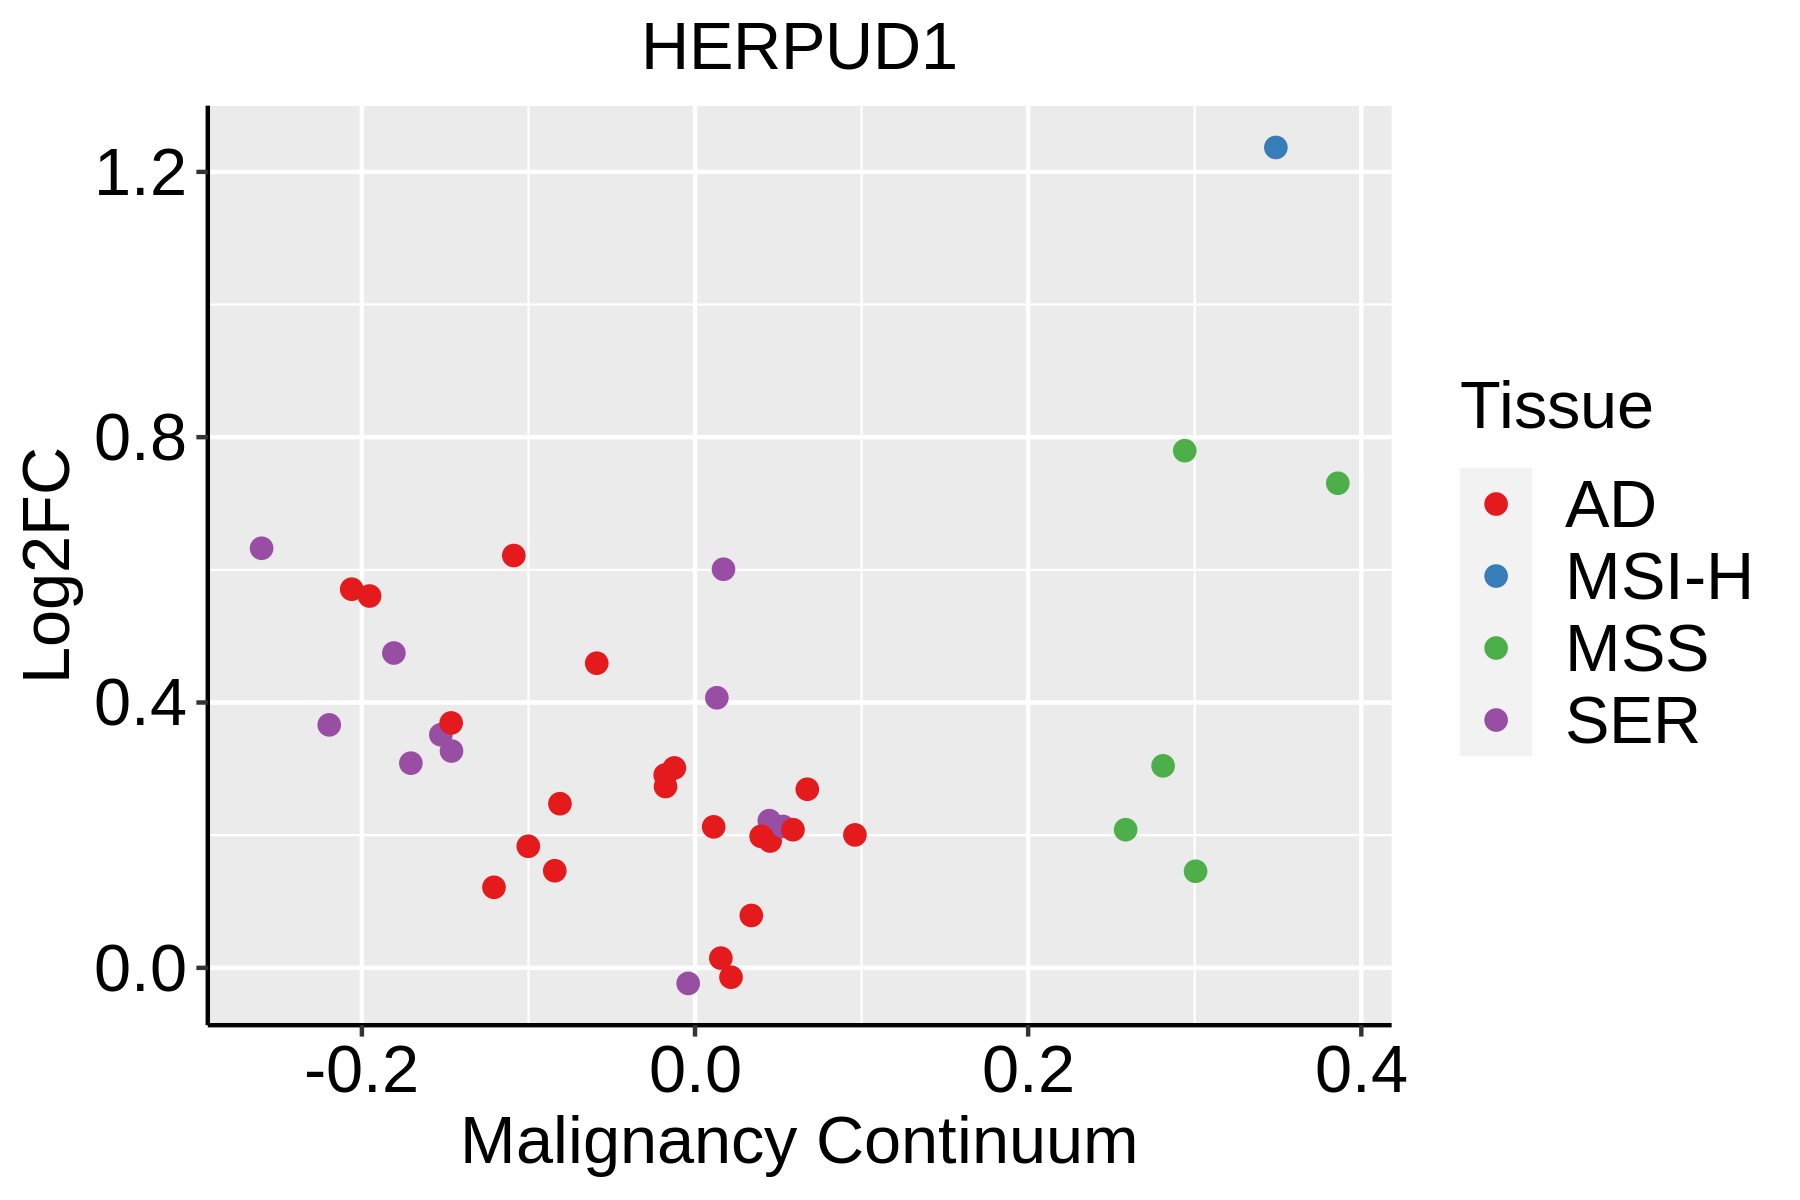 | AD: Adenomas |
| SER: Sessile serrated lesions |
| MSI-H: Microsatellite-high colorectal cancer |
| MSS: Microsatellite stable colorectal cancer |
| Endometrium |  | AEH: Atypical endometrial hyperplasia |
| EEC: Endometrioid Cancer |
| Esophagus | 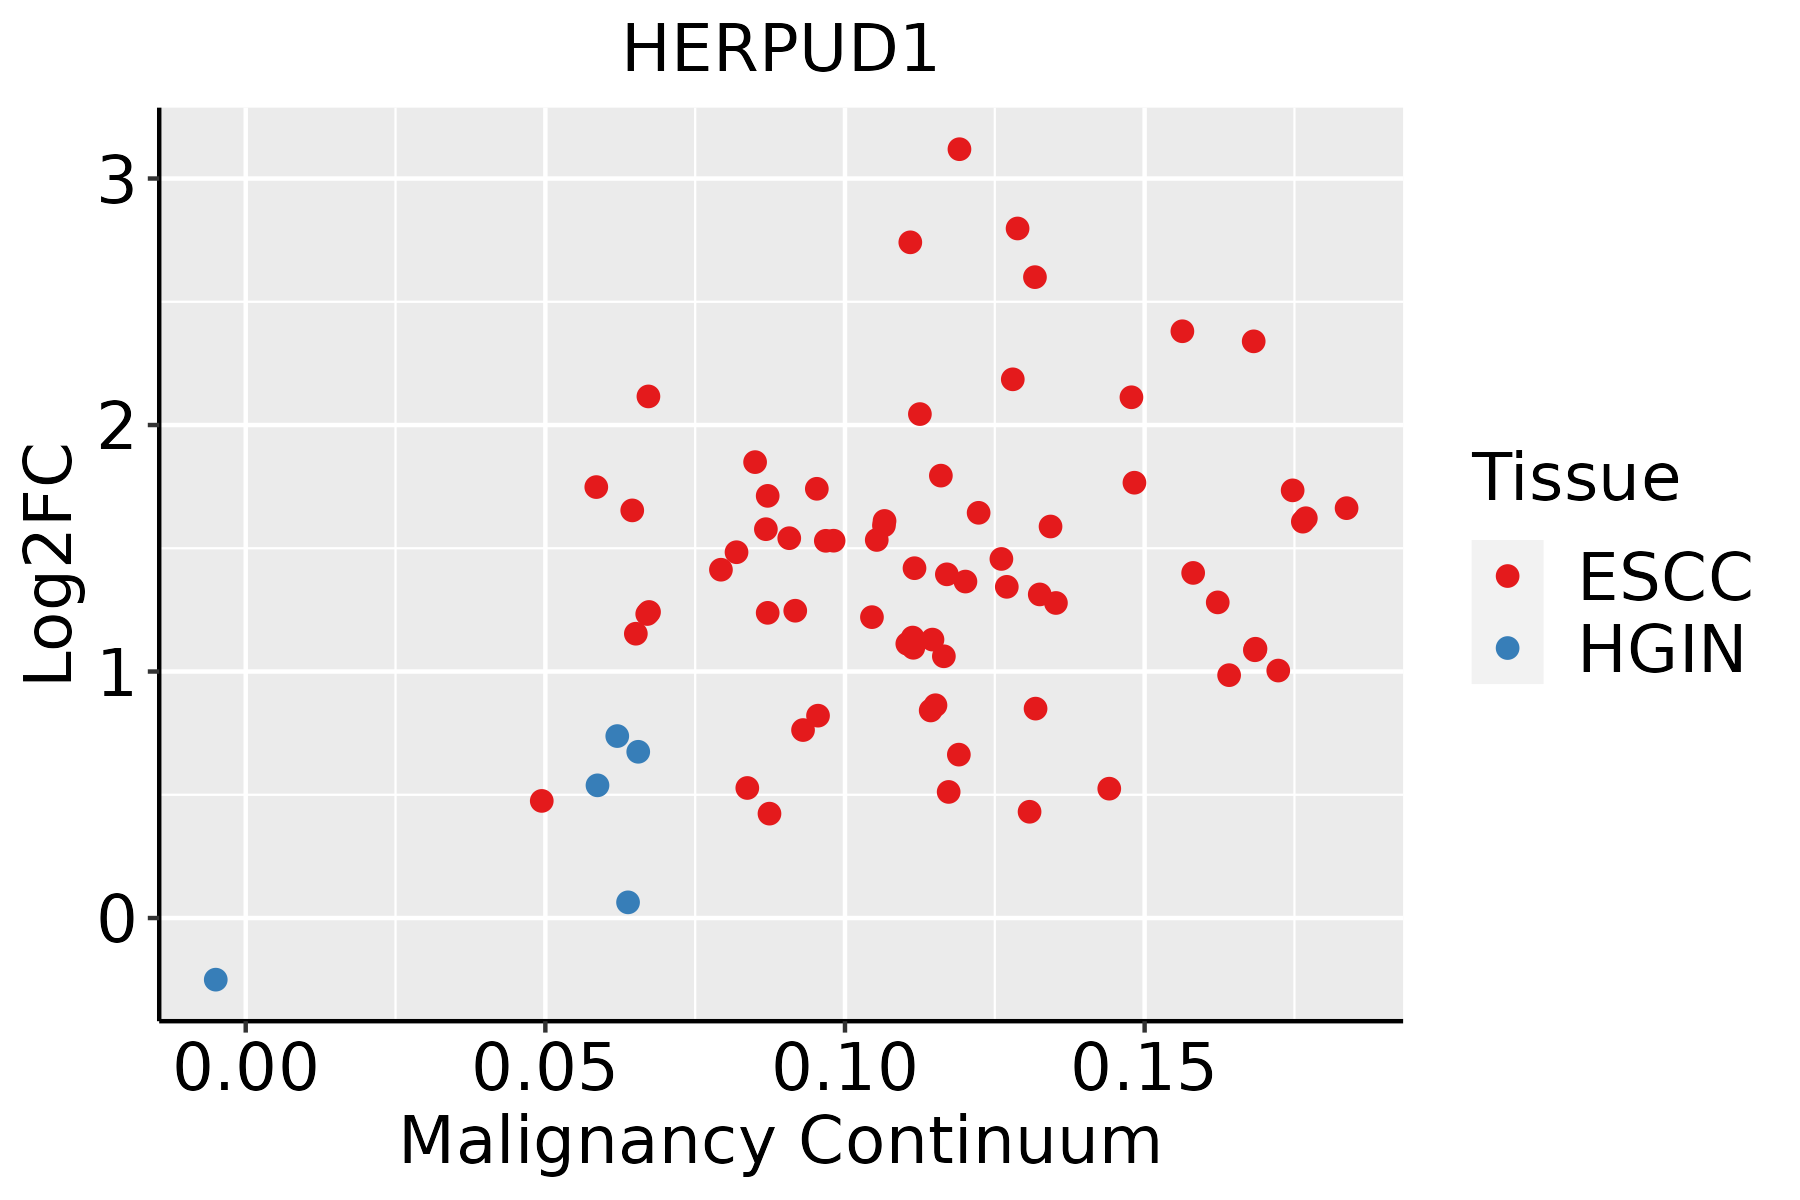 | ESCC: Esophageal squamous cell carcinoma |
| HGIN: High-grade intraepithelial neoplasias |
| LGIN: Low-grade intraepithelial neoplasias |
| Liver | 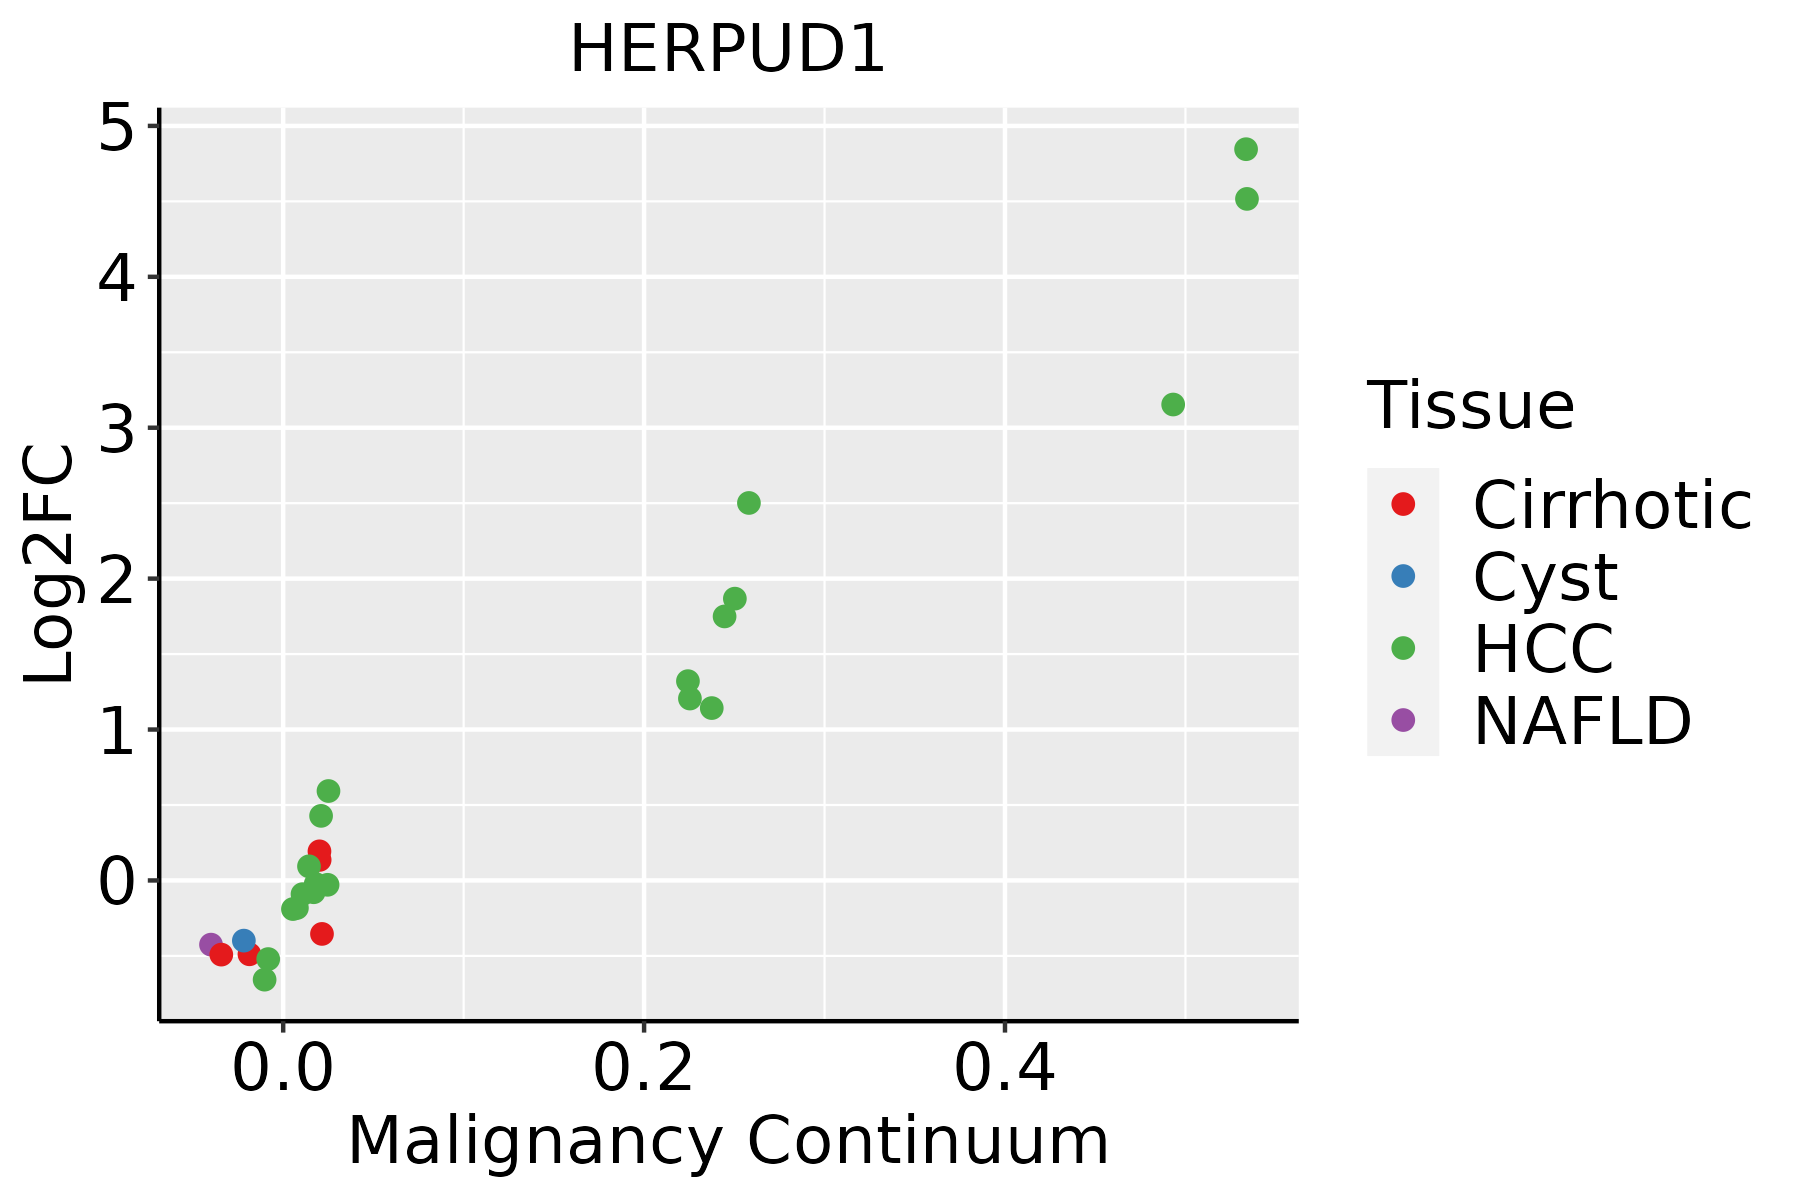 | HCC: Hepatocellular carcinoma |
| NAFLD: Non-alcoholic fatty liver disease |
| Lung | 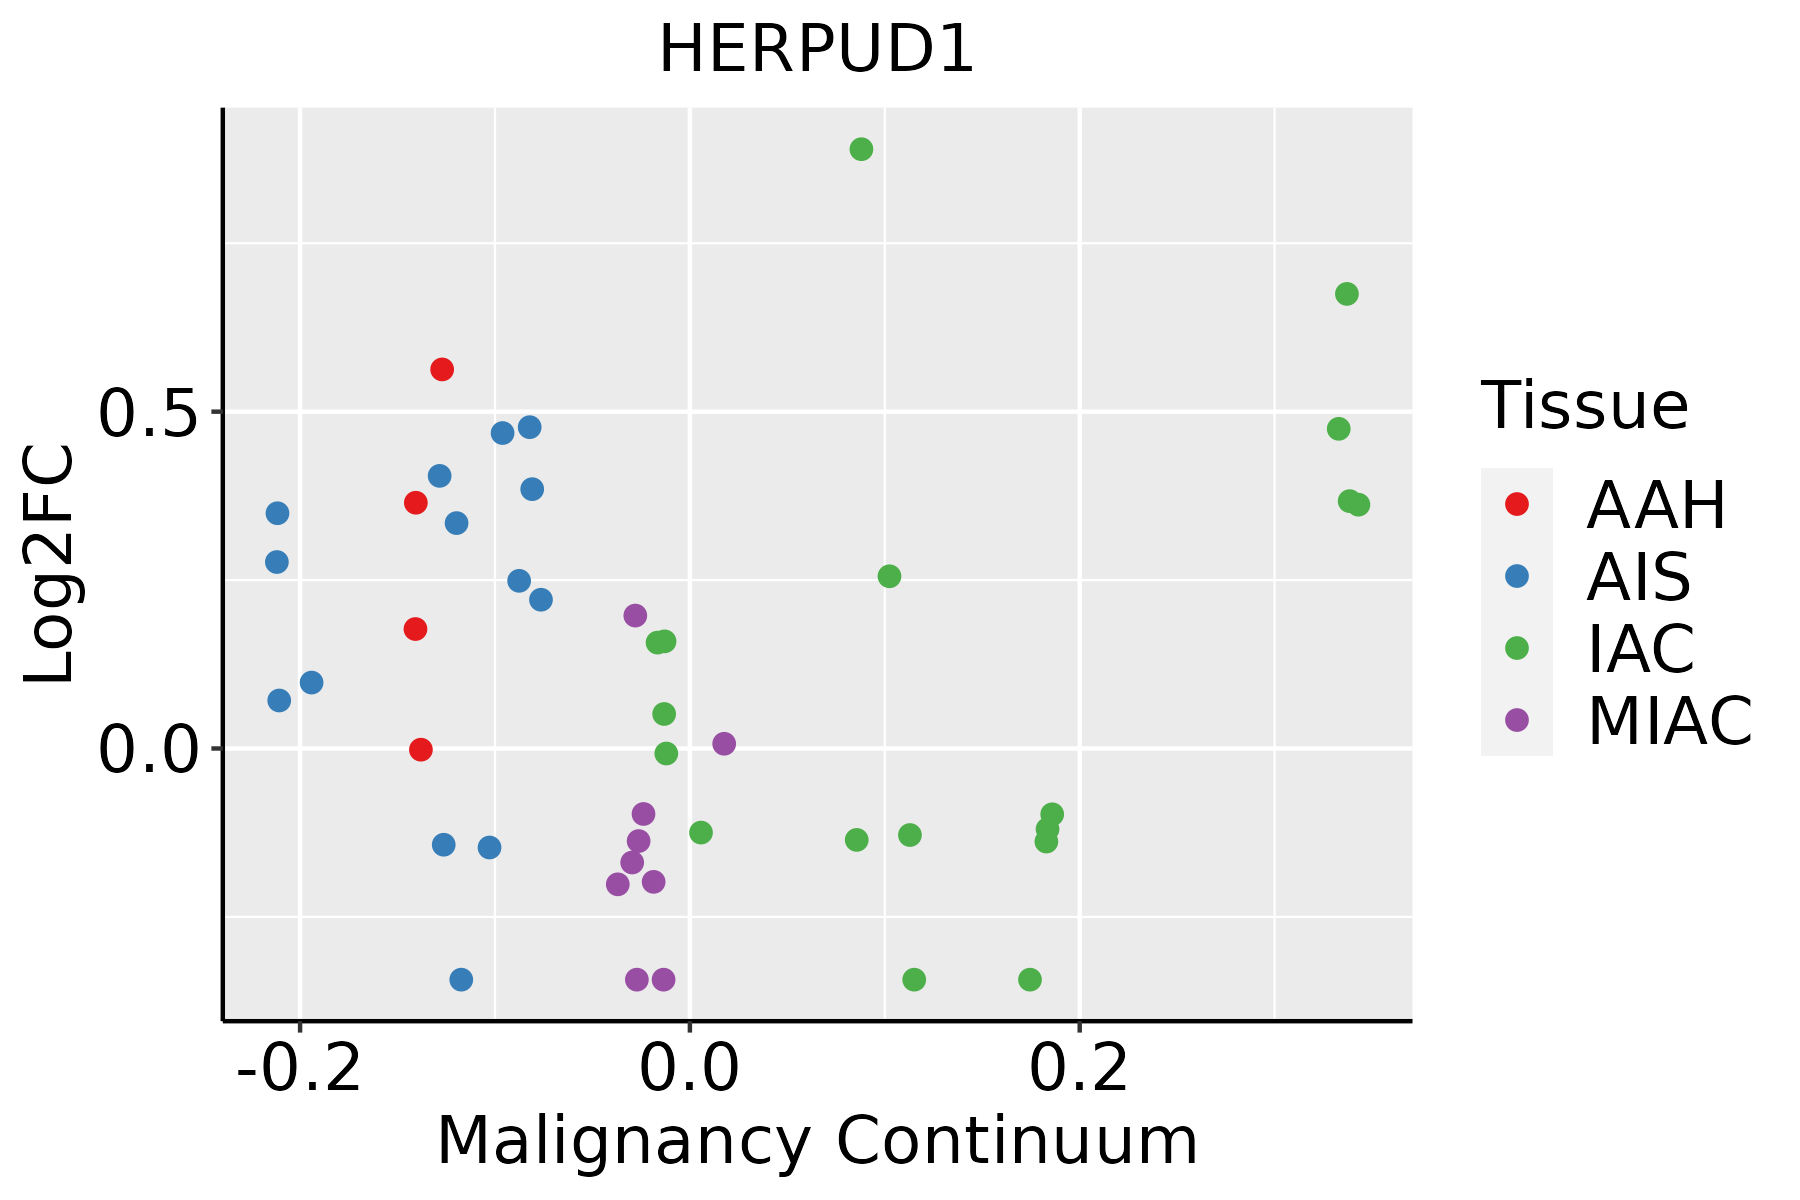 | AAH: Atypical adenomatous hyperplasia |
| AIS: Adenocarcinoma in situ |
| IAC: Invasive lung adenocarcinoma |
| MIA: Minimally invasive adenocarcinoma |
| Oral Cavity | 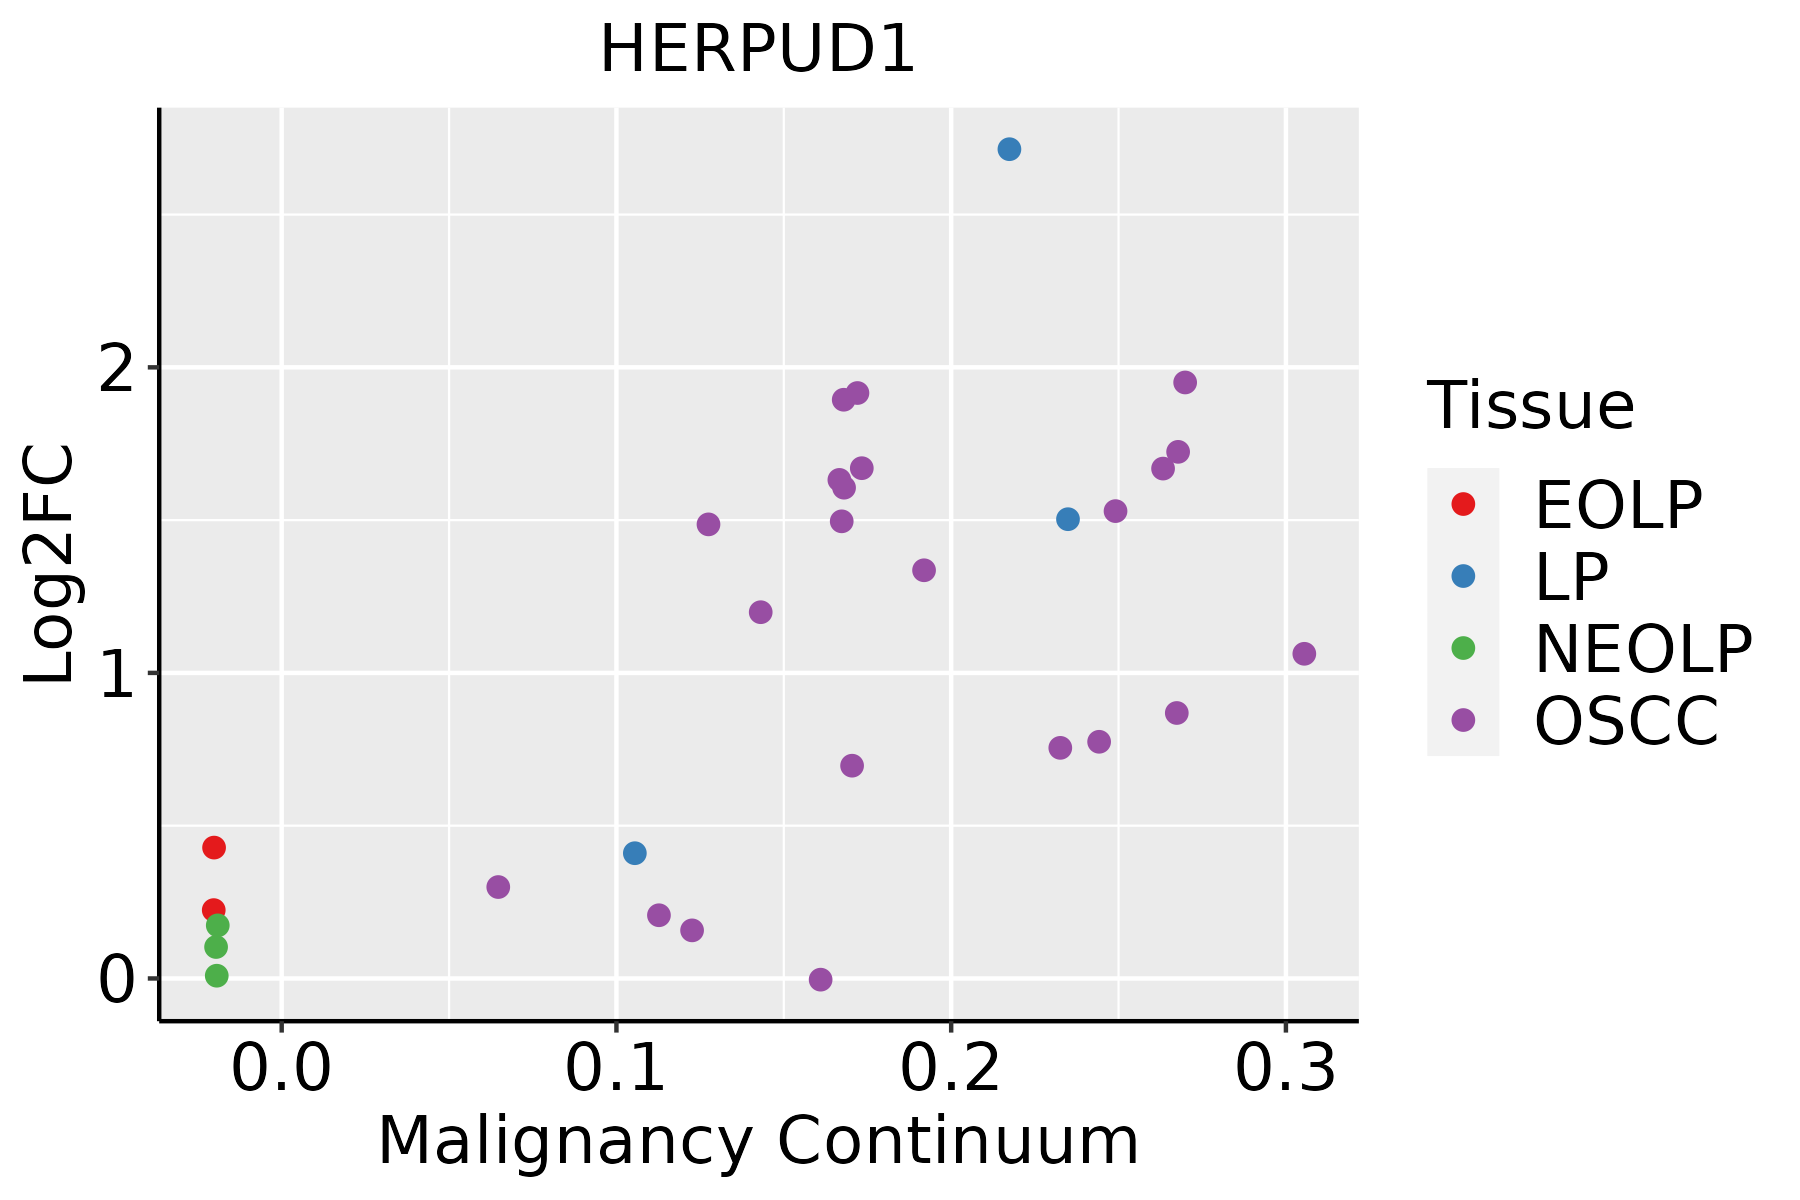 | EOLP: Erosive Oral lichen planus |
| LP: leukoplakia |
| NEOLP: Non-erosive oral lichen planus |
| OSCC: Oral squamous cell carcinoma |
| Prostate |  | BPH: Benign Prostatic Hyperplasia |
| Skin | 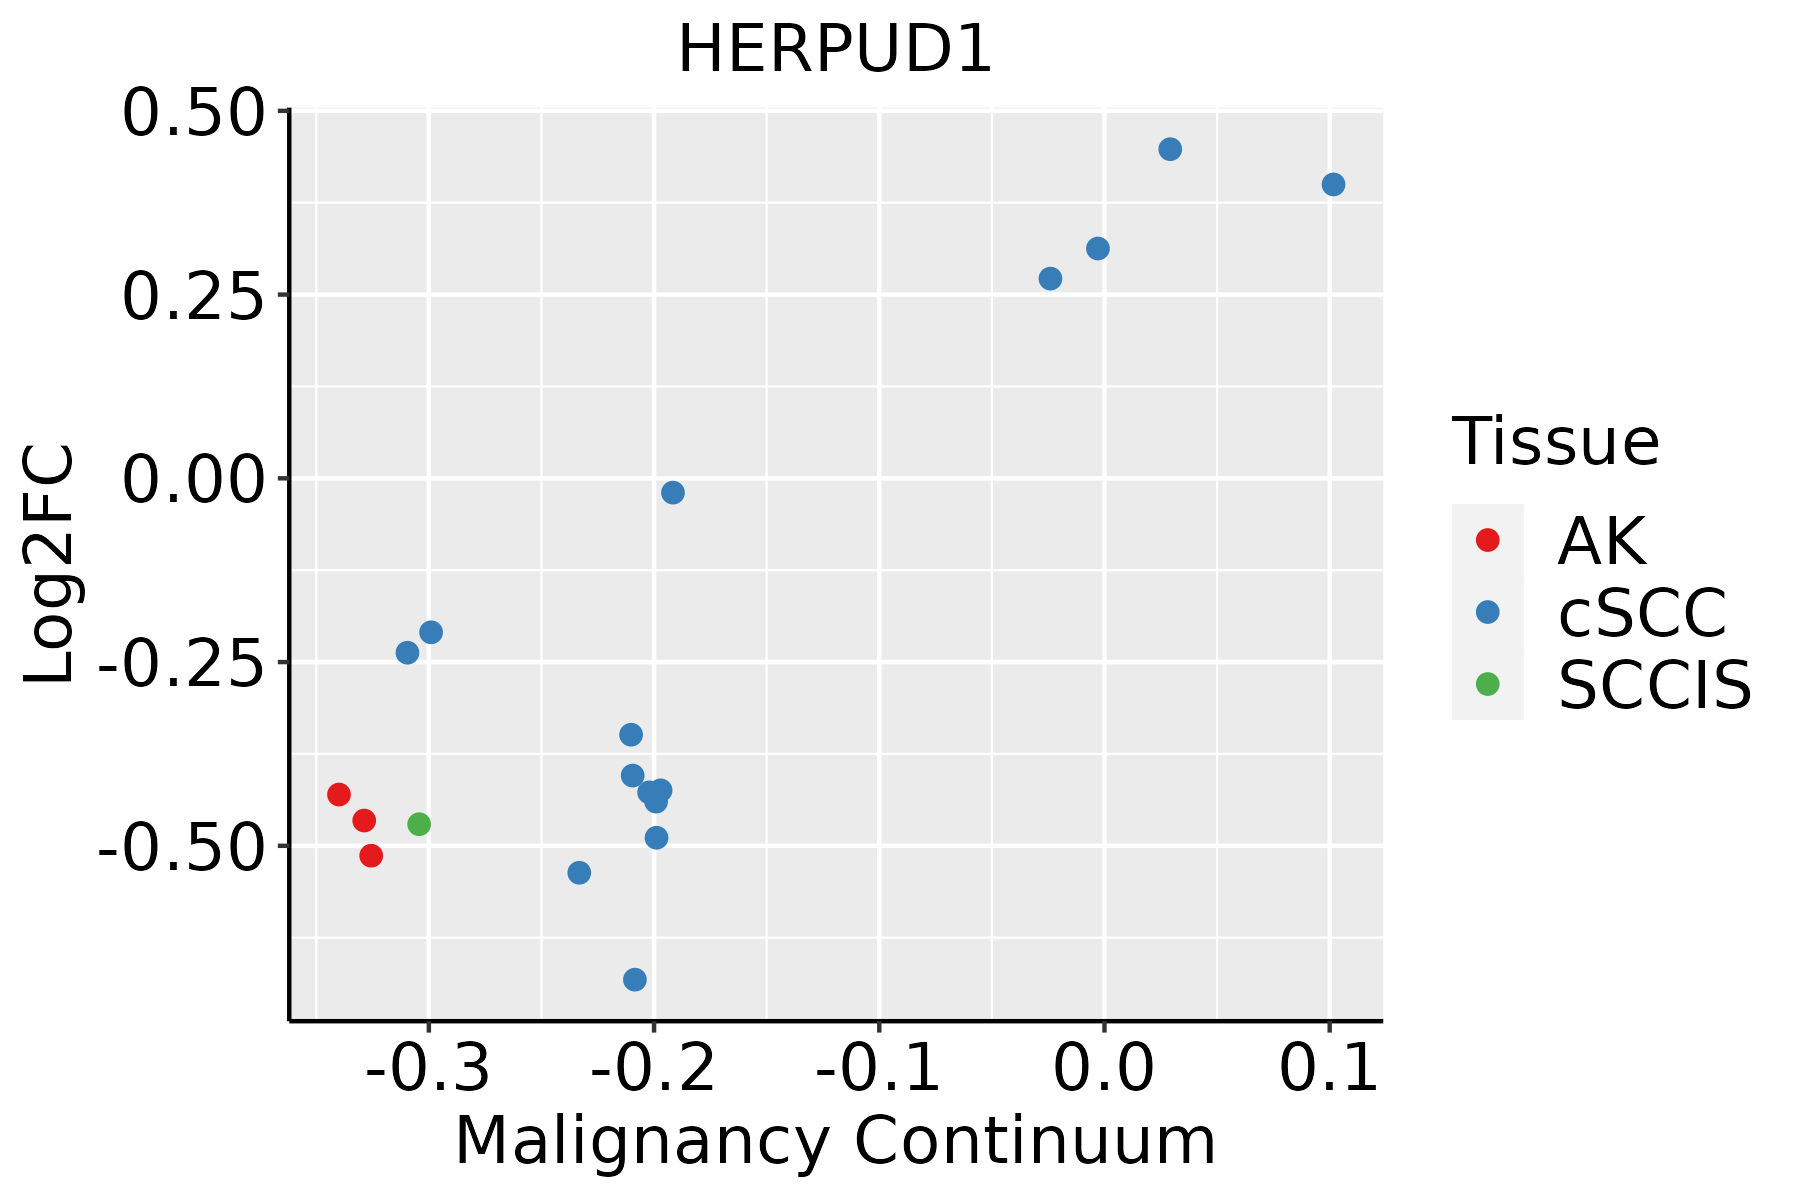 | AK: Actinic keratosis |
| cSCC: Cutaneous squamous cell carcinoma |
| SCCIS:squamous cell carcinoma in situ |
| Thyroid | 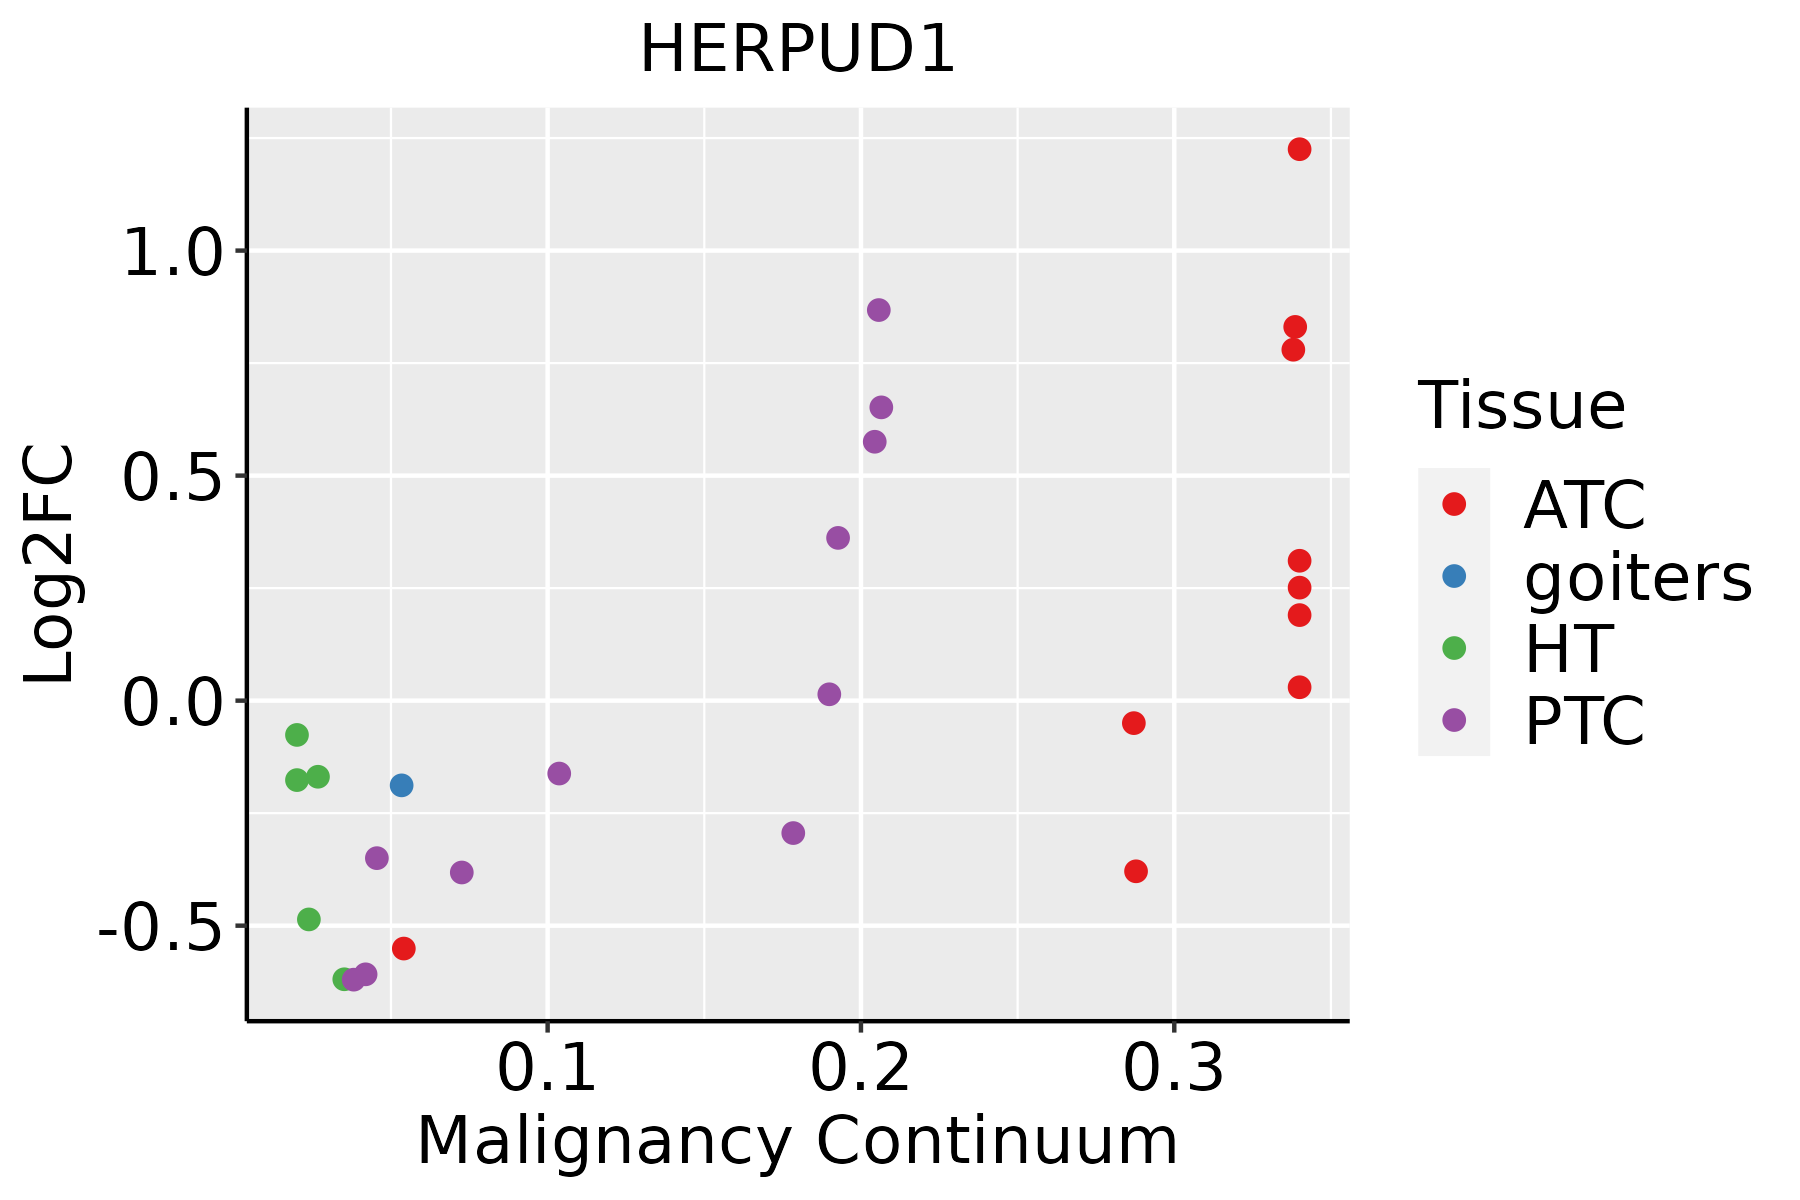 | ATC: Anaplastic thyroid cancer |
| HT: Hashimoto's thyroiditis |
| PTC: Papillary thyroid cancer |
| GO ID | Tissue | Disease Stage | Description | Gene Ratio | Bg Ratio | pvalue | p.adjust | Count |
| GO:20000608 | Lung | IAC | positive regulation of ubiquitin-dependent protein catabolic process | 30/2061 | 107/18723 | 9.37e-07 | 5.20e-05 | 30 |
| GO:00431618 | Lung | IAC | proteasome-mediated ubiquitin-dependent protein catabolic process | 78/2061 | 412/18723 | 1.10e-06 | 6.02e-05 | 78 |
| GO:19030526 | Lung | IAC | positive regulation of proteolysis involved in cellular protein catabolic process | 33/2061 | 133/18723 | 5.33e-06 | 2.08e-04 | 33 |
| GO:20012438 | Lung | IAC | negative regulation of intrinsic apoptotic signaling pathway | 26/2061 | 98/18723 | 1.45e-05 | 4.31e-04 | 26 |
| GO:20001168 | Lung | IAC | regulation of cysteine-type endopeptidase activity | 48/2061 | 235/18723 | 1.65e-05 | 4.73e-04 | 48 |
| GO:00525478 | Lung | IAC | regulation of peptidase activity | 80/2061 | 461/18723 | 2.39e-05 | 6.50e-04 | 80 |
| GO:00611368 | Lung | IAC | regulation of proteasomal protein catabolic process | 40/2061 | 187/18723 | 2.71e-05 | 7.24e-04 | 40 |
| GO:00324367 | Lung | IAC | positive regulation of proteasomal ubiquitin-dependent protein catabolic process | 24/2061 | 90/18723 | 2.79e-05 | 7.29e-04 | 24 |
| GO:00432818 | Lung | IAC | regulation of cysteine-type endopeptidase activity involved in apoptotic process | 43/2061 | 209/18723 | 3.71e-05 | 9.14e-04 | 43 |
| GO:00525488 | Lung | IAC | regulation of endopeptidase activity | 75/2061 | 432/18723 | 4.18e-05 | 1.01e-03 | 75 |
| GO:00324348 | Lung | IAC | regulation of proteasomal ubiquitin-dependent protein catabolic process | 31/2061 | 134/18723 | 4.44e-05 | 1.05e-03 | 31 |
| GO:19018006 | Lung | IAC | positive regulation of proteasomal protein catabolic process | 27/2061 | 114/18723 | 8.78e-05 | 1.77e-03 | 27 |
| GO:00700597 | Lung | IAC | intrinsic apoptotic signaling pathway in response to endoplasmic reticulum stress | 18/2061 | 63/18723 | 1.04e-04 | 2.02e-03 | 18 |
| GO:00349768 | Lung | IAC | response to endoplasmic reticulum stress | 46/2061 | 256/18723 | 5.58e-04 | 7.76e-03 | 46 |
| GO:00458618 | Lung | IAC | negative regulation of proteolysis | 58/2061 | 351/18723 | 1.04e-03 | 1.24e-02 | 58 |
| GO:00359668 | Lung | IAC | response to topologically incorrect protein | 31/2061 | 159/18723 | 1.10e-03 | 1.29e-02 | 31 |
| GO:00359678 | Lung | IAC | cellular response to topologically incorrect protein | 24/2061 | 116/18723 | 1.66e-03 | 1.74e-02 | 24 |
| GO:00069868 | Lung | IAC | response to unfolded protein | 27/2061 | 137/18723 | 1.88e-03 | 1.92e-02 | 27 |
| GO:20001178 | Lung | IAC | negative regulation of cysteine-type endopeptidase activity | 19/2061 | 86/18723 | 2.22e-03 | 2.18e-02 | 19 |
| GO:00066058 | Lung | IAC | protein targeting | 51/2061 | 314/18723 | 2.91e-03 | 2.61e-02 | 51 |
| Pathway ID | Tissue | Disease Stage | Description | Gene Ratio | Bg Ratio | pvalue | p.adjust | qvalue | Count |
| hsa0414124 | Breast | IDC | Protein processing in endoplasmic reticulum | 36/867 | 174/8465 | 2.73e-05 | 2.86e-04 | 2.14e-04 | 36 |
| hsa0414134 | Breast | IDC | Protein processing in endoplasmic reticulum | 36/867 | 174/8465 | 2.73e-05 | 2.86e-04 | 2.14e-04 | 36 |
| hsa0414143 | Breast | DCIS | Protein processing in endoplasmic reticulum | 36/846 | 174/8465 | 1.60e-05 | 1.91e-04 | 1.41e-04 | 36 |
| hsa0414153 | Breast | DCIS | Protein processing in endoplasmic reticulum | 36/846 | 174/8465 | 1.60e-05 | 1.91e-04 | 1.41e-04 | 36 |
| hsa0414120 | Cervix | CC | Protein processing in endoplasmic reticulum | 55/1267 | 174/8465 | 1.74e-08 | 2.68e-07 | 1.58e-07 | 55 |
| hsa04141110 | Cervix | CC | Protein processing in endoplasmic reticulum | 55/1267 | 174/8465 | 1.74e-08 | 2.68e-07 | 1.58e-07 | 55 |
| hsa0414125 | Cervix | HSIL_HPV | Protein processing in endoplasmic reticulum | 21/459 | 174/8465 | 4.54e-04 | 3.80e-03 | 3.07e-03 | 21 |
| hsa0414135 | Cervix | HSIL_HPV | Protein processing in endoplasmic reticulum | 21/459 | 174/8465 | 4.54e-04 | 3.80e-03 | 3.07e-03 | 21 |
| hsa0414144 | Cervix | N_HPV | Protein processing in endoplasmic reticulum | 21/349 | 174/8465 | 8.84e-06 | 1.09e-04 | 8.55e-05 | 21 |
| hsa0414154 | Cervix | N_HPV | Protein processing in endoplasmic reticulum | 21/349 | 174/8465 | 8.84e-06 | 1.09e-04 | 8.55e-05 | 21 |
| hsa04141 | Colorectum | AD | Protein processing in endoplasmic reticulum | 80/2092 | 174/8465 | 5.96e-10 | 1.25e-08 | 7.96e-09 | 80 |
| hsa041411 | Colorectum | AD | Protein processing in endoplasmic reticulum | 80/2092 | 174/8465 | 5.96e-10 | 1.25e-08 | 7.96e-09 | 80 |
| hsa041412 | Colorectum | SER | Protein processing in endoplasmic reticulum | 60/1580 | 174/8465 | 4.20e-07 | 7.33e-06 | 5.32e-06 | 60 |
| hsa041413 | Colorectum | SER | Protein processing in endoplasmic reticulum | 60/1580 | 174/8465 | 4.20e-07 | 7.33e-06 | 5.32e-06 | 60 |
| hsa041414 | Colorectum | MSS | Protein processing in endoplasmic reticulum | 75/1875 | 174/8465 | 3.78e-10 | 8.44e-09 | 5.17e-09 | 75 |
| hsa041415 | Colorectum | MSS | Protein processing in endoplasmic reticulum | 75/1875 | 174/8465 | 3.78e-10 | 8.44e-09 | 5.17e-09 | 75 |
| hsa041416 | Colorectum | MSI-H | Protein processing in endoplasmic reticulum | 46/797 | 174/8465 | 4.53e-11 | 9.78e-10 | 8.19e-10 | 46 |
| hsa041417 | Colorectum | MSI-H | Protein processing in endoplasmic reticulum | 46/797 | 174/8465 | 4.53e-11 | 9.78e-10 | 8.19e-10 | 46 |
| hsa0414127 | Endometrium | EEC | Protein processing in endoplasmic reticulum | 64/1237 | 174/8465 | 2.17e-13 | 5.09e-12 | 3.80e-12 | 64 |
| hsa0414136 | Endometrium | EEC | Protein processing in endoplasmic reticulum | 64/1237 | 174/8465 | 2.17e-13 | 5.09e-12 | 3.80e-12 | 64 |
| Hugo Symbol | Variant Class | Variant Classification | dbSNP RS | HGVSc | HGVSp | HGVSp Short | SWISSPROT | BIOTYPE | SIFT | PolyPhen | Tumor Sample Barcode | Tissue | Histology | Sex | Age | Stage | Therapy Types | Drugs | Outcome |
| HERPUD1 | SNV | Missense_Mutation | rs370880807 | c.1168G>A | p.Ala390Thr | p.A390T | Q15011 | protein_coding | tolerated(0.08) | benign(0.17) | TCGA-AN-A046-01 | Breast | breast invasive carcinoma | Female | >=65 | I/II | Unknown | Unknown | SD |
| HERPUD1 | SNV | Missense_Mutation | rs527424441 | c.394N>T | p.Arg132Trp | p.R132W | Q15011 | protein_coding | tolerated(0.17) | benign(0.2) | TCGA-E2-A14S-01 | Breast | breast invasive carcinoma | Female | >=65 | I/II | Chemotherapy | cytoxan | SD |
| HERPUD1 | insertion | Frame_Shift_Ins | novel | c.1064_1065insTC | p.Val356LeufsTer3 | p.V356Lfs*3 | Q15011 | protein_coding | | | TCGA-A2-A0CX-01 | Breast | breast invasive carcinoma | Female | <65 | I/II | Chemotherapy | adriamycin | SD |
| HERPUD1 | insertion | In_Frame_Ins | novel | c.1066_1067insTAACAGTGTGTTATACCATAAGAACTGGTATGAAGTGGT | p.Val356_Leu357insThrValCysTyrThrIleArgThrGlyMetLysTrpLeu | p.V356_L357insTVCYTIRTGMKWL | Q15011 | protein_coding | | | TCGA-A2-A0CX-01 | Breast | breast invasive carcinoma | Female | <65 | I/II | Chemotherapy | adriamycin | SD |
| HERPUD1 | insertion | Nonsense_Mutation | novel | c.1155_1156insAATAAATTAGGAACCTCTTGAATTAT | p.Pro386AsnfsTer7 | p.P386Nfs*7 | Q15011 | protein_coding | | | TCGA-AN-A0FX-01 | Breast | breast invasive carcinoma | Female | <65 | I/II | Unknown | Unknown | SD |
| HERPUD1 | insertion | Nonsense_Mutation | novel | c.879_880insTAAAATCTCCTTCATGAGATTGCTGTGGACCCAGCAGCCTGTACAGG | p.Met294Ter | p.M294* | Q15011 | protein_coding | | | TCGA-AO-A0JB-01 | Breast | breast invasive carcinoma | Female | <65 | III/IV | Chemotherapy | cyclophosphamide | SD |
| HERPUD1 | deletion | Frame_Shift_Del | novel | c.823delT | p.Ser275LeufsTer13 | p.S275Lfs*13 | Q15011 | protein_coding | | | TCGA-D8-A27V-01 | Breast | breast invasive carcinoma | Female | <65 | I/II | Hormone Therapy | tamoxiphen | SD |
| HERPUD1 | SNV | Missense_Mutation | novel | c.950A>C | p.Asn317Thr | p.N317T | Q15011 | protein_coding | tolerated(0.17) | benign(0.096) | TCGA-2W-A8YY-01 | Cervix | cervical & endocervical cancer | Female | <65 | I/II | Chemotherapy | cisplatin | CR |
| HERPUD1 | SNV | Missense_Mutation | | c.916G>T | p.Gly306Trp | p.G306W | Q15011 | protein_coding | deleterious(0) | probably_damaging(1) | TCGA-C5-A2LX-01 | Cervix | cervical & endocervical cancer | Female | <65 | I/II | Chemotherapy | cisplatin | SD |
| HERPUD1 | SNV | Missense_Mutation | | c.886N>A | p.Ala296Thr | p.A296T | Q15011 | protein_coding | deleterious(0.05) | possibly_damaging(0.86) | TCGA-AA-3715-01 | Colorectum | colon adenocarcinoma | Male | >=65 | I/II | Unknown | Unknown | PD |


