| Tissue | Expression Dynamics | Abbreviation |
| Breast | 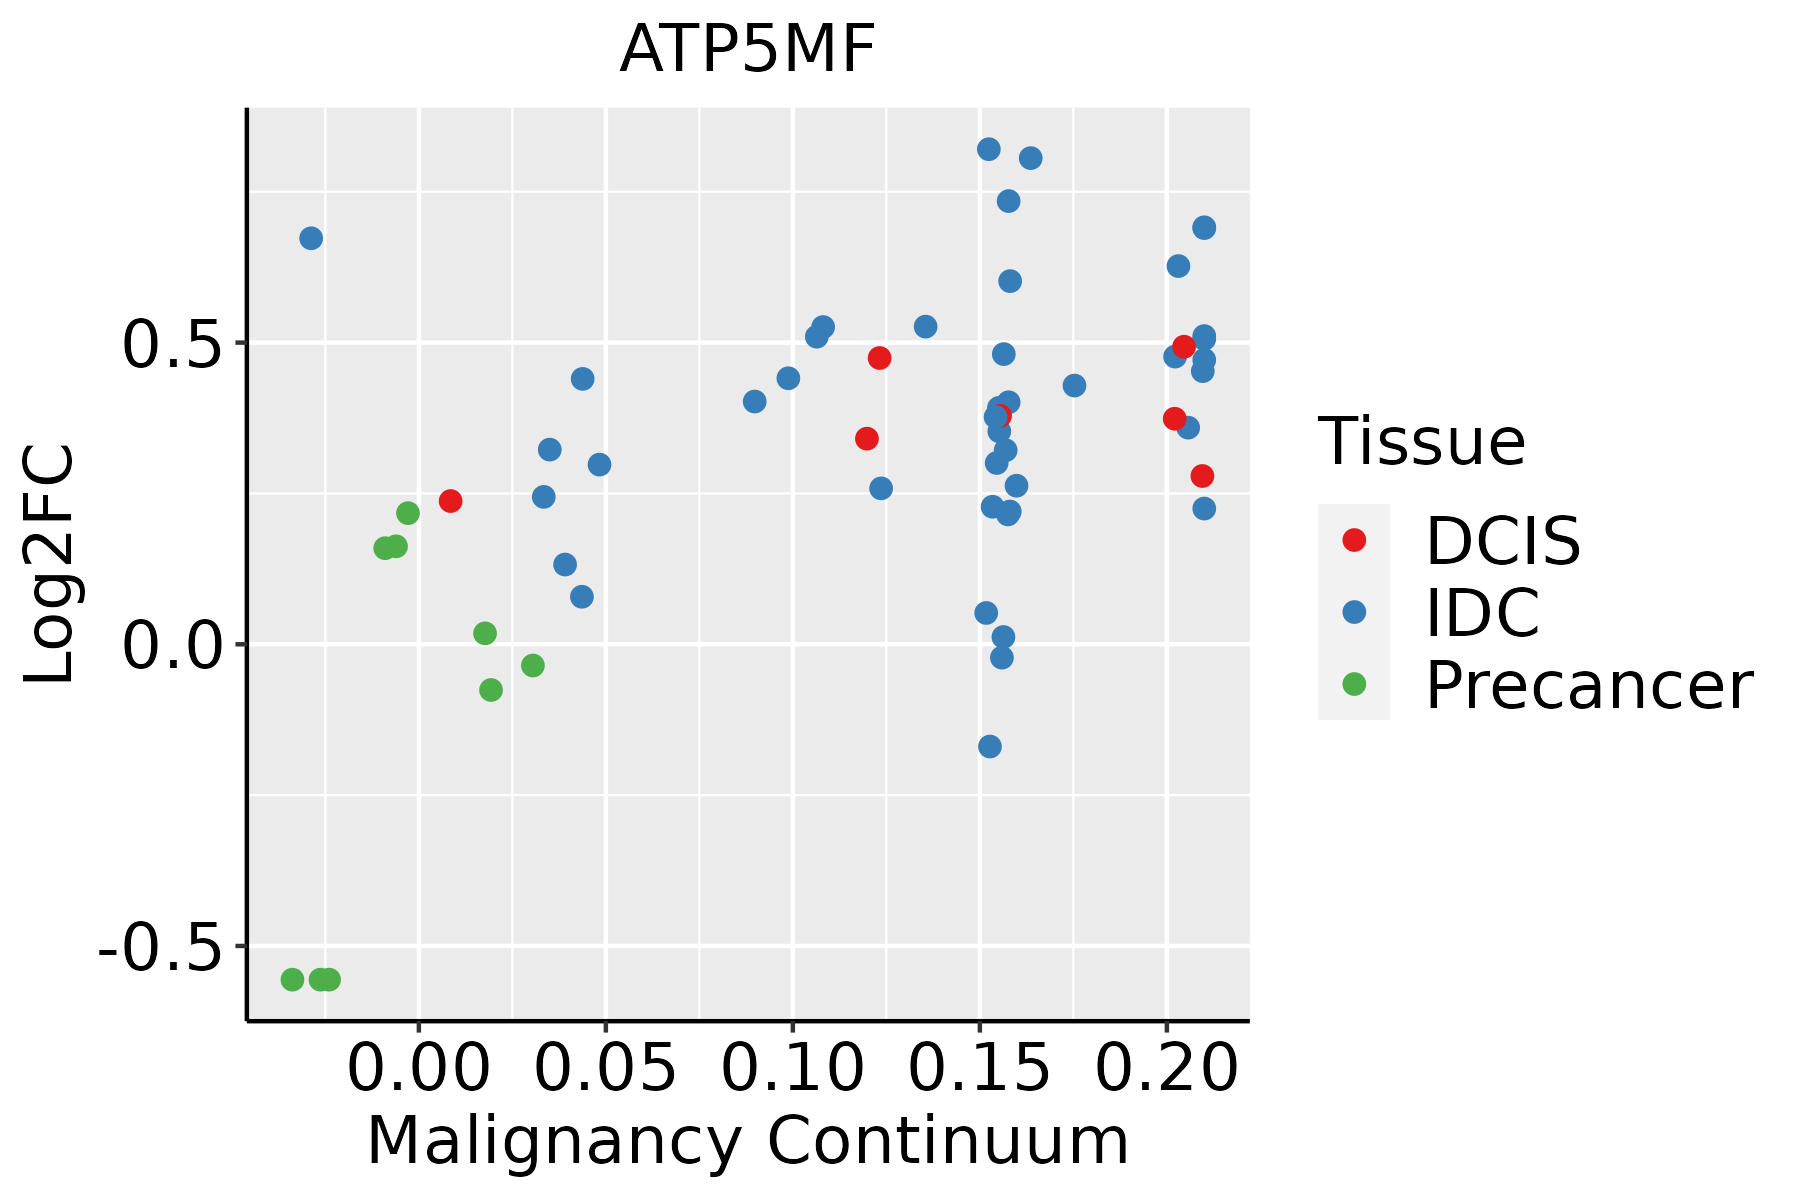 | IDC: Invasive ductal carcinoma |
| DCIS: Ductal carcinoma in situ |
| Precancer(BRCA1-mut): Precancerous lesion from BRCA1 mutation carriers |
| Cervix | 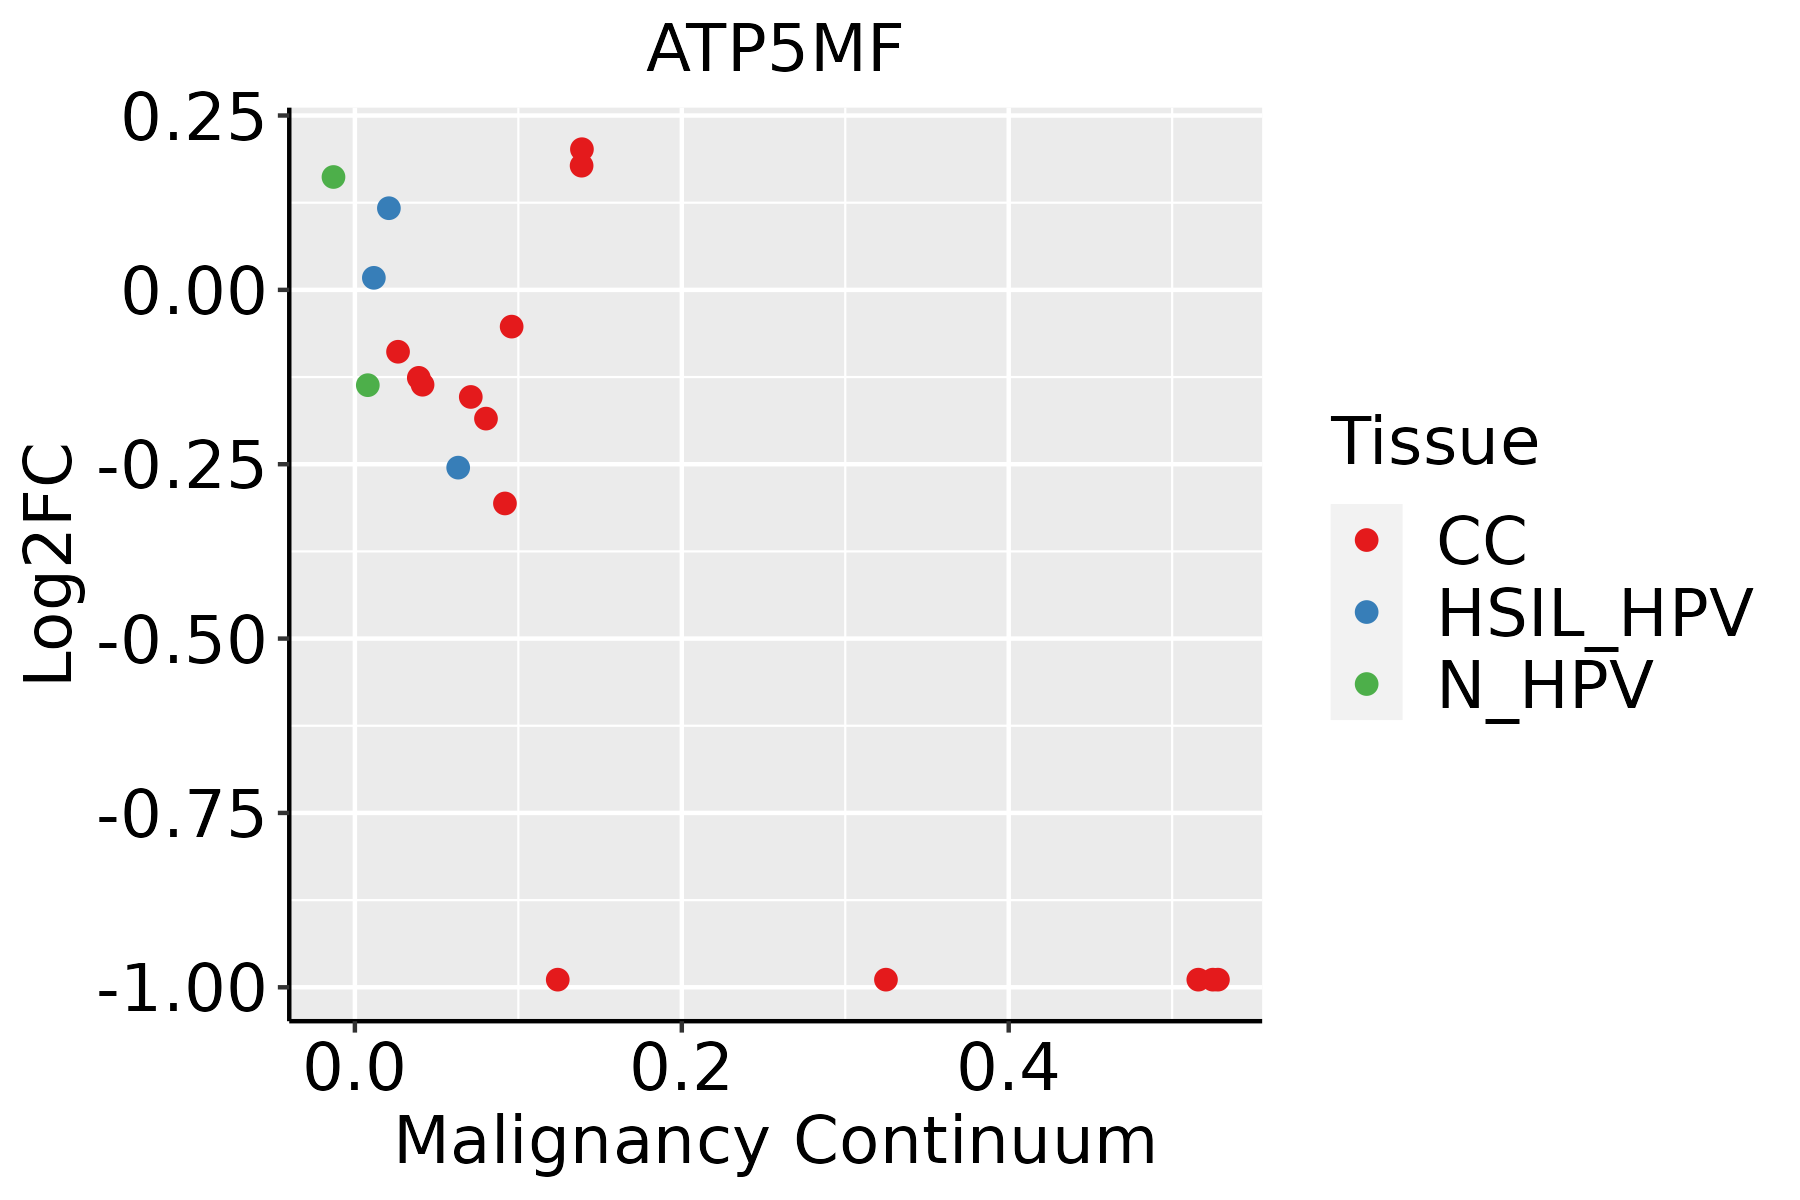 | CC: Cervix cancer |
| HSIL_HPV: HPV-infected high-grade squamous intraepithelial lesions |
| N_HPV: HPV-infected normal cervix |
| Colorectum (GSE201348) |  | FAP: Familial adenomatous polyposis |
| CRC: Colorectal cancer |
| Colorectum (HTA11) | 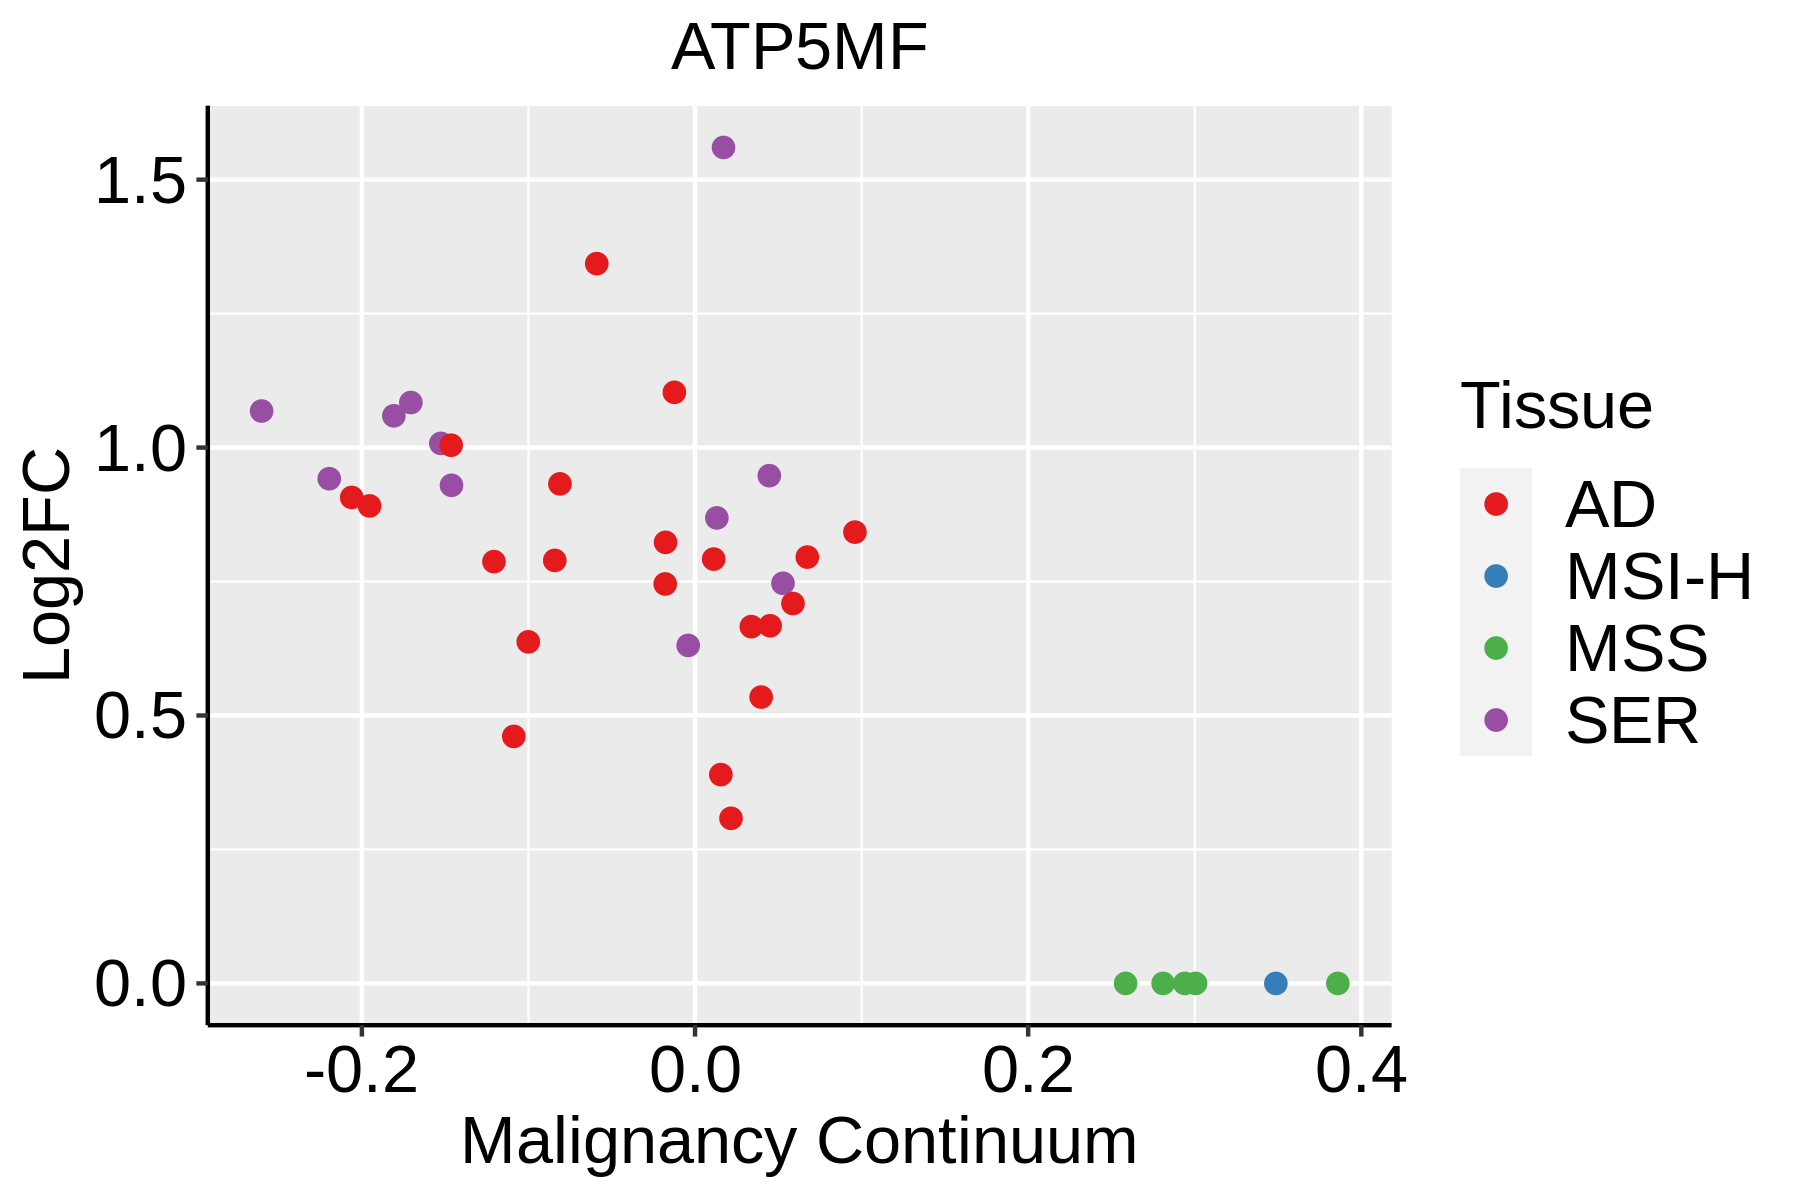 | AD: Adenomas |
| SER: Sessile serrated lesions |
| MSI-H: Microsatellite-high colorectal cancer |
| MSS: Microsatellite stable colorectal cancer |
| Endometrium |  | AEH: Atypical endometrial hyperplasia |
| EEC: Endometrioid Cancer |
| Esophagus | 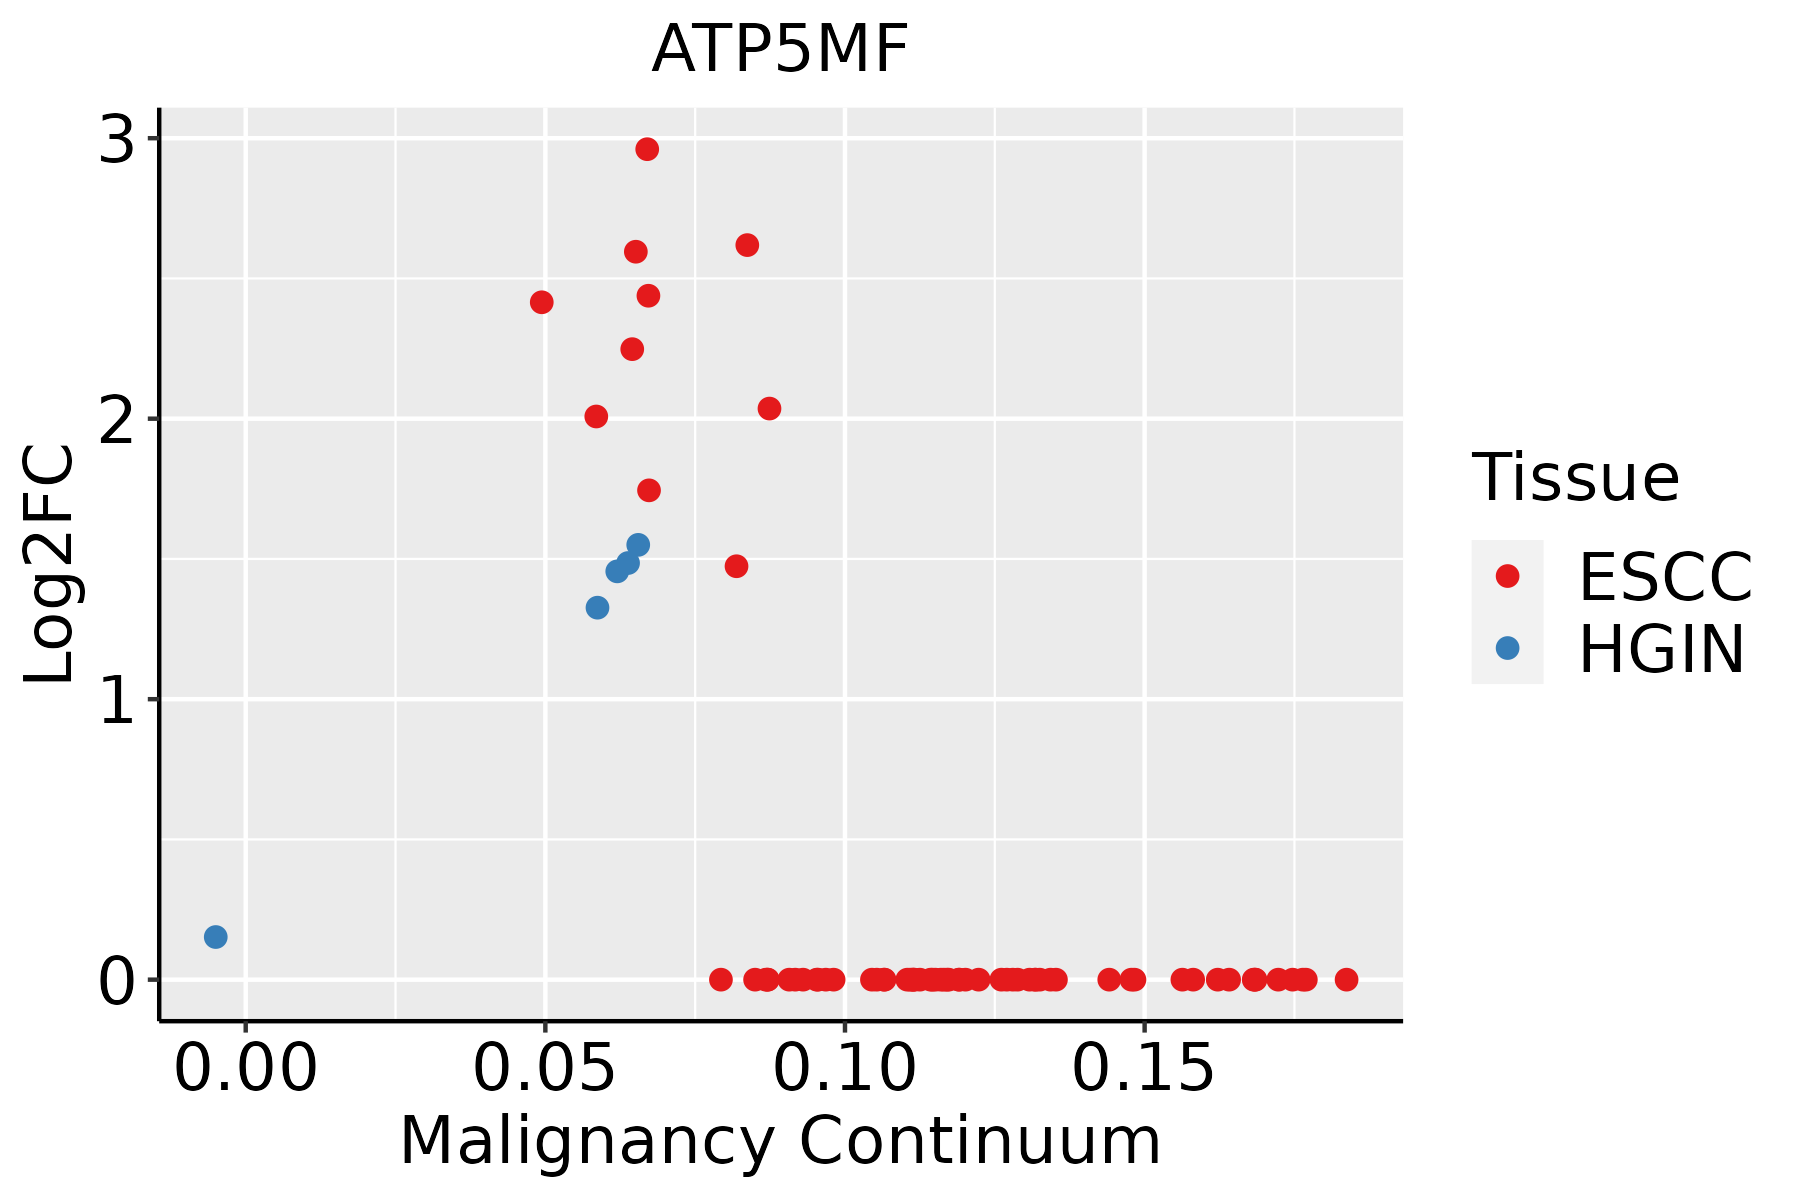 | ESCC: Esophageal squamous cell carcinoma |
| HGIN: High-grade intraepithelial neoplasias |
| LGIN: Low-grade intraepithelial neoplasias |
| GC | 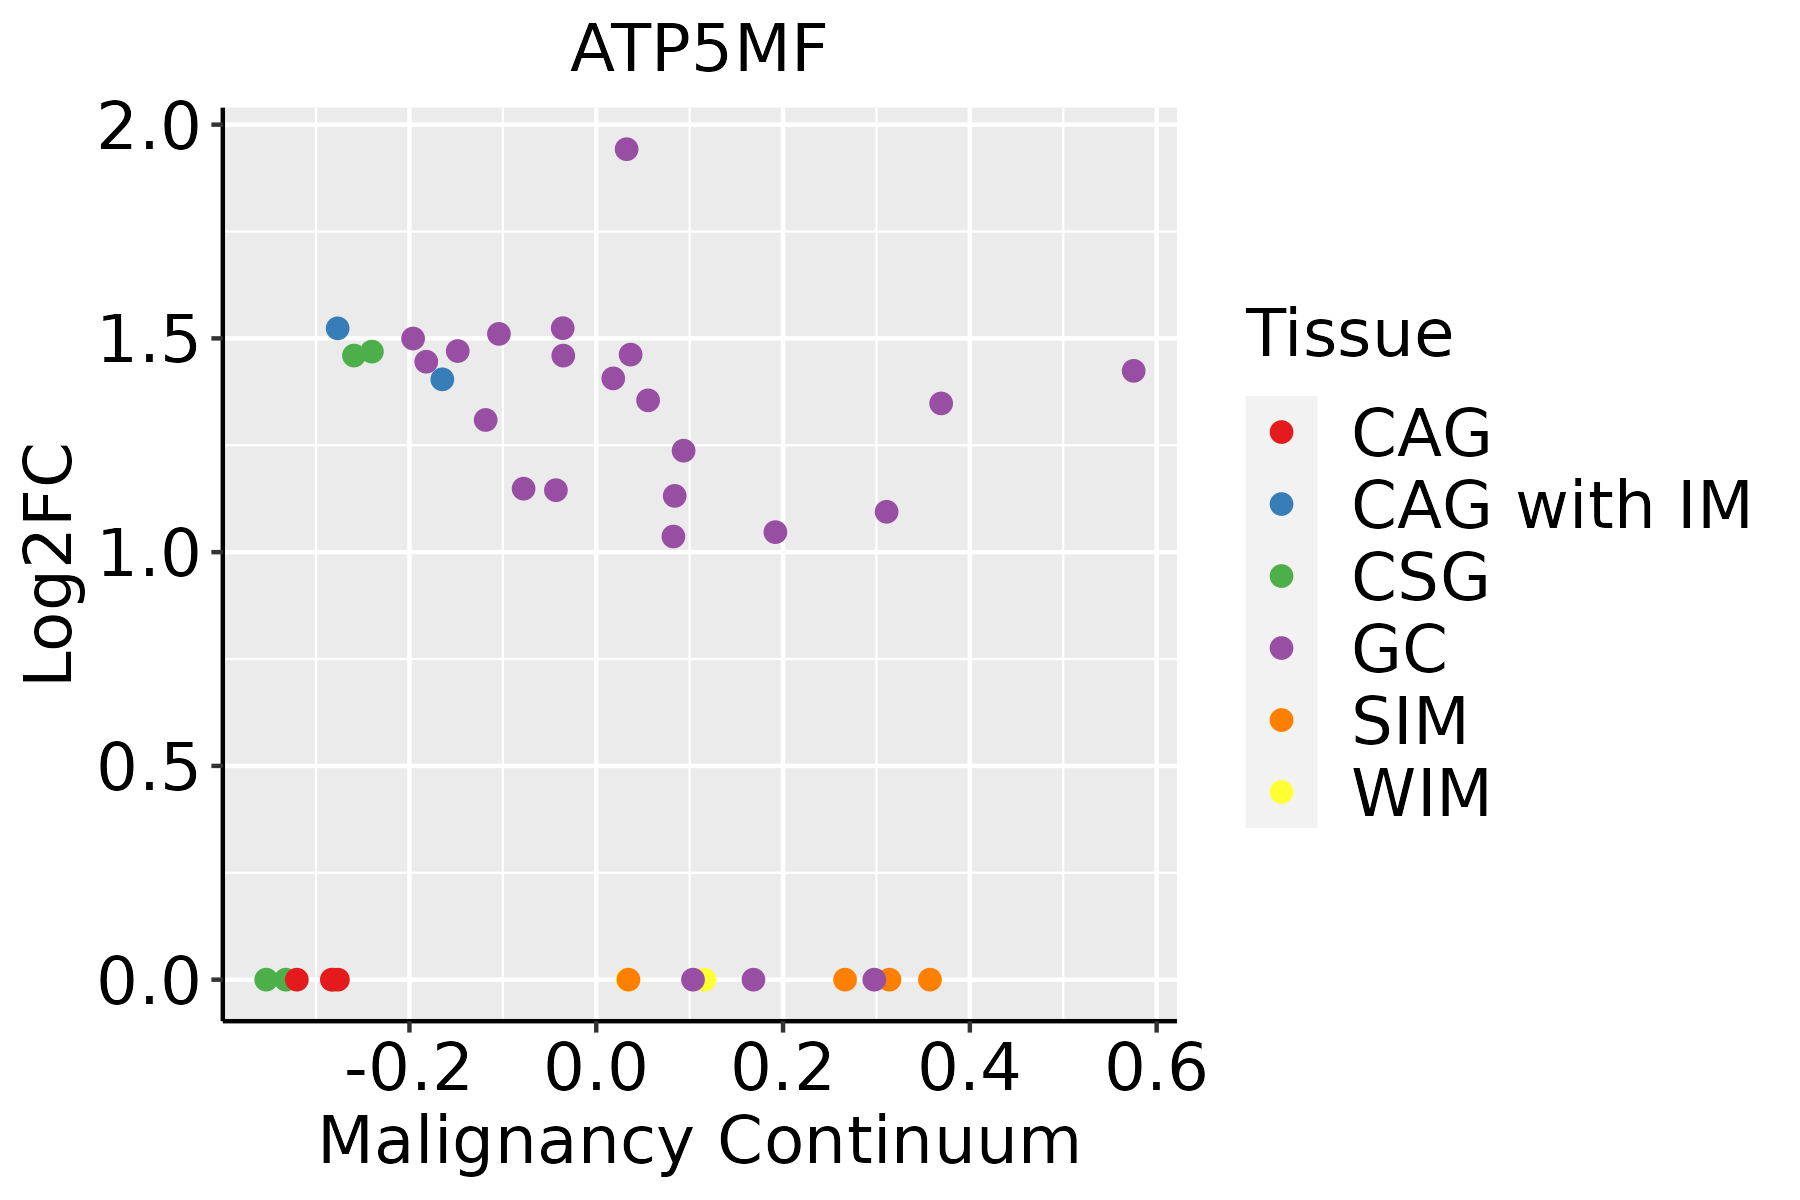 | CAG: Chronic atrophic gastritis |
| CAG with IM: Chronic atrophic gastritis with intestinal metaplasia |
| CSG: Chronic superficial gastritis |
| GC: Gastric cancer |
| SIM: Severe intestinal metaplasia |
| WIM: Wild intestinal metaplasia |
| Liver | 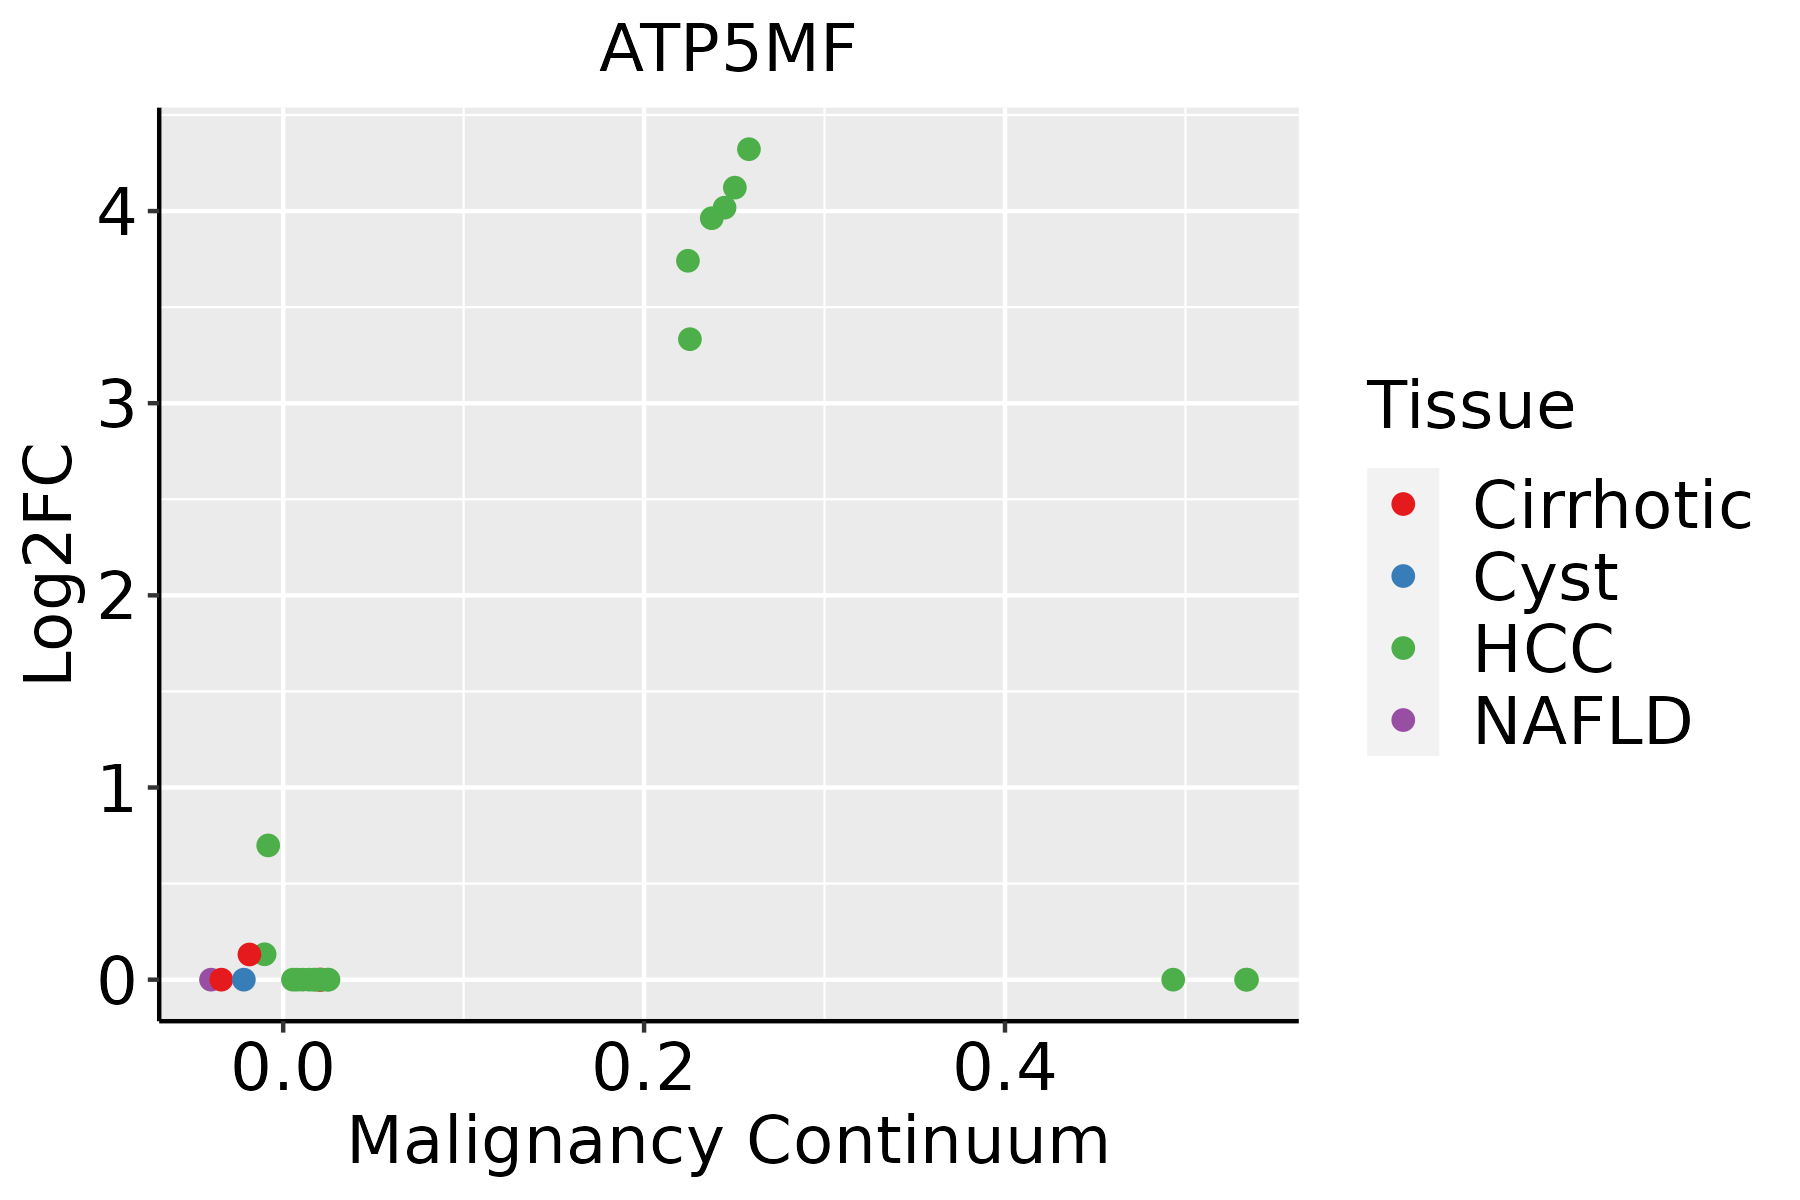 | HCC: Hepatocellular carcinoma |
| NAFLD: Non-alcoholic fatty liver disease |
| Lung |  | AAH: Atypical adenomatous hyperplasia |
| AIS: Adenocarcinoma in situ |
| IAC: Invasive lung adenocarcinoma |
| MIA: Minimally invasive adenocarcinoma |
| Prostate |  | BPH: Benign Prostatic Hyperplasia |
| Skin | 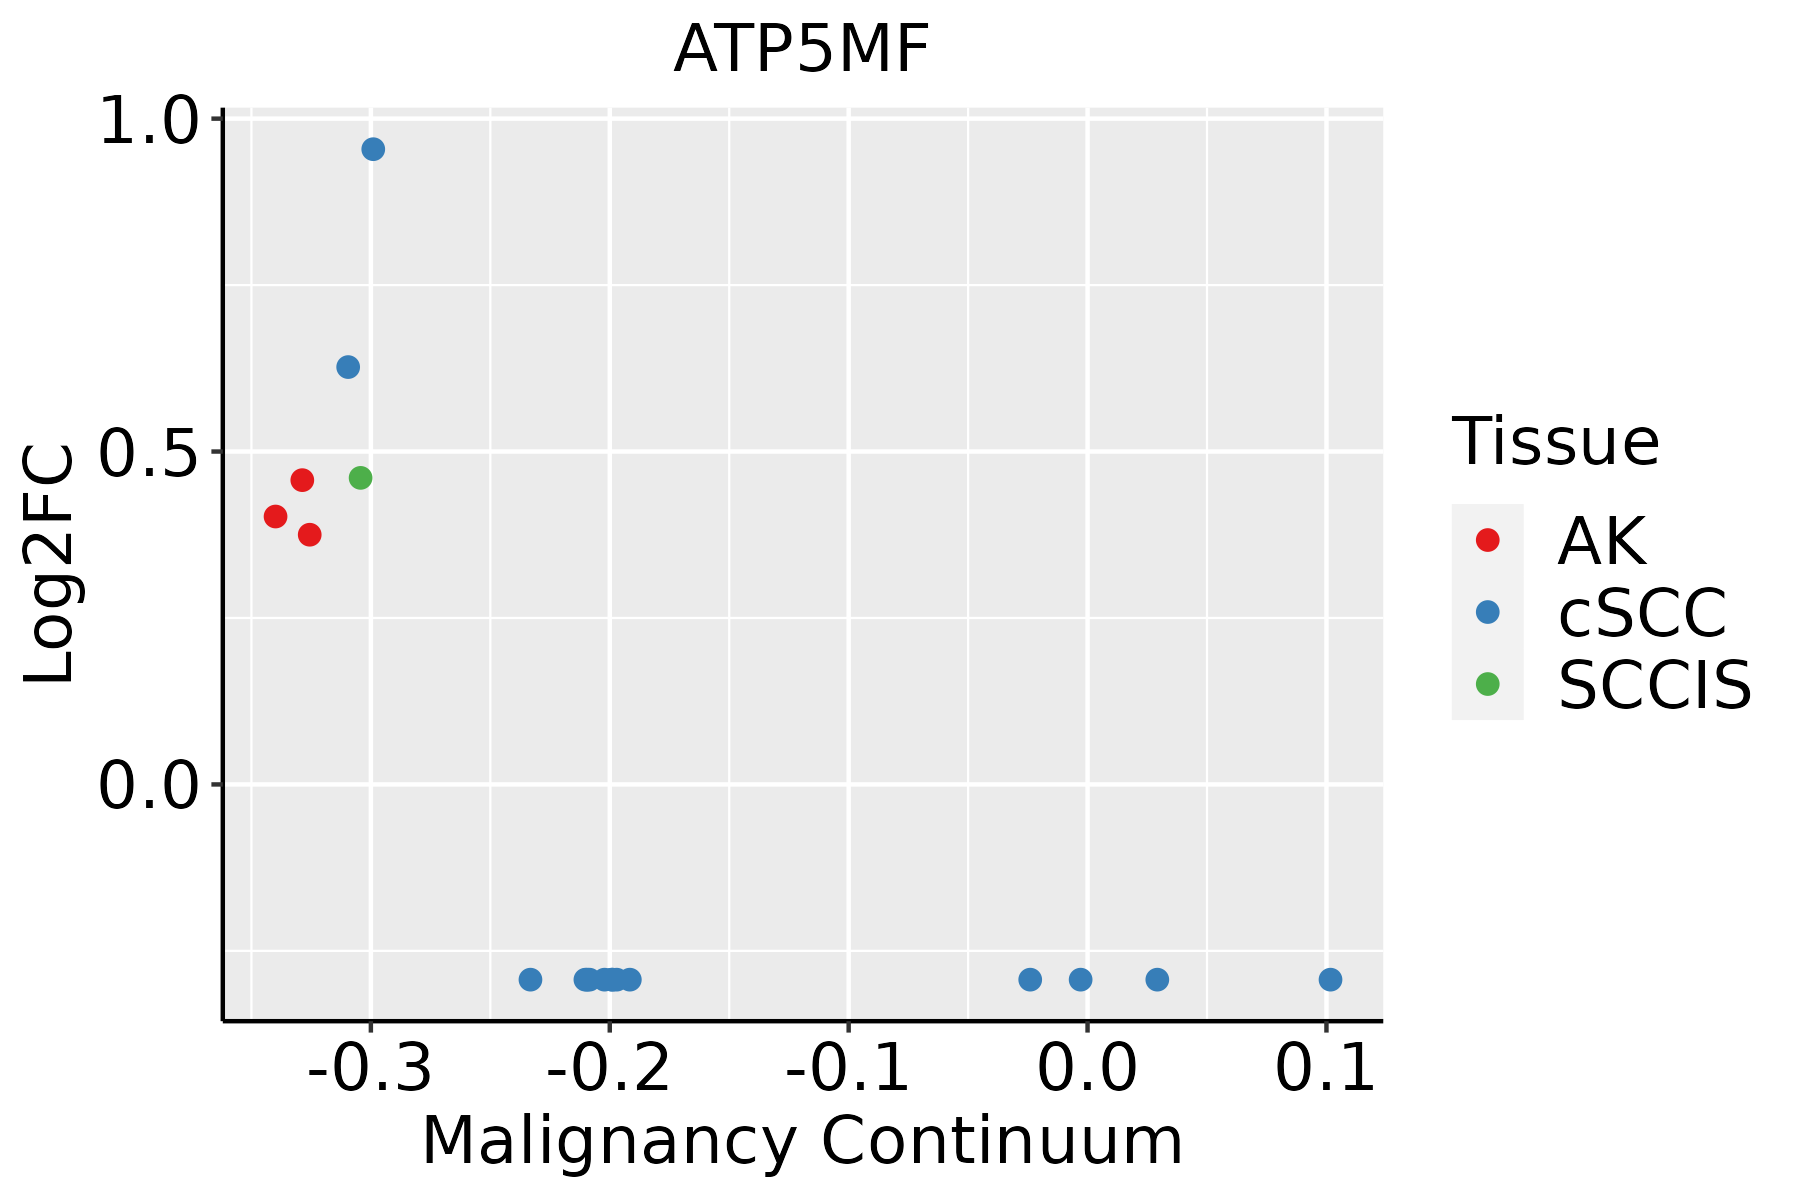 | AK: Actinic keratosis |
| cSCC: Cutaneous squamous cell carcinoma |
| SCCIS:squamous cell carcinoma in situ |
| Thyroid | 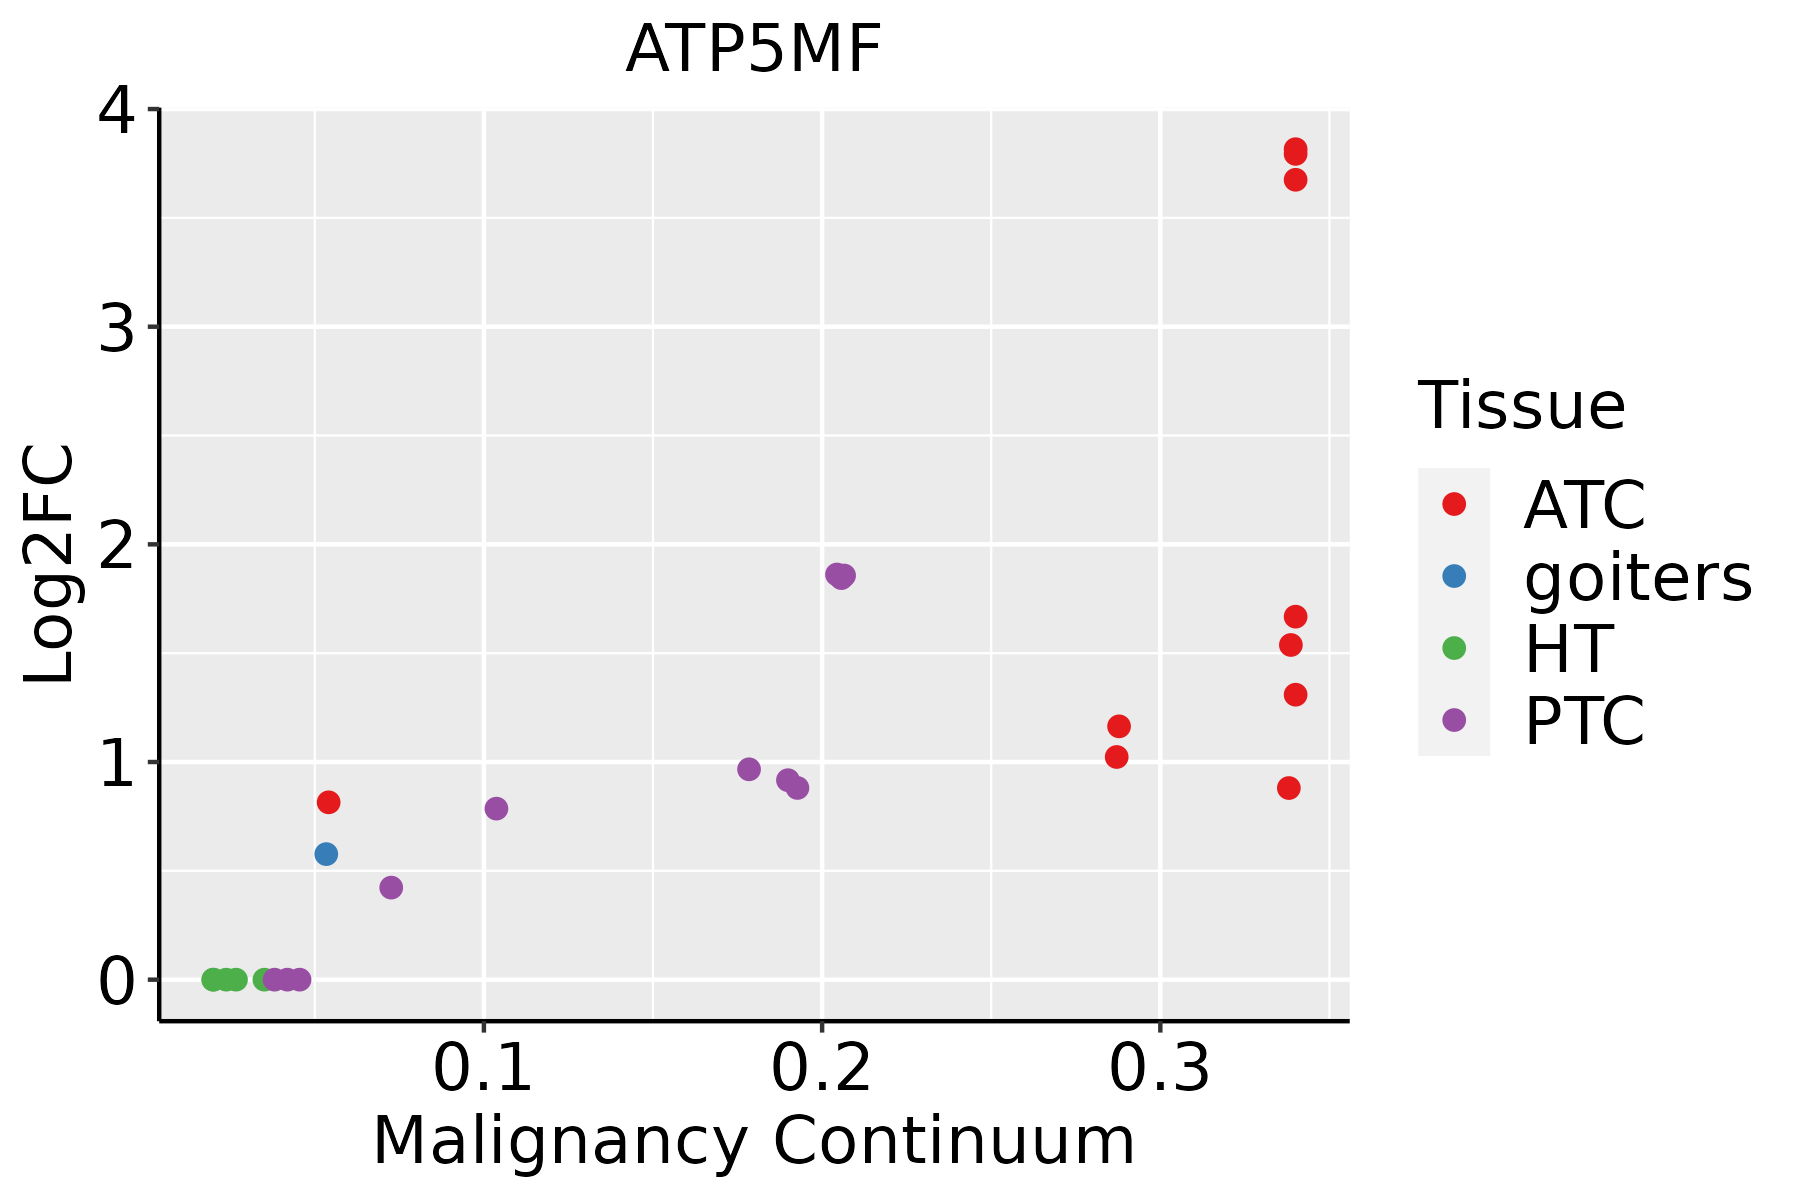 | ATC: Anaplastic thyroid cancer |
| HT: Hashimoto's thyroiditis |
| PTC: Papillary thyroid cancer |
| GO ID | Tissue | Disease Stage | Description | Gene Ratio | Bg Ratio | pvalue | p.adjust | Count |
| GO:0009199111 | Thyroid | goiters | ribonucleoside triphosphate metabolic process | 18/497 | 89/18723 | 1.68e-11 | 2.67e-09 | 18 |
| GO:0009142111 | Thyroid | goiters | nucleoside triphosphate biosynthetic process | 17/497 | 85/18723 | 7.43e-11 | 1.14e-08 | 17 |
| GO:0009141113 | Thyroid | goiters | nucleoside triphosphate metabolic process | 18/497 | 112/18723 | 8.94e-10 | 1.12e-07 | 18 |
| GO:1990542111 | Thyroid | goiters | mitochondrial transmembrane transport | 17/497 | 102/18723 | 1.47e-09 | 1.79e-07 | 17 |
| GO:0006839112 | Thyroid | goiters | mitochondrial transport | 22/497 | 254/18723 | 1.26e-06 | 7.05e-05 | 22 |
| GO:0009152112 | Thyroid | goiters | purine ribonucleotide biosynthetic process | 17/497 | 169/18723 | 2.74e-06 | 1.33e-04 | 17 |
| GO:0046390112 | Thyroid | goiters | ribose phosphate biosynthetic process | 18/497 | 190/18723 | 3.31e-06 | 1.58e-04 | 18 |
| GO:0072522110 | Thyroid | goiters | purine-containing compound biosynthetic process | 18/497 | 200/18723 | 6.82e-06 | 3.03e-04 | 18 |
| GO:0009260112 | Thyroid | goiters | ribonucleotide biosynthetic process | 17/497 | 182/18723 | 7.48e-06 | 3.22e-04 | 17 |
| GO:0006164110 | Thyroid | goiters | purine nucleotide biosynthetic process | 17/497 | 191/18723 | 1.42e-05 | 5.69e-04 | 17 |
| GO:0009150113 | Thyroid | goiters | purine ribonucleotide metabolic process | 22/497 | 368/18723 | 3.62e-04 | 9.15e-03 | 22 |
| GO:0019693113 | Thyroid | goiters | ribose phosphate metabolic process | 23/497 | 396/18723 | 4.03e-04 | 9.95e-03 | 23 |
| GO:000916517 | Thyroid | goiters | nucleotide biosynthetic process | 17/497 | 254/18723 | 4.71e-04 | 1.15e-02 | 17 |
| GO:190129317 | Thyroid | goiters | nucleoside phosphate biosynthetic process | 17/497 | 256/18723 | 5.14e-04 | 1.24e-02 | 17 |
| GO:0009259113 | Thyroid | goiters | ribonucleotide metabolic process | 22/497 | 385/18723 | 6.65e-04 | 1.55e-02 | 22 |
| GO:0072521113 | Thyroid | goiters | purine-containing compound metabolic process | 23/497 | 416/18723 | 7.94e-04 | 1.74e-02 | 23 |
| GO:0006163113 | Thyroid | goiters | purine nucleotide metabolic process | 22/497 | 396/18723 | 9.62e-04 | 2.01e-02 | 22 |
| GO:000906033 | Thyroid | ATC | aerobic respiration | 126/6293 | 189/18723 | 1.21e-20 | 2.02e-18 | 126 |
| GO:004603434 | Thyroid | ATC | ATP metabolic process | 167/6293 | 277/18723 | 5.60e-20 | 8.64e-18 | 167 |
| GO:000609134 | Thyroid | ATC | generation of precursor metabolites and energy | 256/6293 | 490/18723 | 6.55e-18 | 7.69e-16 | 256 |
| Pathway ID | Tissue | Disease Stage | Description | Gene Ratio | Bg Ratio | pvalue | p.adjust | qvalue | Count |
| hsa0019016 | Breast | Precancer | Oxidative phosphorylation | 59/684 | 134/8465 | 6.15e-30 | 3.24e-28 | 2.48e-28 | 59 |
| hsa0471418 | Breast | Precancer | Thermogenesis | 68/684 | 232/8465 | 4.40e-22 | 1.26e-20 | 9.69e-21 | 68 |
| hsa0019017 | Breast | Precancer | Oxidative phosphorylation | 59/684 | 134/8465 | 6.15e-30 | 3.24e-28 | 2.48e-28 | 59 |
| hsa0471419 | Breast | Precancer | Thermogenesis | 68/684 | 232/8465 | 4.40e-22 | 1.26e-20 | 9.69e-21 | 68 |
| hsa0019023 | Breast | IDC | Oxidative phosphorylation | 62/867 | 134/8465 | 4.78e-27 | 2.59e-25 | 1.94e-25 | 62 |
| hsa0471424 | Breast | IDC | Thermogenesis | 75/867 | 232/8465 | 8.41e-21 | 3.04e-19 | 2.27e-19 | 75 |
| hsa0019033 | Breast | IDC | Oxidative phosphorylation | 62/867 | 134/8465 | 4.78e-27 | 2.59e-25 | 1.94e-25 | 62 |
| hsa0471434 | Breast | IDC | Thermogenesis | 75/867 | 232/8465 | 8.41e-21 | 3.04e-19 | 2.27e-19 | 75 |
| hsa0019043 | Breast | DCIS | Oxidative phosphorylation | 61/846 | 134/8465 | 9.84e-27 | 5.30e-25 | 3.90e-25 | 61 |
| hsa0471443 | Breast | DCIS | Thermogenesis | 74/846 | 232/8465 | 8.72e-21 | 3.13e-19 | 2.30e-19 | 74 |
| hsa0019053 | Breast | DCIS | Oxidative phosphorylation | 61/846 | 134/8465 | 9.84e-27 | 5.30e-25 | 3.90e-25 | 61 |
| hsa0471453 | Breast | DCIS | Thermogenesis | 74/846 | 232/8465 | 8.72e-21 | 3.13e-19 | 2.30e-19 | 74 |
| hsa0019018 | Cervix | CC | Oxidative phosphorylation | 64/1267 | 134/8465 | 1.25e-19 | 8.07e-18 | 4.77e-18 | 64 |
| hsa0471420 | Cervix | CC | Thermogenesis | 76/1267 | 232/8465 | 4.29e-12 | 1.16e-10 | 6.85e-11 | 76 |
| hsa0019019 | Cervix | CC | Oxidative phosphorylation | 64/1267 | 134/8465 | 1.25e-19 | 8.07e-18 | 4.77e-18 | 64 |
| hsa04714110 | Cervix | CC | Thermogenesis | 76/1267 | 232/8465 | 4.29e-12 | 1.16e-10 | 6.85e-11 | 76 |
| hsa00190 | Colorectum | AD | Oxidative phosphorylation | 86/2092 | 134/8465 | 2.47e-22 | 2.76e-20 | 1.76e-20 | 86 |
| hsa04714 | Colorectum | AD | Thermogenesis | 120/2092 | 232/8465 | 2.76e-19 | 1.16e-17 | 7.37e-18 | 120 |
| hsa001901 | Colorectum | AD | Oxidative phosphorylation | 86/2092 | 134/8465 | 2.47e-22 | 2.76e-20 | 1.76e-20 | 86 |
| hsa047141 | Colorectum | AD | Thermogenesis | 120/2092 | 232/8465 | 2.76e-19 | 1.16e-17 | 7.37e-18 | 120 |


