
|
|||||
|
 | |
| |
| |
| |
| |
| |
|
Gene: THBS1 |
Gene summary for THBS1 |
| Gene information | Species | Human | Gene symbol | THBS1 | Gene ID | 7057 |
| Gene name | thrombospondin 1 | |
| Gene Alias | THBS | |
| Cytomap | 15q14 | |
| Gene Type | protein-coding | GO ID | GO:0000165 | UniProtAcc | P07996 |
Top |
Malignant transformation analysis |
| Identification of the aberrant gene expression in precancerous and cancerous lesions by comparing the gene expression of stem-like cells in diseased tissues with normal stem cells |
| Entrez ID | Symbol | Replicates | Species | Organ | Tissue | Adj P-value | Log2FC | Malignancy |
| 7057 | THBS1 | LZE3D | Human | Esophagus | HGIN | 5.27e-03 | 9.21e-01 | 0.0668 |
| 7057 | THBS1 | LZE7T | Human | Esophagus | ESCC | 1.37e-04 | -6.11e-01 | 0.0667 |
| 7057 | THBS1 | LZE8T | Human | Esophagus | ESCC | 5.57e-03 | -4.79e-01 | 0.067 |
| 7057 | THBS1 | LZE22D1 | Human | Esophagus | HGIN | 1.03e-02 | -5.88e-01 | 0.0595 |
| 7057 | THBS1 | LZE24D1 | Human | Esophagus | HGIN | 3.91e-08 | 5.38e-02 | 0.054 |
| 7057 | THBS1 | LZE24T | Human | Esophagus | ESCC | 3.02e-15 | -6.42e-01 | 0.0596 |
| 7057 | THBS1 | P12T-E | Human | Esophagus | ESCC | 1.58e-15 | 8.39e-01 | 0.1122 |
| 7057 | THBS1 | P20T-E | Human | Esophagus | ESCC | 3.17e-04 | -3.27e-01 | 0.1124 |
| 7057 | THBS1 | P28T-E | Human | Esophagus | ESCC | 7.03e-03 | -4.41e-01 | 0.1149 |
| 7057 | THBS1 | P37T-E | Human | Esophagus | ESCC | 8.37e-09 | 8.43e-01 | 0.1371 |
| 7057 | THBS1 | P54T-E | Human | Esophagus | ESCC | 1.63e-07 | -3.76e-01 | 0.0975 |
| 7057 | THBS1 | P56T-E | Human | Esophagus | ESCC | 4.66e-06 | 2.53e+00 | 0.1613 |
| 7057 | THBS1 | P57T-E | Human | Esophagus | ESCC | 4.48e-07 | 1.05e+00 | 0.0926 |
| 7057 | THBS1 | P74T-E | Human | Esophagus | ESCC | 3.74e-02 | -4.17e-01 | 0.1479 |
| 7057 | THBS1 | P76T-E | Human | Esophagus | ESCC | 3.05e-03 | 6.42e-01 | 0.1207 |
| 7057 | THBS1 | P80T-E | Human | Esophagus | ESCC | 2.03e-10 | -4.40e-01 | 0.155 |
| 7057 | THBS1 | P104T-E | Human | Esophagus | ESCC | 1.77e-02 | -1.64e-01 | 0.0931 |
| 7057 | THBS1 | P130T-E | Human | Esophagus | ESCC | 1.16e-02 | 1.20e+00 | 0.1676 |
| 7057 | THBS1 | S43 | Human | Liver | Cirrhotic | 6.95e-23 | 6.99e-01 | -0.0187 |
| 7057 | THBS1 | HCC1_Meng | Human | Liver | HCC | 1.34e-46 | -1.49e-01 | 0.0246 |
| Page: 1 2 3 4 |
| Tissue | Expression Dynamics | Abbreviation |
| Esophagus | 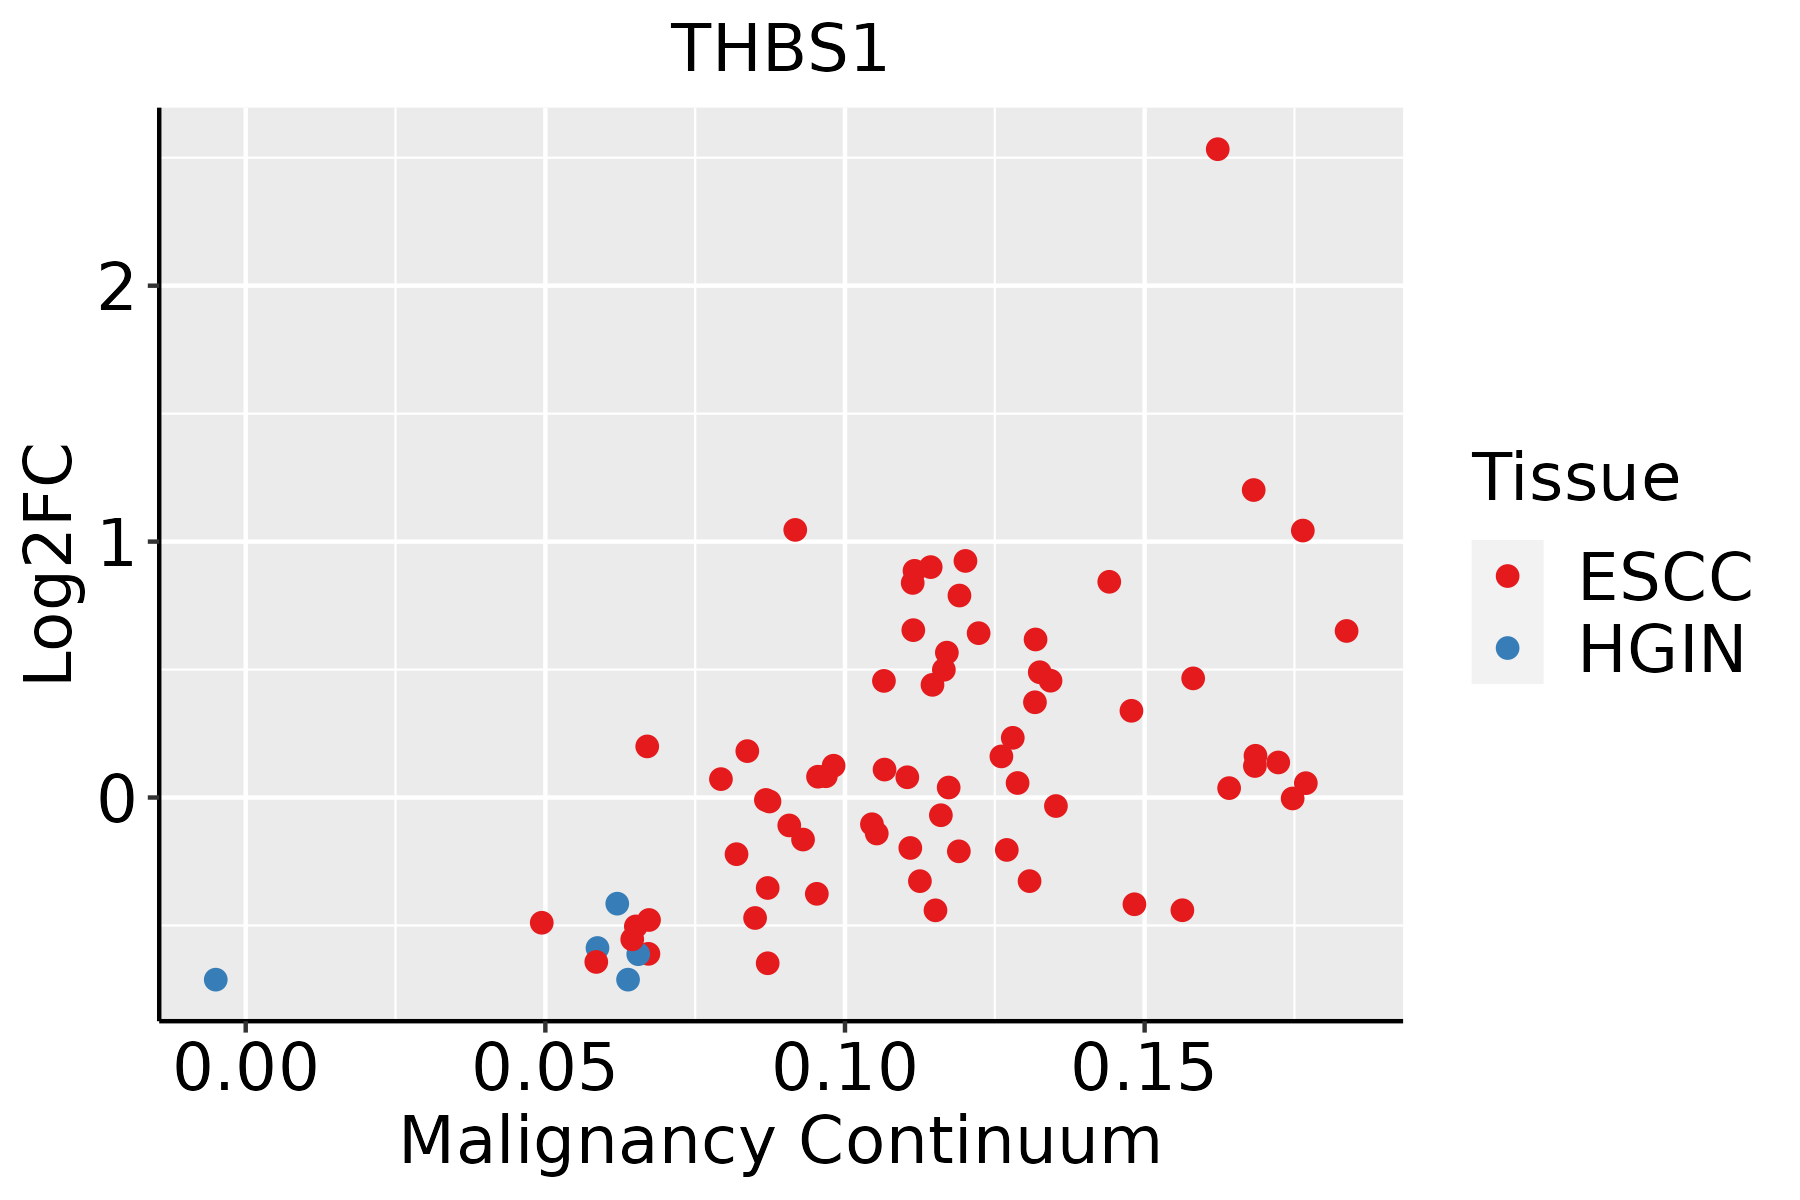 | ESCC: Esophageal squamous cell carcinoma |
| HGIN: High-grade intraepithelial neoplasias | ||
| LGIN: Low-grade intraepithelial neoplasias | ||
| Liver |  | HCC: Hepatocellular carcinoma |
| NAFLD: Non-alcoholic fatty liver disease | ||
| Oral Cavity | 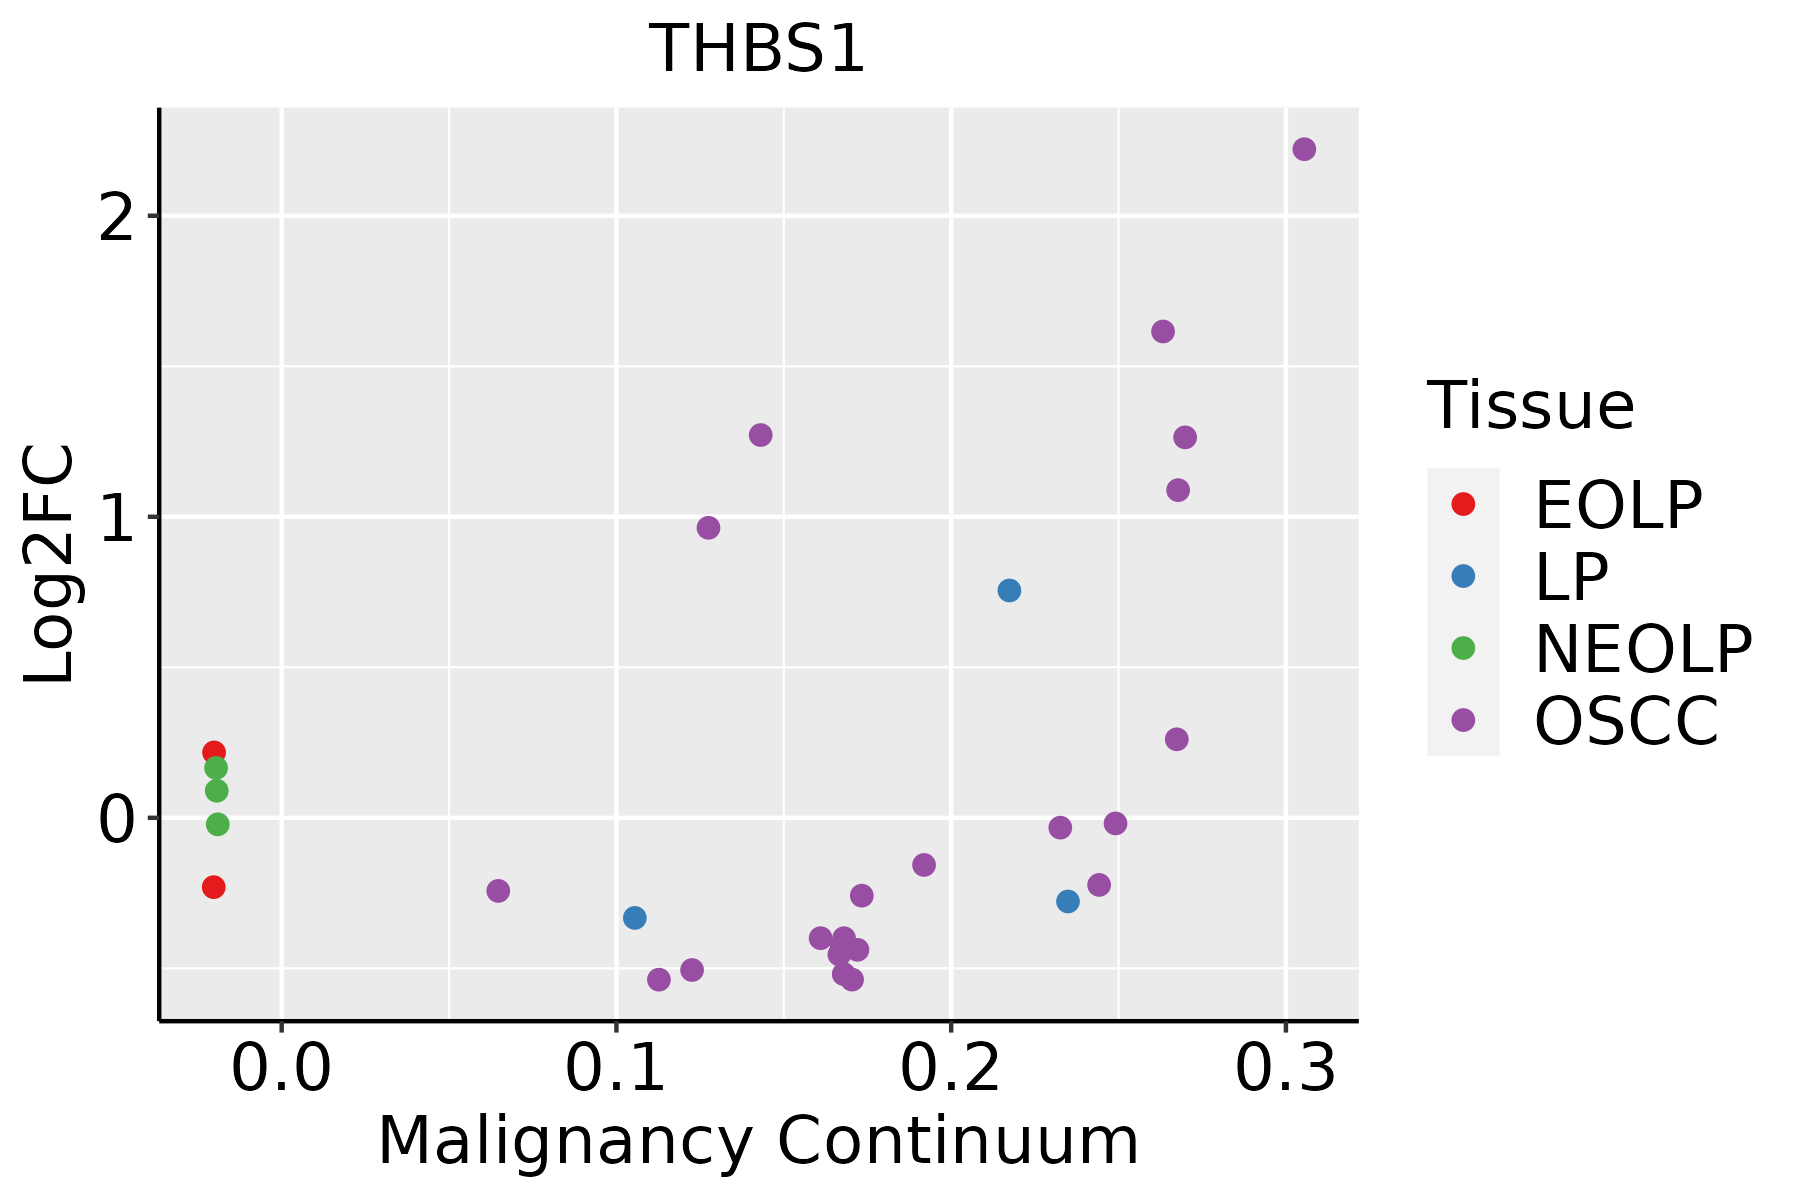 | EOLP: Erosive Oral lichen planus |
| LP: leukoplakia | ||
| NEOLP: Non-erosive oral lichen planus | ||
| OSCC: Oral squamous cell carcinoma | ||
| Prostate | 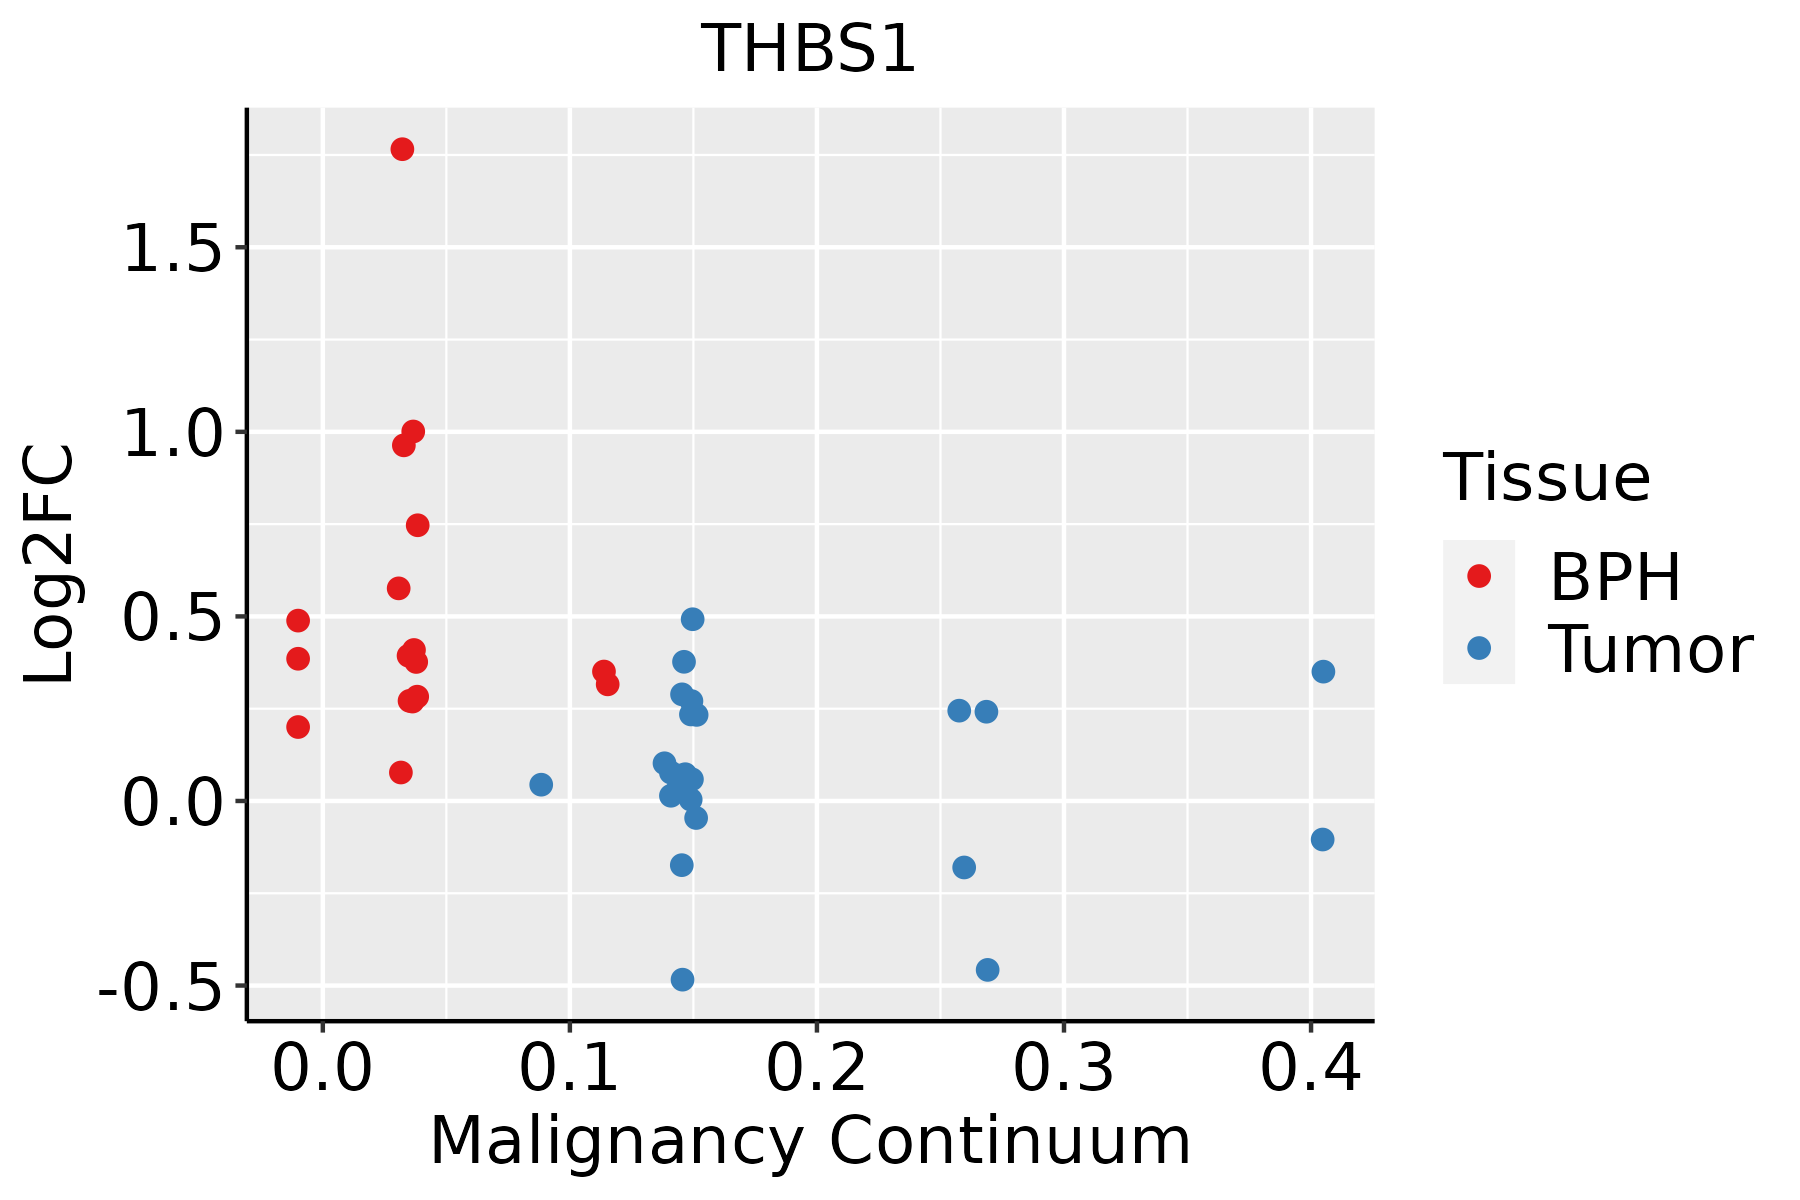 | BPH: Benign Prostatic Hyperplasia |
| Thyroid | 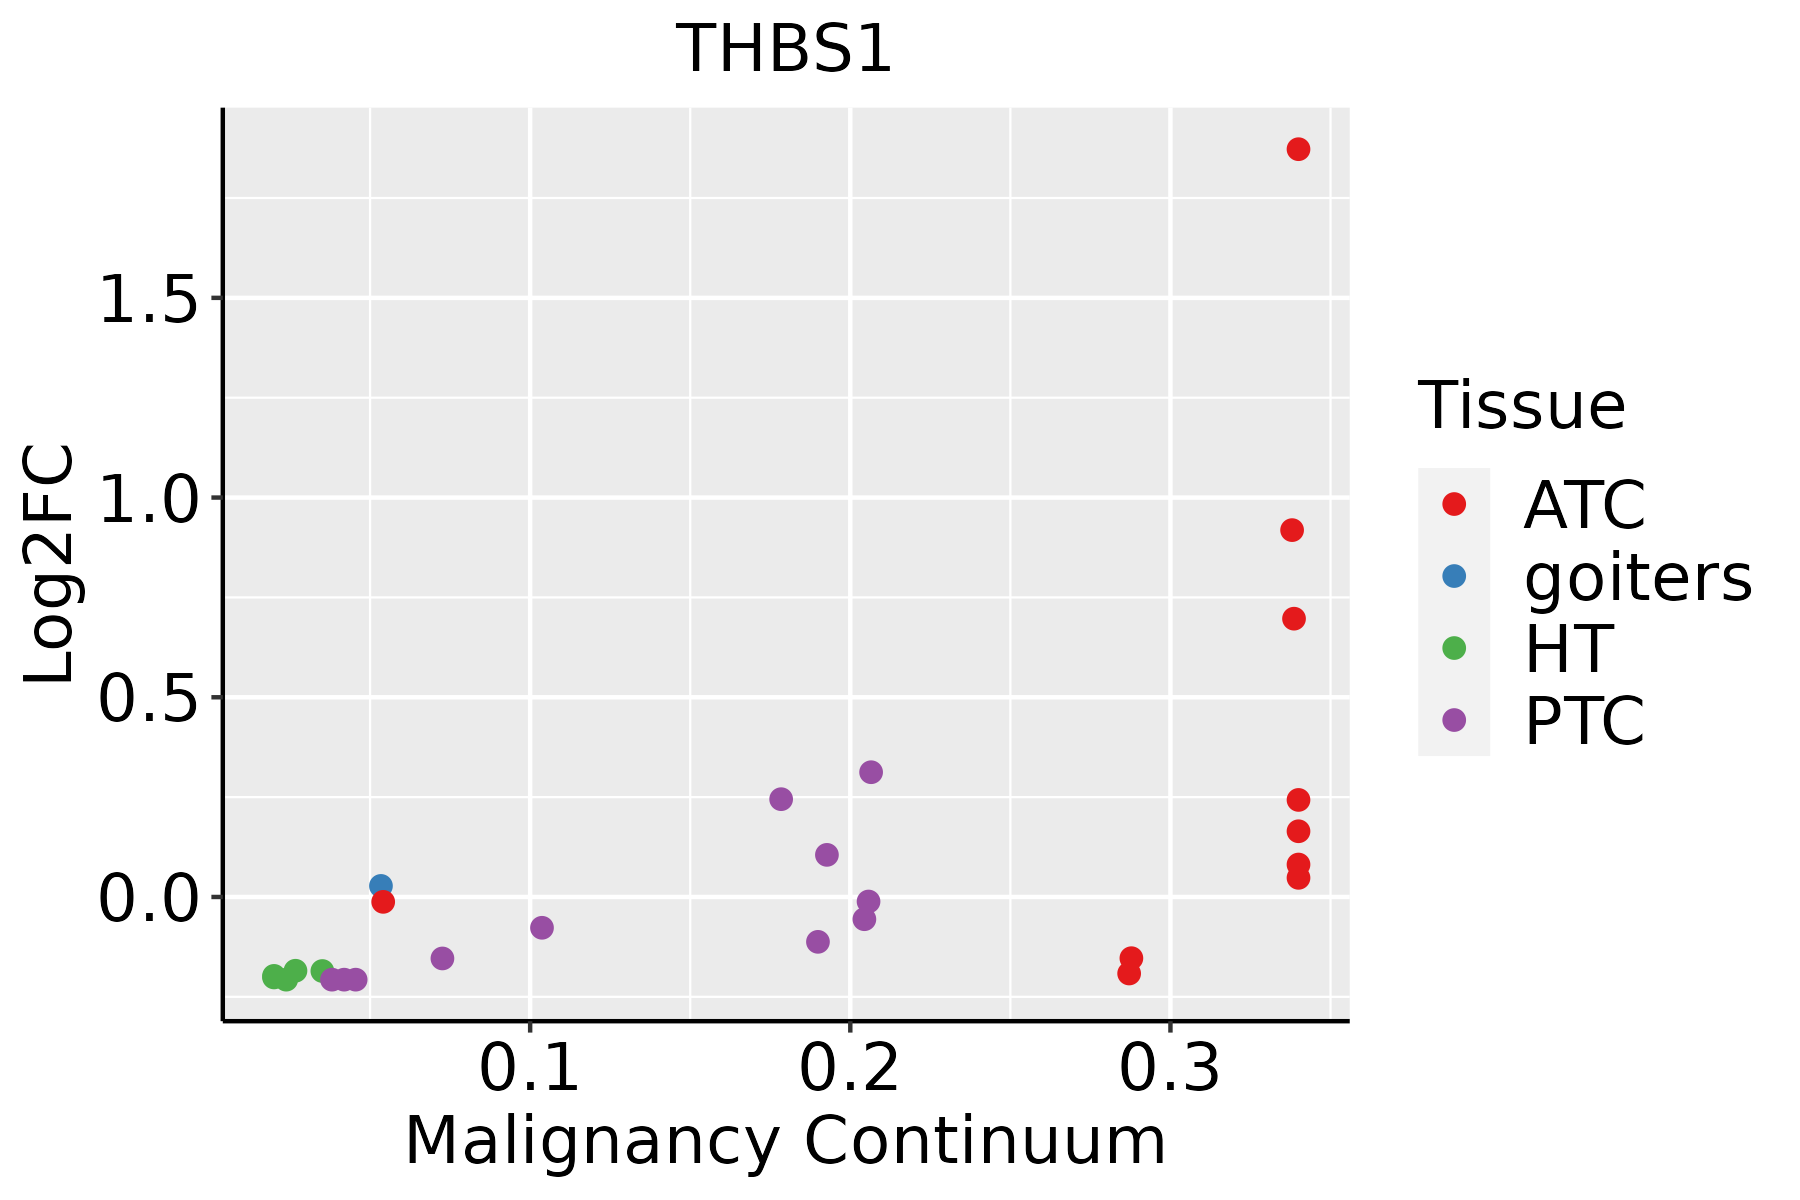 | ATC: Anaplastic thyroid cancer |
| HT: Hashimoto's thyroiditis | ||
| PTC: Papillary thyroid cancer |
| ∗log2FC in expression of this searched gene in stem-like cells from each diseased tissue sample relative to stem-like cells in normal samples in each tissue plotted against the malignancy continuum. Samples are colored based on if they are from different disease stage. |
Top |
Malignant transformation related pathway analysis |
| Find out the enriched GO biological processes and KEGG pathways involved in transition from healthy to precancer to cancer |
| Tissue | Disease Stage | Enriched GO biological Processes |
| Colorectum | AD |  |
| Colorectum | SER |  |
| Colorectum | MSS |  |
| Colorectum | MSI-H |  |
| Colorectum | FAP |  |
| ∗Top 15 enriched GO BP terms are showed in the bar plot of each disease state in each tissue. Each row represents a significant GO biological process which is colored according to the -log10(p.adjust). |
| Page: 1 2 3 4 5 6 7 8 9 |
| GO ID | Tissue | Disease Stage | Description | Gene Ratio | Bg Ratio | pvalue | p.adjust | Count |
| GO:004865921 | Oral cavity | NEOLP | smooth muscle cell proliferation | 40/2005 | 184/18723 | 9.53e-06 | 1.82e-04 | 40 |
| GO:005090023 | Oral cavity | NEOLP | leukocyte migration | 67/2005 | 369/18723 | 1.04e-05 | 1.96e-04 | 67 |
| GO:000862531 | Oral cavity | NEOLP | extrinsic apoptotic signaling pathway via death domain receptors | 23/2005 | 82/18723 | 1.07e-05 | 1.98e-04 | 23 |
| GO:001063223 | Oral cavity | NEOLP | regulation of epithelial cell migration | 56/2005 | 292/18723 | 1.07e-05 | 1.98e-04 | 56 |
| GO:004866021 | Oral cavity | NEOLP | regulation of smooth muscle cell proliferation | 39/2005 | 180/18723 | 1.33e-05 | 2.37e-04 | 39 |
| GO:000716223 | Oral cavity | NEOLP | negative regulation of cell adhesion | 57/2005 | 303/18723 | 1.62e-05 | 2.79e-04 | 57 |
| GO:004001314 | Oral cavity | NEOLP | negative regulation of locomotion | 69/2005 | 391/18723 | 2.05e-05 | 3.41e-04 | 69 |
| GO:003460532 | Oral cavity | NEOLP | cellular response to heat | 20/2005 | 69/18723 | 2.33e-05 | 3.72e-04 | 20 |
| GO:009030323 | Oral cavity | NEOLP | positive regulation of wound healing | 18/2005 | 59/18723 | 2.76e-05 | 4.29e-04 | 18 |
| GO:001003833 | Oral cavity | NEOLP | response to metal ion | 66/2005 | 373/18723 | 2.83e-05 | 4.34e-04 | 66 |
| GO:007190031 | Oral cavity | NEOLP | regulation of protein serine/threonine kinase activity | 64/2005 | 359/18723 | 2.93e-05 | 4.48e-04 | 64 |
| GO:009028711 | Oral cavity | NEOLP | regulation of cellular response to growth factor stimulus | 56/2005 | 304/18723 | 3.55e-05 | 5.20e-04 | 56 |
| GO:009009213 | Oral cavity | NEOLP | regulation of transmembrane receptor protein serine/threonine kinase signaling pathway | 49/2005 | 256/18723 | 3.90e-05 | 5.62e-04 | 49 |
| GO:001063424 | Oral cavity | NEOLP | positive regulation of epithelial cell migration | 37/2005 | 176/18723 | 4.37e-05 | 6.14e-04 | 37 |
| GO:190303623 | Oral cavity | NEOLP | positive regulation of response to wounding | 20/2005 | 72/18723 | 4.59e-05 | 6.37e-04 | 20 |
| GO:007163431 | Oral cavity | NEOLP | regulation of transforming growth factor beta production | 14/2005 | 41/18723 | 5.34e-05 | 7.29e-04 | 14 |
| GO:007259332 | Oral cavity | NEOLP | reactive oxygen species metabolic process | 46/2005 | 239/18723 | 5.77e-05 | 7.77e-04 | 46 |
| GO:000268331 | Oral cavity | NEOLP | negative regulation of immune system process | 73/2005 | 434/18723 | 6.18e-05 | 8.22e-04 | 73 |
| GO:001076121 | Oral cavity | NEOLP | fibroblast migration | 15/2005 | 47/18723 | 7.12e-05 | 9.27e-04 | 15 |
| GO:005067323 | Oral cavity | NEOLP | epithelial cell proliferation | 73/2005 | 437/18723 | 7.74e-05 | 9.93e-04 | 73 |
| Page: 1 2 3 4 5 6 7 8 9 10 11 12 13 14 15 16 17 18 19 20 21 22 23 24 25 26 27 28 29 30 31 32 33 34 35 36 37 38 39 40 41 42 43 44 45 46 47 48 49 50 51 52 53 54 55 56 57 58 59 60 61 62 63 64 65 |
| Pathway ID | Tissue | Disease Stage | Description | Gene Ratio | Bg Ratio | pvalue | p.adjust | qvalue | Count |
| hsa0411510 | Esophagus | HGIN | p53 signaling pathway | 21/1383 | 74/8465 | 6.25e-03 | 4.25e-02 | 3.37e-02 | 21 |
| hsa0520528 | Esophagus | HGIN | Proteoglycans in cancer | 47/1383 | 205/8465 | 8.23e-03 | 4.71e-02 | 3.74e-02 | 47 |
| hsa0411515 | Esophagus | HGIN | p53 signaling pathway | 21/1383 | 74/8465 | 6.25e-03 | 4.25e-02 | 3.37e-02 | 21 |
| hsa05205112 | Esophagus | HGIN | Proteoglycans in cancer | 47/1383 | 205/8465 | 8.23e-03 | 4.71e-02 | 3.74e-02 | 47 |
| hsa0411524 | Esophagus | ESCC | p53 signaling pathway | 65/4205 | 74/8465 | 3.88e-12 | 6.50e-11 | 3.33e-11 | 65 |
| hsa0516510 | Esophagus | ESCC | Human papillomavirus infection | 215/4205 | 331/8465 | 7.86e-09 | 7.12e-08 | 3.65e-08 | 215 |
| hsa0520529 | Esophagus | ESCC | Proteoglycans in cancer | 138/4205 | 205/8465 | 1.79e-07 | 1.40e-06 | 7.15e-07 | 138 |
| hsa0521910 | Esophagus | ESCC | Bladder cancer | 35/4205 | 41/8465 | 1.91e-06 | 1.15e-05 | 5.87e-06 | 35 |
| hsa0414530 | Esophagus | ESCC | Phagosome | 100/4205 | 152/8465 | 3.81e-05 | 1.72e-04 | 8.82e-05 | 100 |
| hsa0451020 | Esophagus | ESCC | Focal adhesion | 127/4205 | 203/8465 | 1.25e-04 | 4.99e-04 | 2.56e-04 | 127 |
| hsa043507 | Esophagus | ESCC | TGF-beta signaling pathway | 69/4205 | 108/8465 | 1.92e-03 | 5.54e-03 | 2.84e-03 | 69 |
| hsa041517 | Esophagus | ESCC | PI3K-Akt signaling pathway | 197/4205 | 354/8465 | 1.24e-02 | 2.83e-02 | 1.45e-02 | 197 |
| hsa0411534 | Esophagus | ESCC | p53 signaling pathway | 65/4205 | 74/8465 | 3.88e-12 | 6.50e-11 | 3.33e-11 | 65 |
| hsa0516515 | Esophagus | ESCC | Human papillomavirus infection | 215/4205 | 331/8465 | 7.86e-09 | 7.12e-08 | 3.65e-08 | 215 |
| hsa0520537 | Esophagus | ESCC | Proteoglycans in cancer | 138/4205 | 205/8465 | 1.79e-07 | 1.40e-06 | 7.15e-07 | 138 |
| hsa0521917 | Esophagus | ESCC | Bladder cancer | 35/4205 | 41/8465 | 1.91e-06 | 1.15e-05 | 5.87e-06 | 35 |
| hsa04145114 | Esophagus | ESCC | Phagosome | 100/4205 | 152/8465 | 3.81e-05 | 1.72e-04 | 8.82e-05 | 100 |
| hsa04510111 | Esophagus | ESCC | Focal adhesion | 127/4205 | 203/8465 | 1.25e-04 | 4.99e-04 | 2.56e-04 | 127 |
| hsa0435014 | Esophagus | ESCC | TGF-beta signaling pathway | 69/4205 | 108/8465 | 1.92e-03 | 5.54e-03 | 2.84e-03 | 69 |
| hsa0415114 | Esophagus | ESCC | PI3K-Akt signaling pathway | 197/4205 | 354/8465 | 1.24e-02 | 2.83e-02 | 1.45e-02 | 197 |
| Page: 1 2 3 4 5 6 |
Top |
Cell-cell communication analysis |
| Identification of potential cell-cell interactions between two cell types and their ligand-receptor pairs for different disease states |
| Ligand | Receptor | LRpair | Pathway | Tissue | Disease Stage |
| THBS1 | SDC4 | THBS1_SDC4 | THBS | Breast | ADJ |
| THBS1 | CD47 | THBS1_CD47 | THBS | Breast | ADJ |
| THBS1 | SDC1 | THBS1_SDC1 | THBS | Breast | DCIS |
| THBS1 | SDC4 | THBS1_SDC4 | THBS | Breast | DCIS |
| THBS1 | CD36 | THBS1_CD36 | THBS | Breast | DCIS |
| THBS1 | CD47 | THBS1_CD47 | THBS | Breast | DCIS |
| THBS1 | SDC1 | THBS1_SDC1 | THBS | Breast | Healthy |
| THBS1 | SDC4 | THBS1_SDC4 | THBS | Breast | Healthy |
| THBS1 | CD36 | THBS1_CD36 | THBS | Breast | Healthy |
| THBS1 | CD47 | THBS1_CD47 | THBS | Breast | Healthy |
| THBS1 | SDC1 | THBS1_SDC1 | THBS | Breast | IDC |
| THBS1 | SDC4 | THBS1_SDC4 | THBS | Breast | IDC |
| THBS1 | CD36 | THBS1_CD36 | THBS | Breast | IDC |
| THBS1 | CD47 | THBS1_CD47 | THBS | Breast | IDC |
| THBS1 | SDC4 | THBS1_SDC4 | THBS | Breast | Precancer |
| THBS1 | CD36 | THBS1_CD36 | THBS | Breast | Precancer |
| THBS1 | CD47 | THBS1_CD47 | THBS | Breast | Precancer |
| THBS1 | ITGA3_ITGB1 | THBS1_ITGA3_ITGB1 | THBS | Cervix | ADJ |
| THBS1 | SDC1 | THBS1_SDC1 | THBS | Cervix | ADJ |
| THBS1 | SDC4 | THBS1_SDC4 | THBS | Cervix | ADJ |
| Page: 1 2 3 4 5 6 7 8 9 10 |
Top |
Single-cell gene regulatory network inference analysis |
| Find out the significant the regulons (TFs) and the target genes of each regulon across cell types for different disease states |
| TF | Cell Type | Tissue | Disease Stage | Target Gene | RSS | Regulon Activity |
| ∗The dot plots of a searched regulon are shown for all cell subpopulations in each disease state of each tissue based on the regulon specific score inferred using pySCENIC and by calculating the average expression. |
| Page: 1 |
Top |
Somatic mutation of malignant transformation related genes |
| Annotation of somatic variants for genes involved in malignant transformation |
| Hugo Symbol | Variant Class | Variant Classification | dbSNP RS | HGVSc | HGVSp | HGVSp Short | SWISSPROT | BIOTYPE | SIFT | PolyPhen | Tumor Sample Barcode | Tissue | Histology | Sex | Age | Stage | Therapy Types | Drugs | Outcome |
| THBS1 | SNV | Missense_Mutation | c.3229C>T | p.Arg1077Trp | p.R1077W | P07996 | protein_coding | deleterious(0) | probably_damaging(1) | TCGA-AN-A0AK-01 | Breast | breast invasive carcinoma | Female | >=65 | I/II | Unknown | Unknown | SD | |
| THBS1 | SNV | Missense_Mutation | c.2476N>G | p.Met826Val | p.M826V | P07996 | protein_coding | tolerated(0.44) | benign(0.015) | TCGA-B6-A0RN-01 | Breast | breast invasive carcinoma | Female | <65 | I/II | Unknown | Unknown | SD | |
| THBS1 | SNV | Missense_Mutation | c.1472N>A | p.Ile491Asn | p.I491N | P07996 | protein_coding | deleterious(0) | possibly_damaging(0.907) | TCGA-BH-A18Q-01 | Breast | breast invasive carcinoma | Female | <65 | I/II | Unknown | Unknown | SD | |
| THBS1 | SNV | Missense_Mutation | rs576321057 | c.2318G>A | p.Arg773His | p.R773H | P07996 | protein_coding | deleterious(0.05) | possibly_damaging(0.591) | TCGA-E2-A14P-01 | Breast | breast invasive carcinoma | Female | >=65 | III/IV | Targeted Molecular therapy | trastuzumab | SD |
| THBS1 | SNV | Missense_Mutation | novel | c.905N>T | p.Thr302Ile | p.T302I | P07996 | protein_coding | tolerated(0.05) | benign(0.216) | TCGA-LL-A7SZ-01 | Breast | breast invasive carcinoma | Female | <65 | I/II | Chemotherapy | adriamycin | CR |
| THBS1 | insertion | Frame_Shift_Ins | novel | c.1869_1870insA | p.Phe624IlefsTer25 | p.F624Ifs*25 | P07996 | protein_coding | TCGA-A2-A04V-01 | Breast | breast invasive carcinoma | Female | <65 | I/II | Chemotherapy | cytoxan | PD | ||
| THBS1 | insertion | Frame_Shift_Ins | novel | c.1871_1872insTGTGACCATCAACTCTGTA | p.Thr625ValfsTer30 | p.T625Vfs*30 | P07996 | protein_coding | TCGA-A2-A04V-01 | Breast | breast invasive carcinoma | Female | <65 | I/II | Chemotherapy | cytoxan | PD | ||
| THBS1 | insertion | Frame_Shift_Ins | novel | c.236_237insCTTAA | p.Asp80LeufsTer17 | p.D80Lfs*17 | P07996 | protein_coding | TCGA-A2-A0CU-01 | Breast | breast invasive carcinoma | Female | >=65 | I/II | Hormone Therapy | tamoxiphen | SD | ||
| THBS1 | insertion | Nonsense_Mutation | novel | c.237_238insAGTTGAGAGATTTAGCAGCTCAAAAATGTGACCT | p.Asp80SerfsTer2 | p.D80Sfs*2 | P07996 | protein_coding | TCGA-A2-A0CU-01 | Breast | breast invasive carcinoma | Female | >=65 | I/II | Hormone Therapy | tamoxiphen | SD | ||
| THBS1 | insertion | Frame_Shift_Ins | novel | c.988_989insTTCCAGCCCTGCCATCCGCACTAACTACATTGGCCACAAGACA | p.Glu330ValfsTer19 | p.E330Vfs*19 | P07996 | protein_coding | TCGA-AN-A049-01 | Breast | breast invasive carcinoma | Female | <65 | I/II | Unknown | Unknown | SD |
| Page: 1 2 3 4 5 6 7 8 9 10 11 12 |
Top |
Related drugs of malignant transformation related genes |
| Identification of chemicals and drugs interact with genes involved in malignant transfromation |
| (DGIdb 4.0) |
| Entrez ID | Symbol | Category | Interaction Types | Drug Claim Name | Drug Name | PMIDs |
| 7057 | THBS1 | EXTERNAL SIDE OF PLASMA MEMBRANE, CELL SURFACE, TRANSCRIPTION FACTOR, DRUGGABLE GENOME | 5-AZA-2&APOS;-DEOXYCYTIDINE | 14559817 | ||
| 7057 | THBS1 | EXTERNAL SIDE OF PLASMA MEMBRANE, CELL SURFACE, TRANSCRIPTION FACTOR, DRUGGABLE GENOME | METHYLCELLULOSE | METHYLCELLULOSE | 9016860 | |
| 7057 | THBS1 | EXTERNAL SIDE OF PLASMA MEMBRANE, CELL SURFACE, TRANSCRIPTION FACTOR, DRUGGABLE GENOME | PROTEIN KINASE C INHIBITOR | 9223624 | ||
| 7057 | THBS1 | EXTERNAL SIDE OF PLASMA MEMBRANE, CELL SURFACE, TRANSCRIPTION FACTOR, DRUGGABLE GENOME | SIMVASTATIN | SIMVASTATIN | 10543307 | |
| 7057 | THBS1 | EXTERNAL SIDE OF PLASMA MEMBRANE, CELL SURFACE, TRANSCRIPTION FACTOR, DRUGGABLE GENOME | UVB | 14962109 | ||
| 7057 | THBS1 | EXTERNAL SIDE OF PLASMA MEMBRANE, CELL SURFACE, TRANSCRIPTION FACTOR, DRUGGABLE GENOME | 5-AZA-2-DEOXYCYTIDINE | 14559817 | ||
| 7057 | THBS1 | EXTERNAL SIDE OF PLASMA MEMBRANE, CELL SURFACE, TRANSCRIPTION FACTOR, DRUGGABLE GENOME | ABT-510 | ABT-510 | ||
| 7057 | THBS1 | EXTERNAL SIDE OF PLASMA MEMBRANE, CELL SURFACE, TRANSCRIPTION FACTOR, DRUGGABLE GENOME | VESNARINONE | VESNARINONE | 15356428 | |
| 7057 | THBS1 | EXTERNAL SIDE OF PLASMA MEMBRANE, CELL SURFACE, TRANSCRIPTION FACTOR, DRUGGABLE GENOME | ALL-TRANS RETINOIC ACID | 9447832 | ||
| 7057 | THBS1 | EXTERNAL SIDE OF PLASMA MEMBRANE, CELL SURFACE, TRANSCRIPTION FACTOR, DRUGGABLE GENOME | RETINOIC ACID | 1430209 |
| Page: 1 2 |

Copyright 2023-Present -The University of Texas Health Science Center at Houston |