
|
|||||
|
 | |
| |
| |
| |
| |
| |
|
Gene: RPS19 |
Gene summary for RPS19 |
| Gene information | Species | Human | Gene symbol | RPS19 | Gene ID | 6223 |
| Gene name | ribosomal protein S19 | |
| Gene Alias | DBA | |
| Cytomap | 19q13.2 | |
| Gene Type | protein-coding | GO ID | GO:0000028 | UniProtAcc | B0ZBD0 |
Top |
Malignant transformation analysis |
| Identification of the aberrant gene expression in precancerous and cancerous lesions by comparing the gene expression of stem-like cells in diseased tissues with normal stem cells |
| Entrez ID | Symbol | Replicates | Species | Organ | Tissue | Adj P-value | Log2FC | Malignancy |
| 6223 | RPS19 | GSM4909282 | Human | Breast | IDC | 1.18e-40 | -2.16e-01 | -0.0288 |
| 6223 | RPS19 | GSM4909286 | Human | Breast | IDC | 2.89e-43 | 2.01e-01 | 0.1081 |
| 6223 | RPS19 | GSM4909287 | Human | Breast | IDC | 1.80e-11 | -1.82e-01 | 0.2057 |
| 6223 | RPS19 | GSM4909293 | Human | Breast | IDC | 1.12e-51 | -2.45e-01 | 0.1581 |
| 6223 | RPS19 | GSM4909294 | Human | Breast | IDC | 1.44e-45 | -3.14e-01 | 0.2022 |
| 6223 | RPS19 | GSM4909296 | Human | Breast | IDC | 3.14e-09 | 1.08e-01 | 0.1524 |
| 6223 | RPS19 | GSM4909297 | Human | Breast | IDC | 2.49e-16 | -1.70e-01 | 0.1517 |
| 6223 | RPS19 | GSM4909298 | Human | Breast | IDC | 2.09e-30 | -1.74e-01 | 0.1551 |
| 6223 | RPS19 | GSM4909301 | Human | Breast | IDC | 1.27e-05 | -9.85e-02 | 0.1577 |
| 6223 | RPS19 | GSM4909304 | Human | Breast | IDC | 6.16e-19 | -1.30e-01 | 0.1636 |
| 6223 | RPS19 | GSM4909307 | Human | Breast | IDC | 5.19e-03 | -6.81e-02 | 0.1569 |
| 6223 | RPS19 | GSM4909308 | Human | Breast | IDC | 1.78e-16 | -1.83e-01 | 0.158 |
| 6223 | RPS19 | GSM4909311 | Human | Breast | IDC | 4.17e-03 | 7.44e-02 | 0.1534 |
| 6223 | RPS19 | GSM4909315 | Human | Breast | IDC | 1.22e-14 | -1.63e-01 | 0.21 |
| 6223 | RPS19 | GSM4909316 | Human | Breast | IDC | 1.69e-06 | -3.05e-01 | 0.21 |
| 6223 | RPS19 | GSM4909317 | Human | Breast | IDC | 1.42e-19 | -2.38e-01 | 0.1355 |
| 6223 | RPS19 | GSM4909318 | Human | Breast | IDC | 3.18e-03 | -3.07e-01 | 0.2031 |
| 6223 | RPS19 | GSM4909319 | Human | Breast | IDC | 8.88e-89 | -9.24e-01 | 0.1563 |
| 6223 | RPS19 | brca2 | Human | Breast | Precancer | 7.82e-33 | -1.96e-01 | -0.024 |
| 6223 | RPS19 | brca3 | Human | Breast | Precancer | 3.49e-14 | -1.24e-01 | -0.0263 |
| Page: 1 2 3 4 5 6 7 8 9 10 11 12 13 14 15 16 17 18 |
| Tissue | Expression Dynamics | Abbreviation |
| Breast | 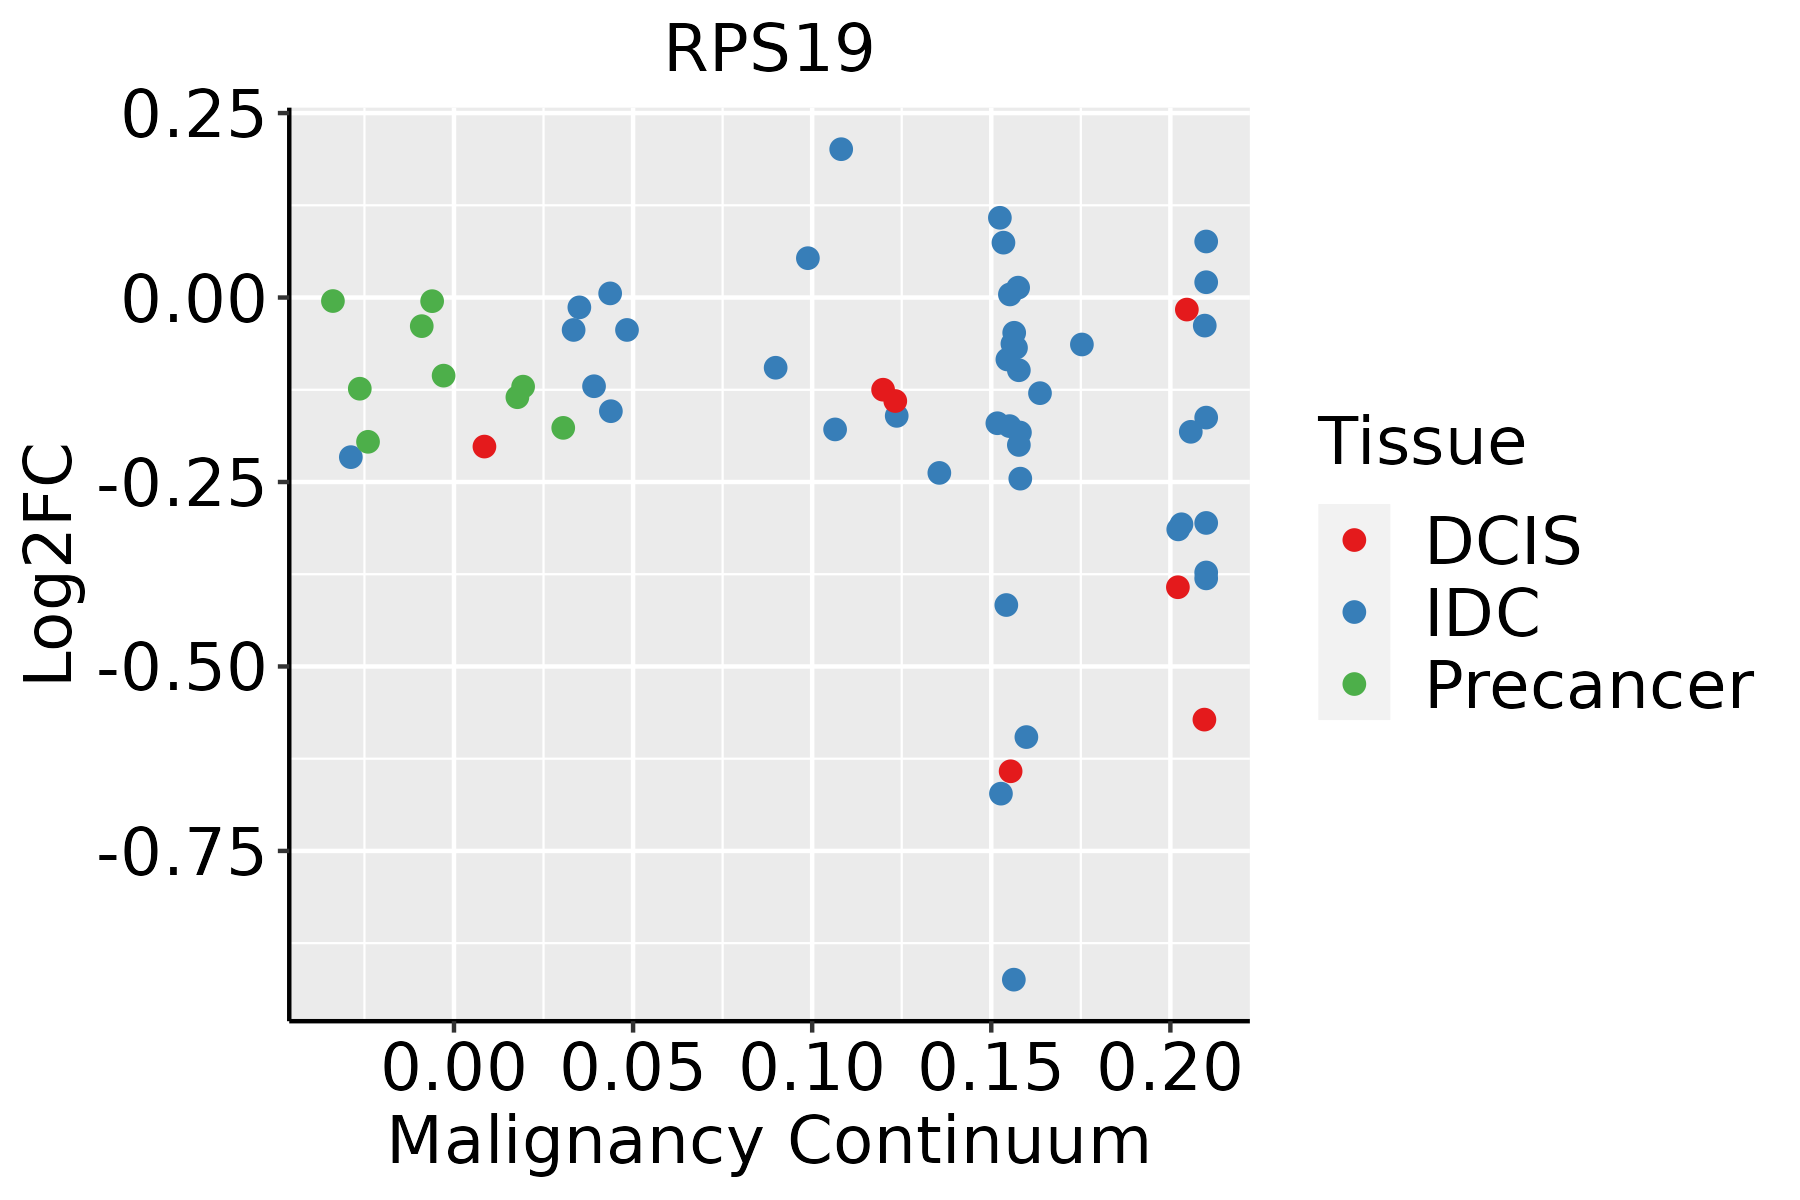 | IDC: Invasive ductal carcinoma |
| DCIS: Ductal carcinoma in situ | ||
| Precancer(BRCA1-mut): Precancerous lesion from BRCA1 mutation carriers | ||
| Cervix | 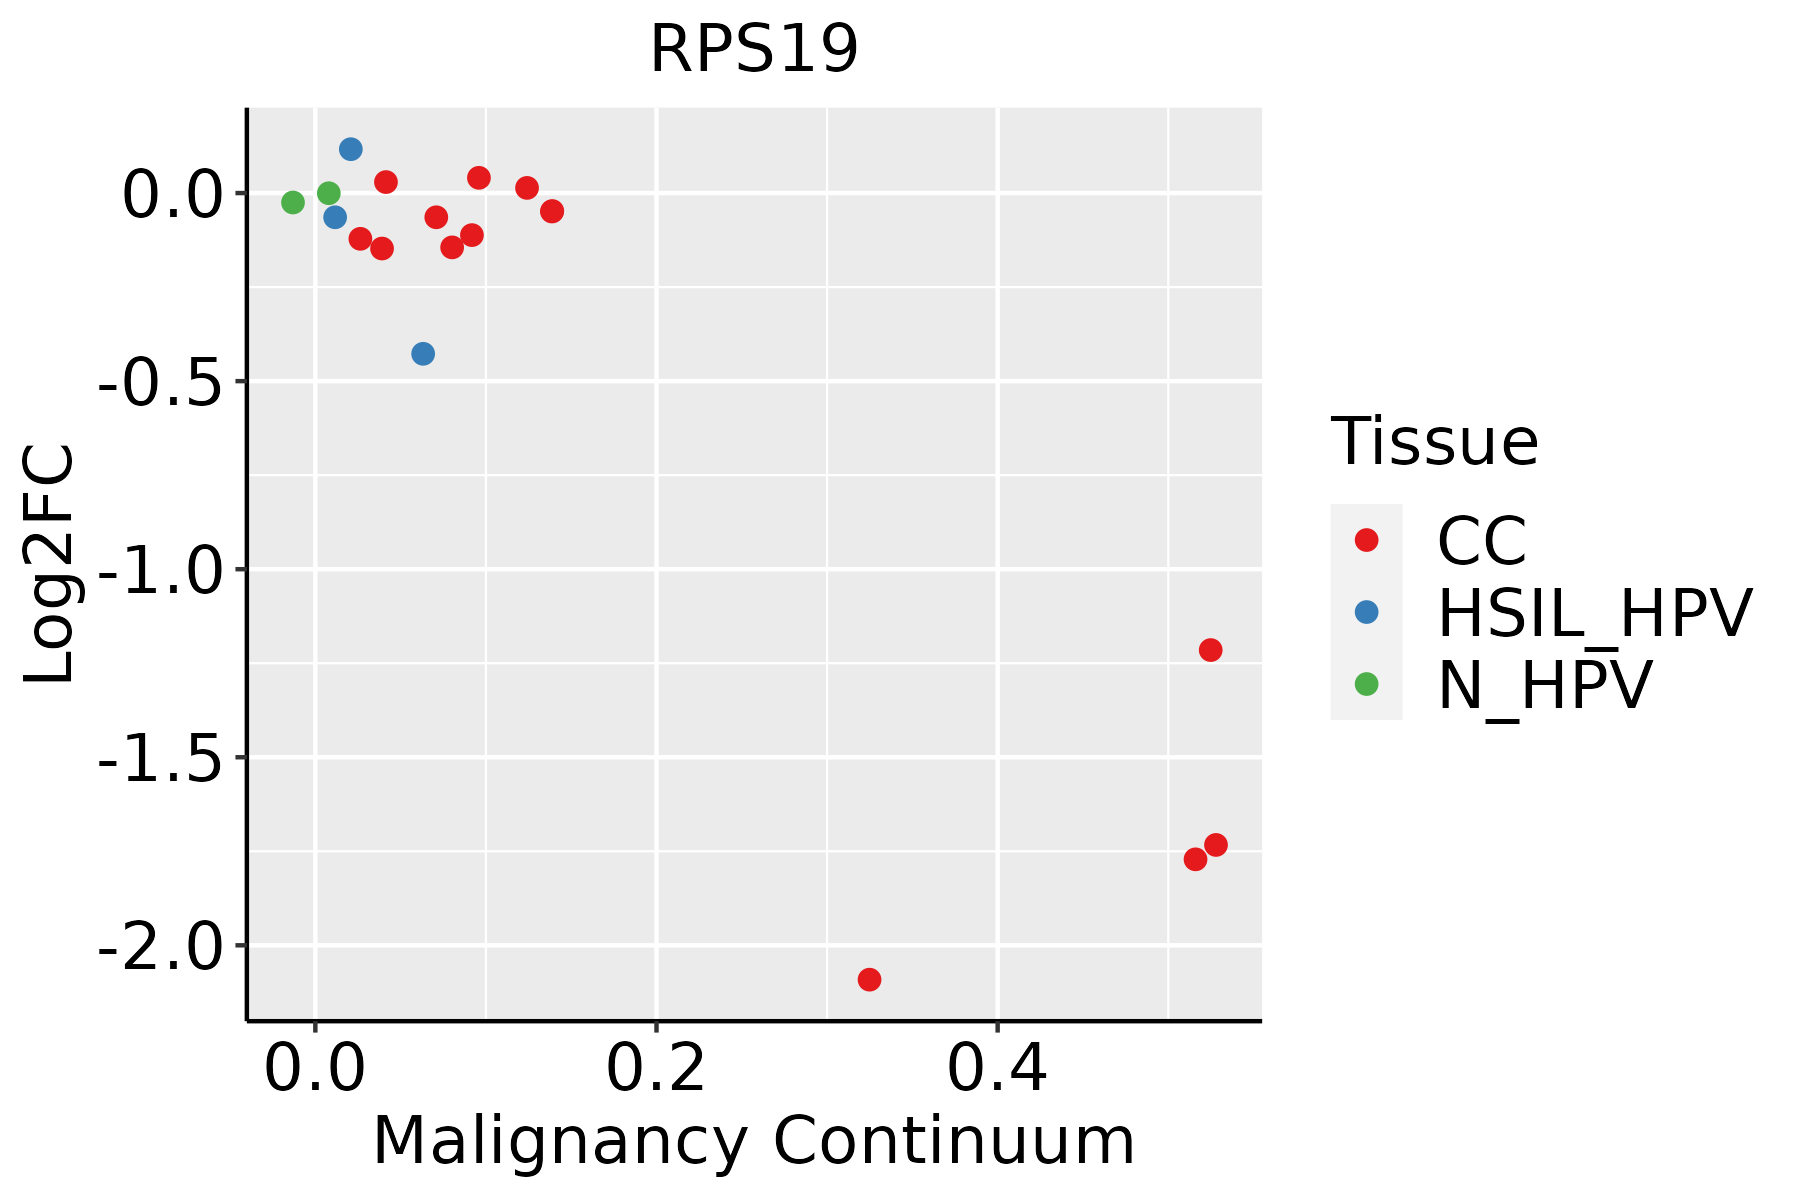 | CC: Cervix cancer |
| HSIL_HPV: HPV-infected high-grade squamous intraepithelial lesions | ||
| N_HPV: HPV-infected normal cervix | ||
| Colorectum (GSE201348) |  | FAP: Familial adenomatous polyposis |
| CRC: Colorectal cancer | ||
| Colorectum (HTA11) |  | AD: Adenomas |
| SER: Sessile serrated lesions | ||
| MSI-H: Microsatellite-high colorectal cancer | ||
| MSS: Microsatellite stable colorectal cancer | ||
| Endometrium |  | AEH: Atypical endometrial hyperplasia |
| EEC: Endometrioid Cancer | ||
| Esophagus |  | ESCC: Esophageal squamous cell carcinoma |
| HGIN: High-grade intraepithelial neoplasias | ||
| LGIN: Low-grade intraepithelial neoplasias | ||
| Liver | 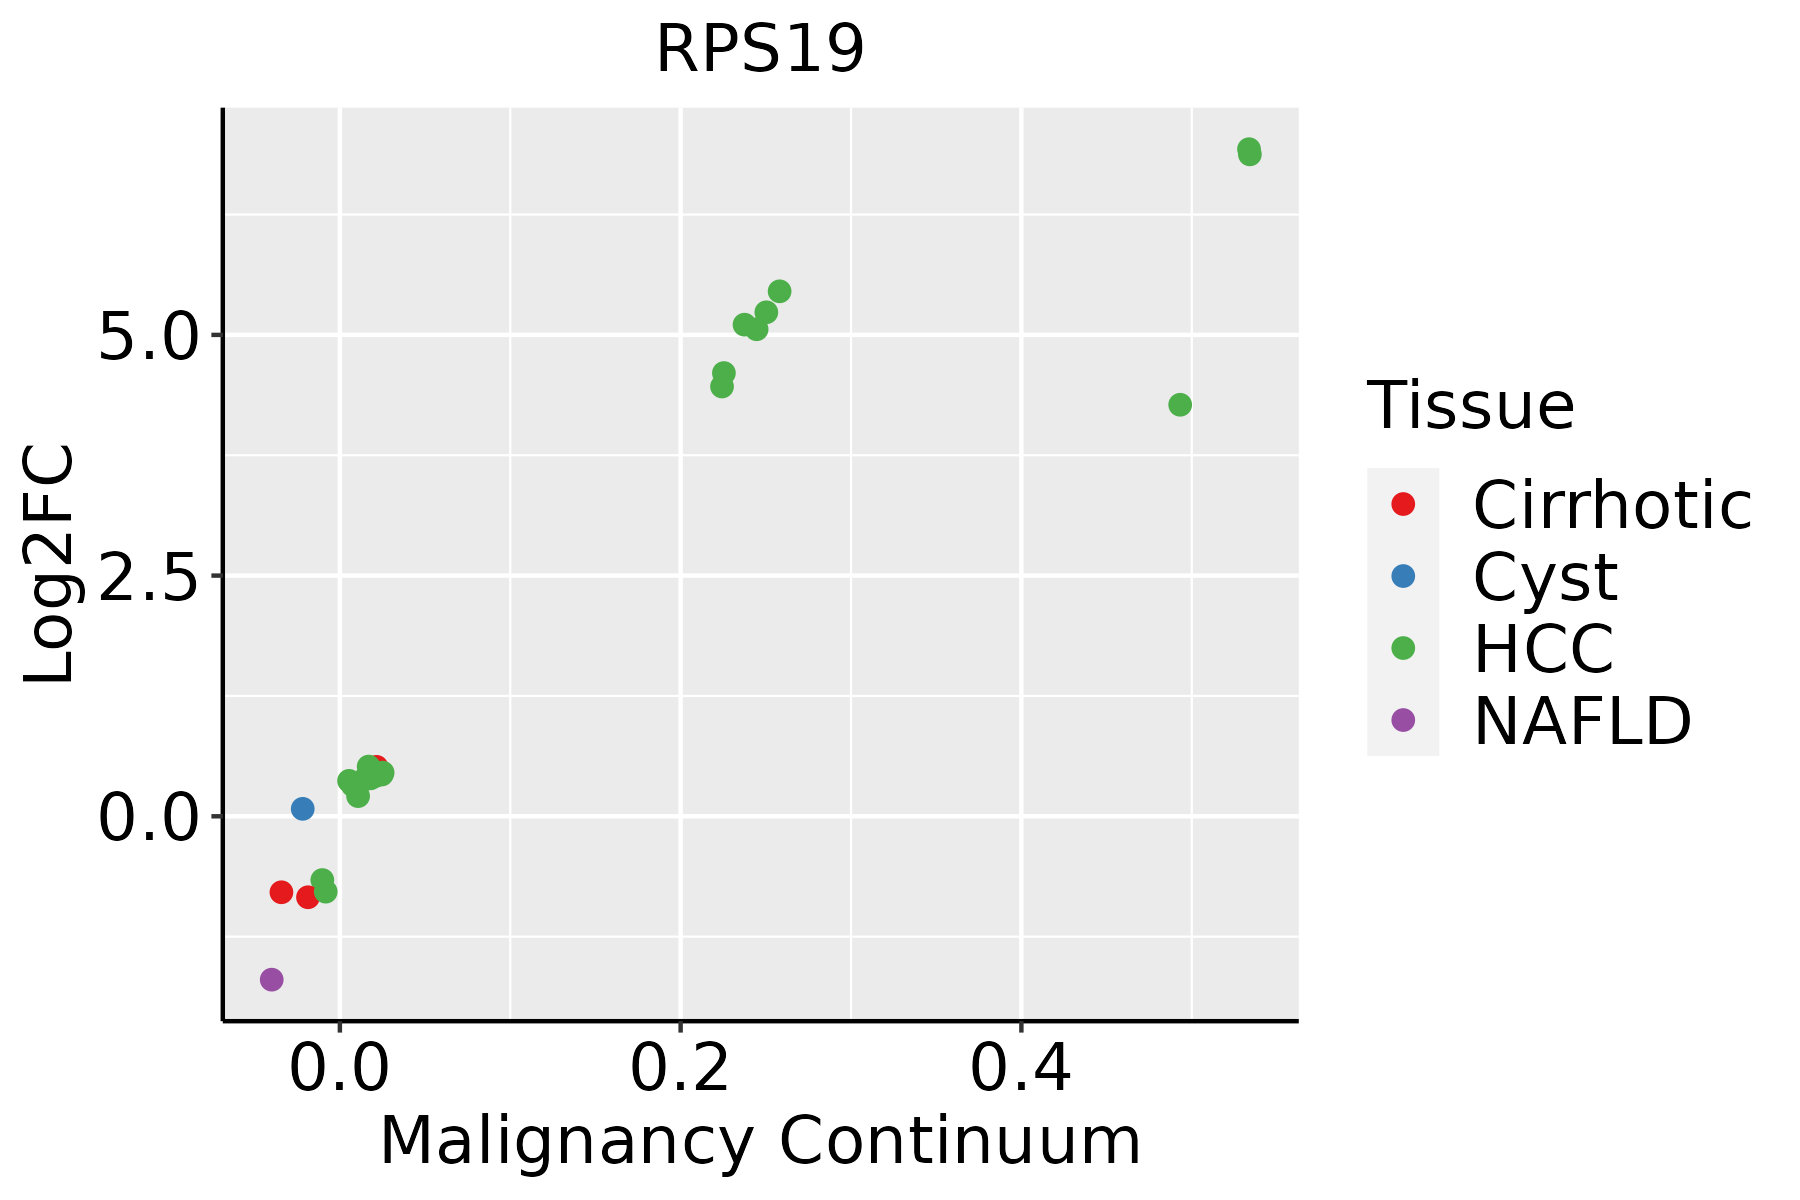 | HCC: Hepatocellular carcinoma |
| NAFLD: Non-alcoholic fatty liver disease | ||
| Lung | 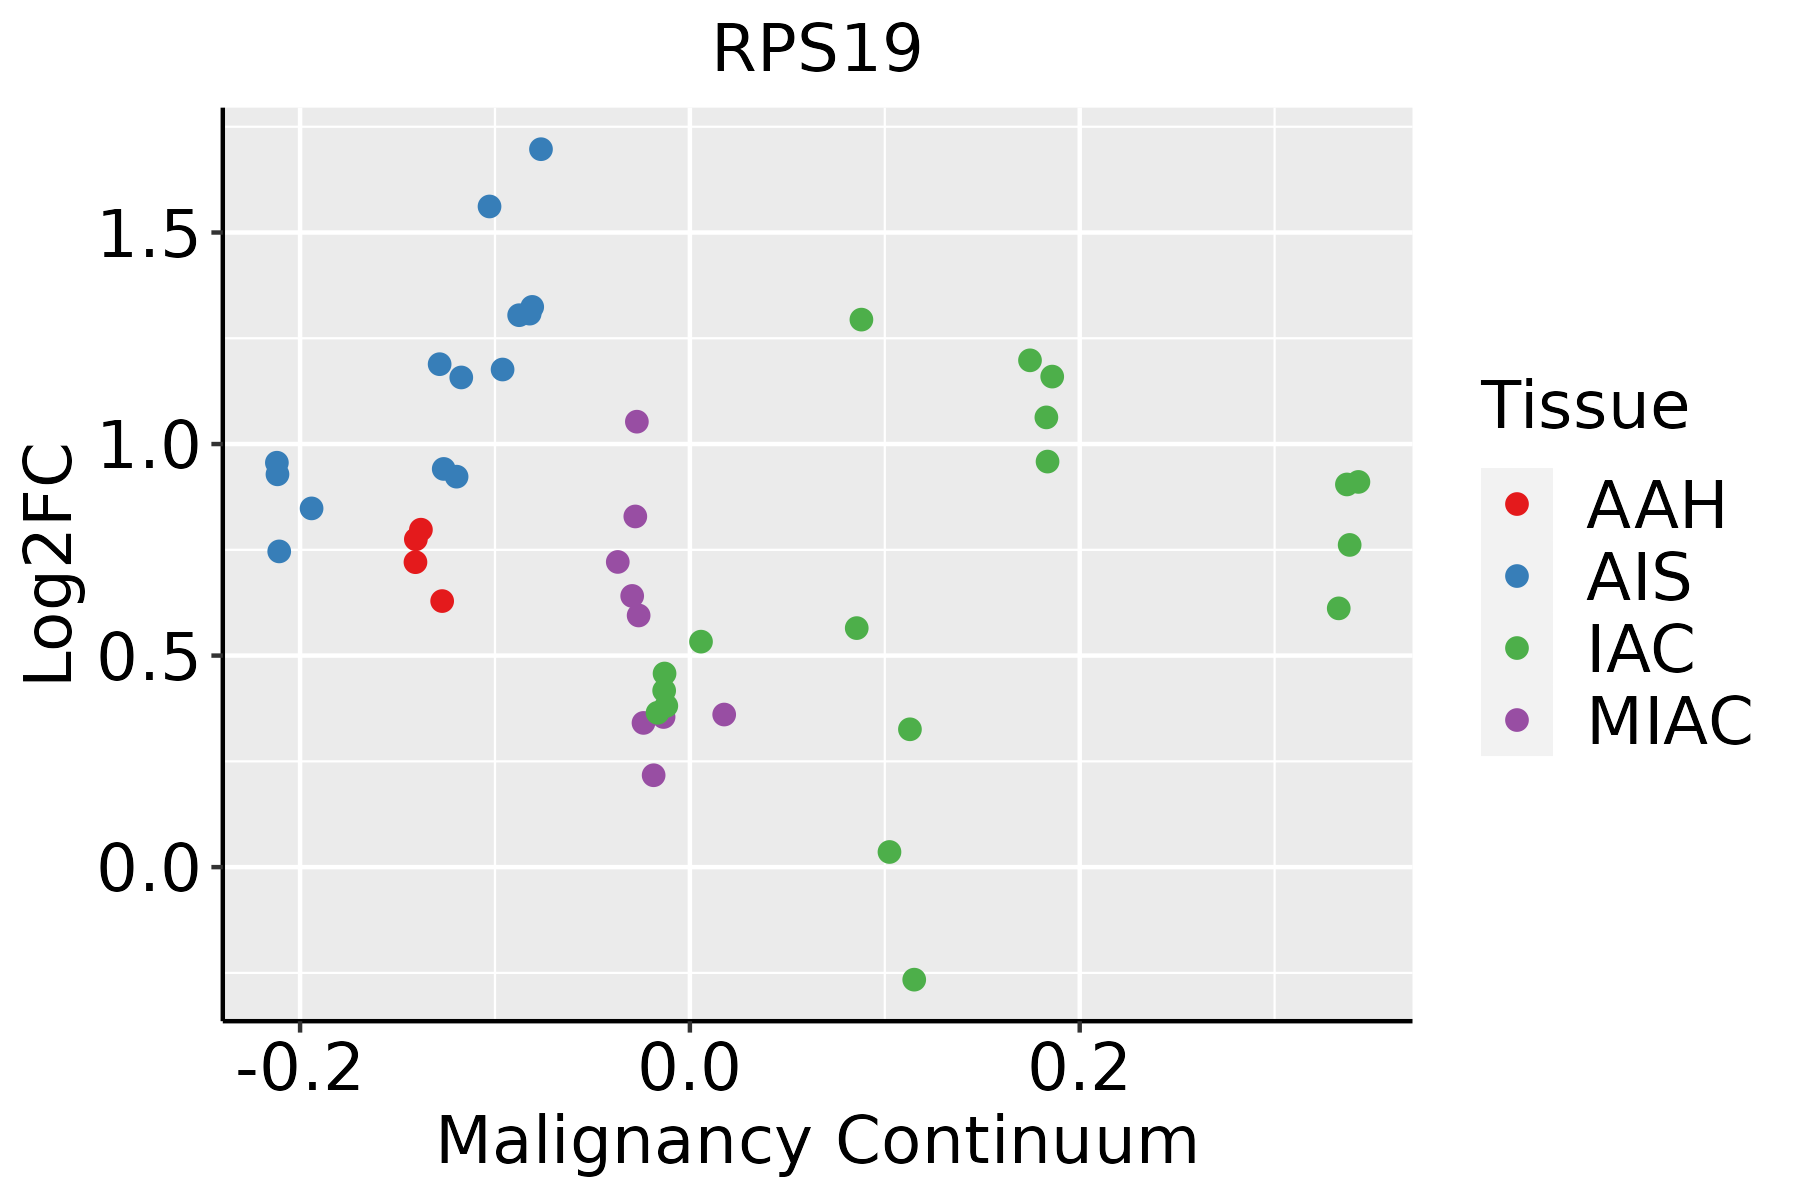 | AAH: Atypical adenomatous hyperplasia |
| AIS: Adenocarcinoma in situ | ||
| IAC: Invasive lung adenocarcinoma | ||
| MIA: Minimally invasive adenocarcinoma | ||
| Oral Cavity | 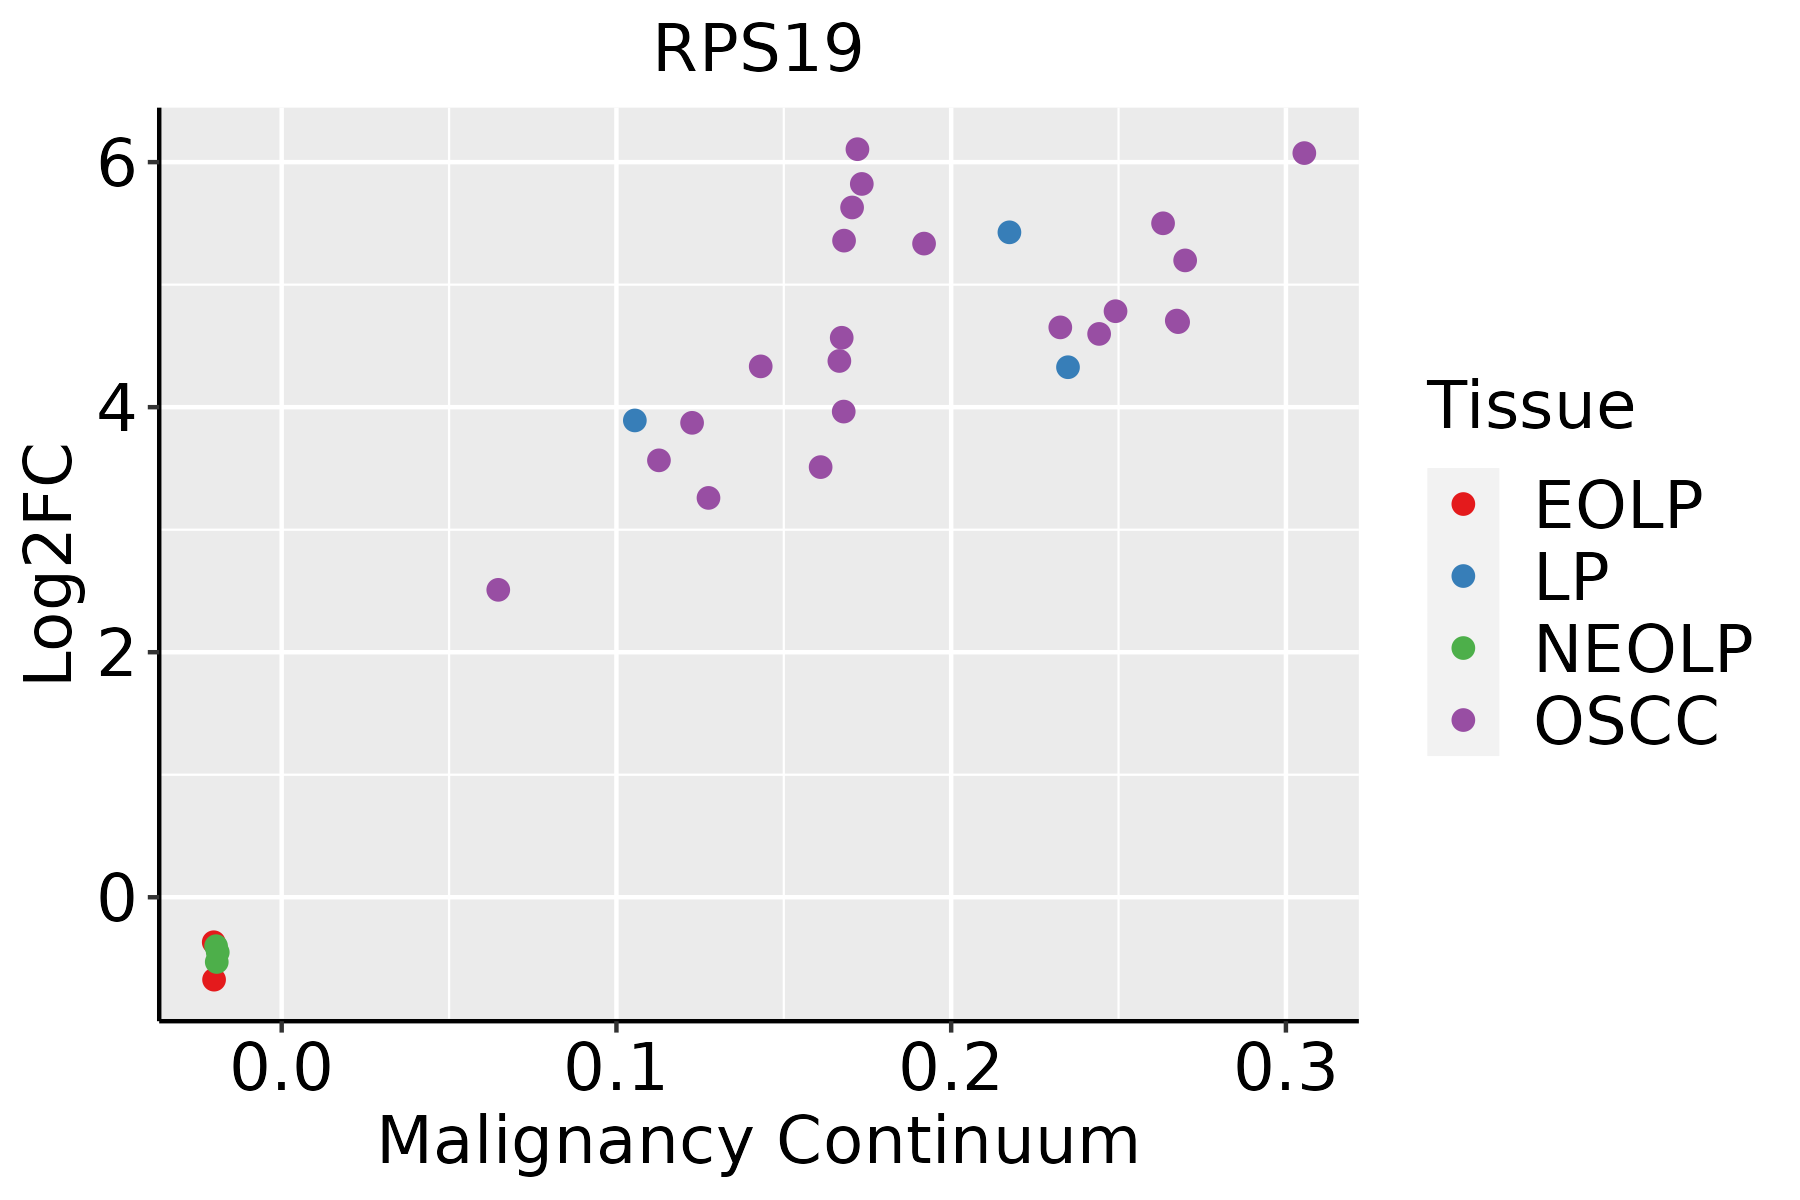 | EOLP: Erosive Oral lichen planus |
| LP: leukoplakia | ||
| NEOLP: Non-erosive oral lichen planus | ||
| OSCC: Oral squamous cell carcinoma | ||
| Prostate |  | BPH: Benign Prostatic Hyperplasia |
| Skin |  | AK: Actinic keratosis |
| cSCC: Cutaneous squamous cell carcinoma | ||
| SCCIS:squamous cell carcinoma in situ | ||
| Thyroid | 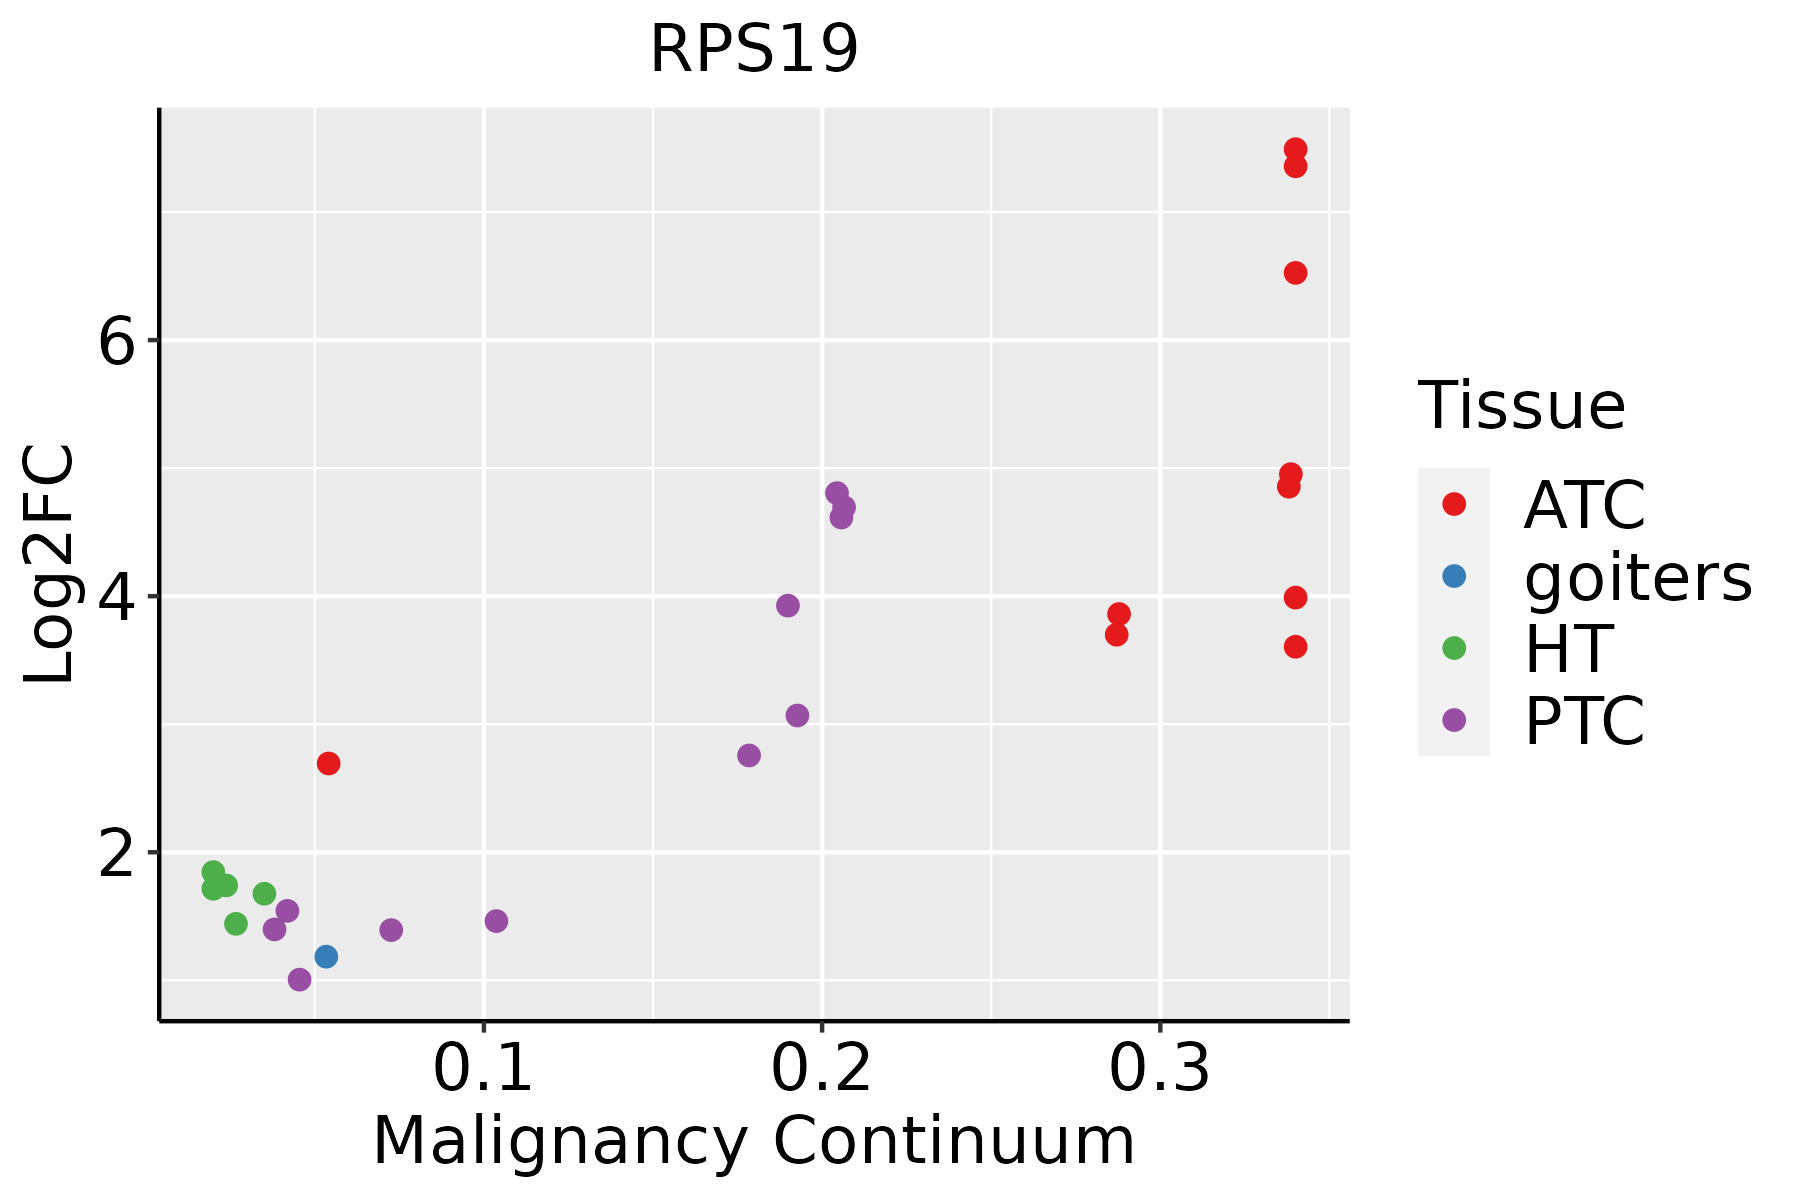 | ATC: Anaplastic thyroid cancer |
| HT: Hashimoto's thyroiditis | ||
| PTC: Papillary thyroid cancer |
| ∗log2FC in expression of this searched gene in stem-like cells from each diseased tissue sample relative to stem-like cells in normal samples in each tissue plotted against the malignancy continuum. Samples are colored based on if they are from different disease stage. |
Top |
Malignant transformation related pathway analysis |
| Find out the enriched GO biological processes and KEGG pathways involved in transition from healthy to precancer to cancer |
| Tissue | Disease Stage | Enriched GO biological Processes |
| Colorectum | AD |  |
| Colorectum | SER |  |
| Colorectum | MSS |  |
| Colorectum | MSI-H |  |
| Colorectum | FAP |  |
| ∗Top 15 enriched GO BP terms are showed in the bar plot of each disease state in each tissue. Each row represents a significant GO biological process which is colored according to the -log10(p.adjust). |
| Page: 1 2 3 4 5 6 7 8 9 |
| GO ID | Tissue | Disease Stage | Description | Gene Ratio | Bg Ratio | pvalue | p.adjust | Count |
| GO:007182630 | Thyroid | HT | ribonucleoprotein complex subunit organization | 43/1272 | 227/18723 | 7.18e-10 | 8.12e-08 | 43 |
| GO:004225530 | Thyroid | HT | ribosome assembly | 20/1272 | 61/18723 | 1.61e-09 | 1.72e-07 | 20 |
| GO:004225429 | Thyroid | HT | ribosome biogenesis | 48/1272 | 299/18723 | 2.16e-08 | 1.70e-06 | 48 |
| GO:004227430 | Thyroid | HT | ribosomal small subunit biogenesis | 20/1272 | 73/18723 | 5.05e-08 | 3.16e-06 | 20 |
| GO:000002830 | Thyroid | HT | ribosomal small subunit assembly | 9/1272 | 19/18723 | 1.49e-06 | 5.66e-05 | 9 |
| GO:00507297 | Thyroid | HT | positive regulation of inflammatory response | 26/1272 | 142/18723 | 3.14e-06 | 1.08e-04 | 26 |
| GO:00457309 | Thyroid | HT | respiratory burst | 12/1272 | 37/18723 | 3.46e-06 | 1.15e-04 | 12 |
| GO:00321039 | Thyroid | HT | positive regulation of response to external stimulus | 55/1272 | 427/18723 | 3.50e-06 | 1.16e-04 | 55 |
| GO:00313497 | Thyroid | HT | positive regulation of defense response | 40/1272 | 278/18723 | 5.40e-06 | 1.66e-04 | 40 |
| GO:003410130 | Thyroid | HT | erythrocyte homeostasis | 24/1272 | 129/18723 | 5.57e-06 | 1.68e-04 | 24 |
| GO:000226230 | Thyroid | HT | myeloid cell homeostasis | 27/1272 | 157/18723 | 6.97e-06 | 2.01e-04 | 27 |
| GO:004887230 | Thyroid | HT | homeostasis of number of cells | 38/1272 | 272/18723 | 1.82e-05 | 4.31e-04 | 38 |
| GO:000268319 | Thyroid | HT | negative regulation of immune system process | 52/1272 | 434/18723 | 4.74e-05 | 9.49e-04 | 52 |
| GO:003021829 | Thyroid | HT | erythrocyte differentiation | 21/1272 | 120/18723 | 5.43e-05 | 1.06e-03 | 21 |
| GO:000636425 | Thyroid | HT | rRNA processing | 32/1272 | 225/18723 | 5.72e-05 | 1.10e-03 | 32 |
| GO:00602636 | Thyroid | HT | regulation of respiratory burst | 7/1272 | 17/18723 | 6.97e-05 | 1.27e-03 | 7 |
| GO:006032616 | Thyroid | HT | cell chemotaxis | 40/1272 | 310/18723 | 6.97e-05 | 1.27e-03 | 40 |
| GO:00069598 | Thyroid | HT | humoral immune response | 40/1272 | 317/18723 | 1.14e-04 | 1.86e-03 | 40 |
| GO:001607225 | Thyroid | HT | rRNA metabolic process | 32/1272 | 236/18723 | 1.43e-04 | 2.21e-03 | 32 |
| GO:003009930 | Thyroid | HT | myeloid cell differentiation | 45/1272 | 381/18723 | 2.07e-04 | 3.00e-03 | 45 |
| Page: 1 2 3 4 5 6 7 8 9 10 11 12 13 14 15 16 17 18 19 20 21 22 23 24 25 26 27 28 29 30 31 32 33 34 35 36 37 38 39 40 |
| Pathway ID | Tissue | Disease Stage | Description | Gene Ratio | Bg Ratio | pvalue | p.adjust | qvalue | Count |
| hsa0301018 | Breast | Precancer | Ribosome | 80/684 | 167/8465 | 7.33e-44 | 2.32e-41 | 1.77e-41 | 80 |
| hsa0517118 | Breast | Precancer | Coronavirus disease - COVID-19 | 81/684 | 232/8465 | 3.74e-32 | 2.36e-30 | 1.81e-30 | 81 |
| hsa0301019 | Breast | Precancer | Ribosome | 80/684 | 167/8465 | 7.33e-44 | 2.32e-41 | 1.77e-41 | 80 |
| hsa0517119 | Breast | Precancer | Coronavirus disease - COVID-19 | 81/684 | 232/8465 | 3.74e-32 | 2.36e-30 | 1.81e-30 | 81 |
| hsa0301024 | Breast | IDC | Ribosome | 83/867 | 167/8465 | 6.07e-39 | 9.87e-37 | 7.38e-37 | 83 |
| hsa0517124 | Breast | IDC | Coronavirus disease - COVID-19 | 86/867 | 232/8465 | 1.50e-28 | 9.72e-27 | 7.27e-27 | 86 |
| hsa0301034 | Breast | IDC | Ribosome | 83/867 | 167/8465 | 6.07e-39 | 9.87e-37 | 7.38e-37 | 83 |
| hsa0517134 | Breast | IDC | Coronavirus disease - COVID-19 | 86/867 | 232/8465 | 1.50e-28 | 9.72e-27 | 7.27e-27 | 86 |
| hsa0301044 | Breast | DCIS | Ribosome | 82/846 | 167/8465 | 8.69e-39 | 1.40e-36 | 1.03e-36 | 82 |
| hsa0517144 | Breast | DCIS | Coronavirus disease - COVID-19 | 86/846 | 232/8465 | 2.42e-29 | 1.56e-27 | 1.15e-27 | 86 |
| hsa0301054 | Breast | DCIS | Ribosome | 82/846 | 167/8465 | 8.69e-39 | 1.40e-36 | 1.03e-36 | 82 |
| hsa0517154 | Breast | DCIS | Coronavirus disease - COVID-19 | 86/846 | 232/8465 | 2.42e-29 | 1.56e-27 | 1.15e-27 | 86 |
| hsa0517120 | Cervix | CC | Coronavirus disease - COVID-19 | 111/1267 | 232/8465 | 1.82e-33 | 5.90e-31 | 3.49e-31 | 111 |
| hsa0301020 | Cervix | CC | Ribosome | 85/1267 | 167/8465 | 3.17e-28 | 5.14e-26 | 3.04e-26 | 85 |
| hsa05171110 | Cervix | CC | Coronavirus disease - COVID-19 | 111/1267 | 232/8465 | 1.82e-33 | 5.90e-31 | 3.49e-31 | 111 |
| hsa03010110 | Cervix | CC | Ribosome | 85/1267 | 167/8465 | 3.17e-28 | 5.14e-26 | 3.04e-26 | 85 |
| hsa0301025 | Cervix | HSIL_HPV | Ribosome | 80/459 | 167/8465 | 9.61e-58 | 2.82e-55 | 2.28e-55 | 80 |
| hsa0517125 | Cervix | HSIL_HPV | Coronavirus disease - COVID-19 | 91/459 | 232/8465 | 2.14e-56 | 3.13e-54 | 2.53e-54 | 91 |
| hsa0301035 | Cervix | HSIL_HPV | Ribosome | 80/459 | 167/8465 | 9.61e-58 | 2.82e-55 | 2.28e-55 | 80 |
| hsa0517135 | Cervix | HSIL_HPV | Coronavirus disease - COVID-19 | 91/459 | 232/8465 | 2.14e-56 | 3.13e-54 | 2.53e-54 | 91 |
| Page: 1 2 3 4 5 6 |
Top |
Cell-cell communication analysis |
| Identification of potential cell-cell interactions between two cell types and their ligand-receptor pairs for different disease states |
| Ligand | Receptor | LRpair | Pathway | Tissue | Disease Stage |
| Page: 1 |
Top |
Single-cell gene regulatory network inference analysis |
| Find out the significant the regulons (TFs) and the target genes of each regulon across cell types for different disease states |
| TF | Cell Type | Tissue | Disease Stage | Target Gene | RSS | Regulon Activity |
| ∗The dot plots of a searched regulon are shown for all cell subpopulations in each disease state of each tissue based on the regulon specific score inferred using pySCENIC and by calculating the average expression. |
| Page: 1 |
Top |
Somatic mutation of malignant transformation related genes |
| Annotation of somatic variants for genes involved in malignant transformation |
| Hugo Symbol | Variant Class | Variant Classification | dbSNP RS | HGVSc | HGVSp | HGVSp Short | SWISSPROT | BIOTYPE | SIFT | PolyPhen | Tumor Sample Barcode | Tissue | Histology | Sex | Age | Stage | Therapy Types | Drugs | Outcome |
| RPS19 | SNV | Missense_Mutation | c.52N>G | p.Leu18Val | p.L18V | P39019 | protein_coding | tolerated(0.13) | benign(0.158) | TCGA-DS-A1OC-01 | Cervix | cervical & endocervical cancer | Female | <65 | I/II | Chemotherapy | gemcitabine | SD | |
| RPS19 | SNV | Missense_Mutation | c.52N>G | p.Leu18Val | p.L18V | P39019 | protein_coding | tolerated(0.13) | benign(0.158) | TCGA-JX-A3Q0-01 | Cervix | cervical & endocervical cancer | Female | <65 | III/IV | Unknown | Unknown | SD | |
| RPS19 | SNV | Missense_Mutation | c.305N>T | p.Arg102Leu | p.R102L | P39019 | protein_coding | tolerated(0.08) | benign(0.006) | TCGA-VS-A94Z-01 | Cervix | cervical & endocervical cancer | Female | <65 | I/II | Chemotherapy | cisplatin | CR | |
| RPS19 | SNV | Missense_Mutation | novel | c.150N>T | p.Glu50Asp | p.E50D | P39019 | protein_coding | tolerated(0.24) | benign(0.005) | TCGA-AG-A002-01 | Colorectum | rectum adenocarcinoma | Male | <65 | I/II | Unknown | Unknown | SD |
| RPS19 | SNV | Missense_Mutation | novel | c.80N>C | p.Lys27Thr | p.K27T | P39019 | protein_coding | deleterious(0) | probably_damaging(0.981) | TCGA-EO-A22R-01 | Endometrium | uterine corpus endometrioid carcinoma | Female | <65 | I/II | Unknown | Unknown | SD |
| RPS19 | SNV | Missense_Mutation | novel | c.404N>G | p.Ala135Gly | p.A135G | P39019 | protein_coding | deleterious(0) | possibly_damaging(0.897) | TCGA-QS-A8F1-01 | Endometrium | uterine corpus endometrioid carcinoma | Female | >=65 | III/IV | Chemotherapy | carboplatin | PD |
| RPS19 | SNV | Missense_Mutation | c.209C>T | p.Ala70Val | p.A70V | P39019 | protein_coding | tolerated(1) | benign(0.019) | TCGA-50-5946-01 | Lung | lung adenocarcinoma | Male | <65 | I/II | Unknown | Unknown | PD | |
| RPS19 | SNV | Missense_Mutation | c.302N>A | p.Arg101His | p.R101H | P39019 | protein_coding | tolerated(0.07) | benign(0.172) | TCGA-CN-4728-01 | Oral cavity | head & neck squamous cell carcinoma | Male | <65 | I/II | Chemotherapy | vectibix | SD |
| Page: 1 |
Top |
Related drugs of malignant transformation related genes |
| Identification of chemicals and drugs interact with genes involved in malignant transfromation |
| (DGIdb 4.0) |
| Entrez ID | Symbol | Category | Interaction Types | Drug Claim Name | Drug Name | PMIDs |
| 6223 | RPS19 | NA | VITAMIN A | 12175513 | ||
| 6223 | RPS19 | NA | DEXAMETHASONE | DEXAMETHASONE | 15755903 |
| Page: 1 |

Copyright 2023-Present -The University of Texas Health Science Center at Houston |