
|
|||||
|
 | |
| |
| |
| |
| |
| |
|
Gene: LRRK2 |
Gene summary for LRRK2 |
| Gene information | Species | Human | Gene symbol | LRRK2 | Gene ID | 120892 |
| Gene name | leucine rich repeat kinase 2 | |
| Gene Alias | AURA17 | |
| Cytomap | 12q12 | |
| Gene Type | protein-coding | GO ID | GO:0000003 | UniProtAcc | Q17RV3 |
Top |
Malignant transformation analysis |
| Identification of the aberrant gene expression in precancerous and cancerous lesions by comparing the gene expression of stem-like cells in diseased tissues with normal stem cells |
| Entrez ID | Symbol | Replicates | Species | Organ | Tissue | Adj P-value | Log2FC | Malignancy |
| 120892 | LRRK2 | RNA-P25T1-P25T1-1 | Human | Lung | AIS | 7.85e-12 | 9.89e-01 | -0.2116 |
| 120892 | LRRK2 | RNA-P25T1-P25T1-2 | Human | Lung | AIS | 1.06e-06 | 9.66e-01 | -0.1941 |
| 120892 | LRRK2 | RNA-P25T1-P25T1-3 | Human | Lung | AIS | 1.28e-12 | 1.06e+00 | -0.2107 |
| 120892 | LRRK2 | RNA-P25T1-P25T1-4 | Human | Lung | AIS | 4.75e-17 | 1.09e+00 | -0.2119 |
| 120892 | LRRK2 | RNA-P3T-P3T-1 | Human | Lung | IAC | 5.14e-06 | -1.10e+00 | 0.1829 |
| 120892 | LRRK2 | RNA-P3T-P3T-2 | Human | Lung | IAC | 5.47e-06 | -1.10e+00 | 0.1835 |
| 120892 | LRRK2 | RNA-P3T-P3T-4 | Human | Lung | IAC | 1.93e-05 | -9.51e-01 | 0.1859 |
| 120892 | LRRK2 | RNA-P6T2-P6T2-1 | Human | Lung | IAC | 9.65e-21 | 8.45e-01 | -0.0166 |
| 120892 | LRRK2 | RNA-P6T2-P6T2-2 | Human | Lung | IAC | 4.81e-28 | 8.93e-01 | -0.0132 |
| 120892 | LRRK2 | RNA-P6T2-P6T2-3 | Human | Lung | IAC | 5.49e-26 | 8.56e-01 | -0.013 |
| 120892 | LRRK2 | RNA-P6T2-P6T2-4 | Human | Lung | IAC | 6.97e-22 | 8.43e-01 | -0.0121 |
| 120892 | LRRK2 | RNA-P7T1-P7T1-1 | Human | Lung | AIS | 8.22e-03 | 8.21e-01 | -0.0961 |
| 120892 | LRRK2 | RNA-P7T1-P7T1-2 | Human | Lung | AIS | 5.55e-03 | 7.44e-01 | -0.0876 |
| 120892 | LRRK2 | RNA-P7T1-P7T1-3 | Human | Lung | AIS | 5.39e-06 | 7.54e-01 | -0.0822 |
| 120892 | LRRK2 | male-WTA | Human | Thyroid | PTC | 5.10e-44 | 6.71e-01 | 0.1037 |
| 120892 | LRRK2 | female-WTA | Human | Thyroid | PTC | 2.63e-07 | 5.70e-01 | 0.0726 |
| 120892 | LRRK2 | PTC01 | Human | Thyroid | PTC | 7.12e-66 | 1.28e+00 | 0.1899 |
| 120892 | LRRK2 | PTC03 | Human | Thyroid | PTC | 2.27e-11 | 6.79e-01 | 0.1784 |
| 120892 | LRRK2 | PTC04 | Human | Thyroid | PTC | 4.49e-122 | 2.86e+00 | 0.1927 |
| 120892 | LRRK2 | PTC05 | Human | Thyroid | PTC | 5.15e-35 | 1.66e+00 | 0.2065 |
| Page: 1 2 |
| Tissue | Expression Dynamics | Abbreviation |
| Lung | 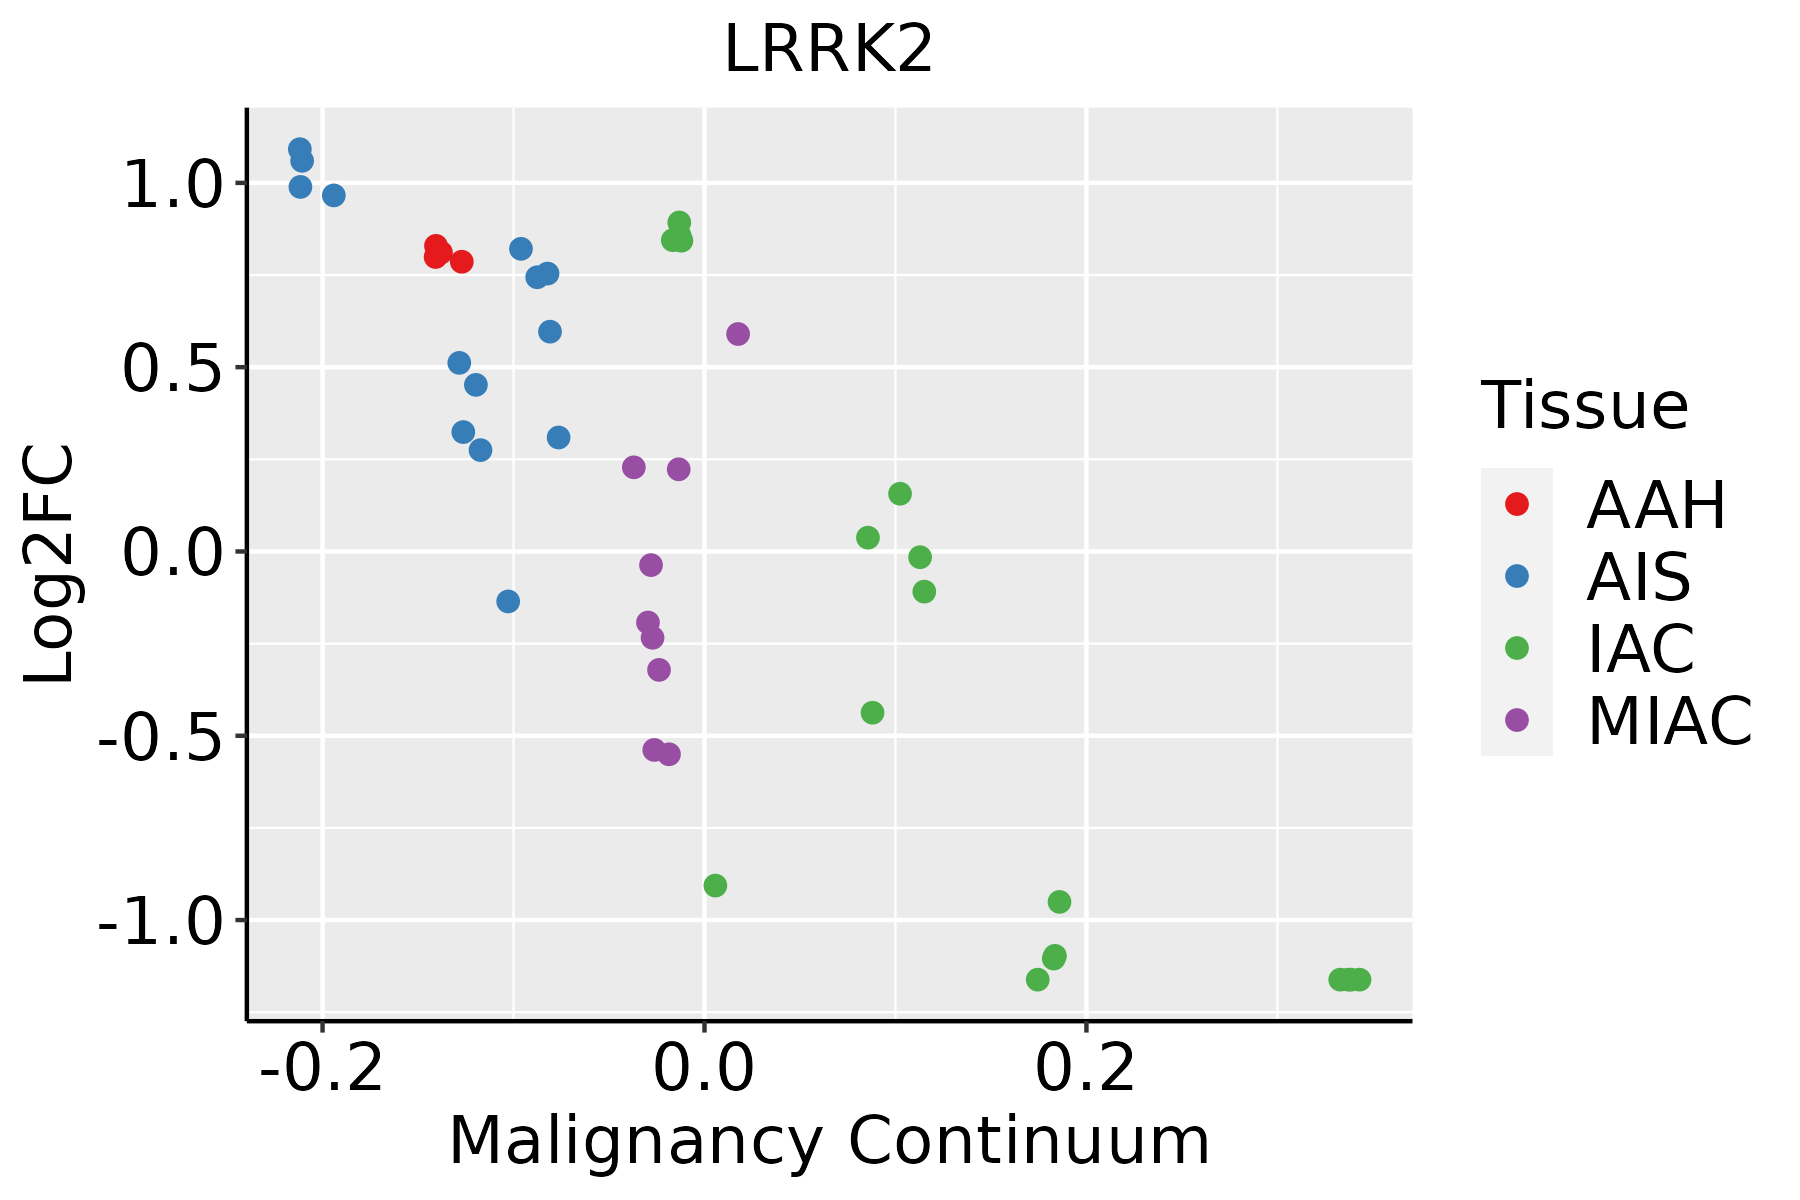 | AAH: Atypical adenomatous hyperplasia |
| AIS: Adenocarcinoma in situ | ||
| IAC: Invasive lung adenocarcinoma | ||
| MIA: Minimally invasive adenocarcinoma | ||
| Thyroid |  | ATC: Anaplastic thyroid cancer |
| HT: Hashimoto's thyroiditis | ||
| PTC: Papillary thyroid cancer |
| ∗log2FC in expression of this searched gene in stem-like cells from each diseased tissue sample relative to stem-like cells in normal samples in each tissue plotted against the malignancy continuum. Samples are colored based on if they are from different disease stage. |
Top |
Malignant transformation related pathway analysis |
| Find out the enriched GO biological processes and KEGG pathways involved in transition from healthy to precancer to cancer |
| Tissue | Disease Stage | Enriched GO biological Processes |
| Colorectum | AD |  |
| Colorectum | SER |  |
| Colorectum | MSS |  |
| Colorectum | MSI-H |  |
| Colorectum | FAP |  |
| ∗Top 15 enriched GO BP terms are showed in the bar plot of each disease state in each tissue. Each row represents a significant GO biological process which is colored according to the -log10(p.adjust). |
| Page: 1 2 3 4 5 6 7 8 9 |
| GO ID | Tissue | Disease Stage | Description | Gene Ratio | Bg Ratio | pvalue | p.adjust | Count |
| GO:004603912 | Thyroid | ATC | GTP metabolic process | 15/6293 | 25/18723 | 6.08e-03 | 2.44e-02 | 15 |
| GO:00903116 | Thyroid | ATC | regulation of protein deacetylation | 25/6293 | 48/18723 | 6.27e-03 | 2.50e-02 | 25 |
| GO:00518824 | Thyroid | ATC | mitochondrial depolarization | 14/6293 | 23/18723 | 6.70e-03 | 2.67e-02 | 14 |
| GO:200078513 | Thyroid | ATC | regulation of autophagosome assembly | 21/6293 | 39/18723 | 7.26e-03 | 2.86e-02 | 21 |
| GO:005105114 | Thyroid | ATC | negative regulation of transport | 183/6293 | 470/18723 | 8.12e-03 | 3.13e-02 | 183 |
| GO:190364913 | Thyroid | ATC | regulation of cytoplasmic transport | 16/6293 | 28/18723 | 8.86e-03 | 3.36e-02 | 16 |
| GO:00002663 | Thyroid | ATC | mitochondrial fission | 22/6293 | 42/18723 | 9.23e-03 | 3.44e-02 | 22 |
| GO:190040725 | Thyroid | ATC | regulation of cellular response to oxidative stress | 41/6293 | 89/18723 | 9.71e-03 | 3.56e-02 | 41 |
| GO:007124823 | Thyroid | ATC | cellular response to metal ion | 82/6293 | 197/18723 | 1.11e-02 | 3.99e-02 | 82 |
| GO:005164612 | Thyroid | ATC | mitochondrion localization | 25/6293 | 50/18723 | 1.20e-02 | 4.27e-02 | 25 |
| GO:005080712 | Thyroid | ATC | regulation of synapse organization | 87/6293 | 211/18723 | 1.20e-02 | 4.27e-02 | 87 |
| GO:0036474 | Thyroid | ATC | cell death in response to hydrogen peroxide | 17/6293 | 31/18723 | 1.21e-02 | 4.27e-02 | 17 |
| GO:1902882110 | Thyroid | ATC | regulation of response to oxidative stress | 44/6293 | 98/18723 | 1.30e-02 | 4.55e-02 | 44 |
| Page: 1 2 3 4 5 6 7 8 9 10 11 12 13 14 15 16 17 18 19 20 21 22 23 24 25 26 27 28 29 30 31 32 33 34 35 36 |
| Pathway ID | Tissue | Disease Stage | Description | Gene Ratio | Bg Ratio | pvalue | p.adjust | qvalue | Count |
| hsa0501216 | Lung | IAC | Parkinson disease | 47/1053 | 266/8465 | 7.53e-03 | 3.02e-02 | 2.01e-02 | 47 |
| hsa0501217 | Lung | IAC | Parkinson disease | 47/1053 | 266/8465 | 7.53e-03 | 3.02e-02 | 2.01e-02 | 47 |
| hsa0501223 | Lung | AIS | Parkinson disease | 44/961 | 266/8465 | 6.25e-03 | 2.98e-02 | 1.91e-02 | 44 |
| hsa0501233 | Lung | AIS | Parkinson disease | 44/961 | 266/8465 | 6.25e-03 | 2.98e-02 | 1.91e-02 | 44 |
| Page: 1 |
Top |
Cell-cell communication analysis |
| Identification of potential cell-cell interactions between two cell types and their ligand-receptor pairs for different disease states |
| Ligand | Receptor | LRpair | Pathway | Tissue | Disease Stage |
| Page: 1 |
Top |
Single-cell gene regulatory network inference analysis |
| Find out the significant the regulons (TFs) and the target genes of each regulon across cell types for different disease states |
| TF | Cell Type | Tissue | Disease Stage | Target Gene | RSS | Regulon Activity |
| ∗The dot plots of a searched regulon are shown for all cell subpopulations in each disease state of each tissue based on the regulon specific score inferred using pySCENIC and by calculating the average expression. |
| Page: 1 |
Top |
Somatic mutation of malignant transformation related genes |
| Annotation of somatic variants for genes involved in malignant transformation |
| Hugo Symbol | Variant Class | Variant Classification | dbSNP RS | HGVSc | HGVSp | HGVSp Short | SWISSPROT | BIOTYPE | SIFT | PolyPhen | Tumor Sample Barcode | Tissue | Histology | Sex | Age | Stage | Therapy Types | Drugs | Outcome |
| LRRK2 | SNV | Missense_Mutation | rs200688492 | c.25N>G | p.Cys9Gly | p.C9G | Q5S007 | protein_coding | tolerated_low_confidence(0.08) | benign(0.007) | TCGA-A2-A0SW-01 | Breast | breast invasive carcinoma | Female | >=65 | III/IV | Hormone Therapy | arimidex | PD |
| LRRK2 | SNV | Missense_Mutation | novel | c.1307N>A | p.Leu436Gln | p.L436Q | Q5S007 | protein_coding | deleterious(0) | probably_damaging(0.999) | TCGA-AC-A23G-01 | Breast | breast invasive carcinoma | Female | >=65 | I/II | Chemotherapy | cytoxan | CR |
| LRRK2 | SNV | Missense_Mutation | c.7522N>C | p.Glu2508Gln | p.E2508Q | Q5S007 | protein_coding | tolerated(0.53) | benign(0.012) | TCGA-AC-A23H-01 | Breast | breast invasive carcinoma | Female | >=65 | I/II | Unknown | Unknown | PD | |
| LRRK2 | SNV | Missense_Mutation | novel | c.3266N>G | p.Asn1089Ser | p.N1089S | Q5S007 | protein_coding | tolerated(0.12) | possibly_damaging(0.71) | TCGA-AN-A046-01 | Breast | breast invasive carcinoma | Female | >=65 | I/II | Unknown | Unknown | SD |
| LRRK2 | SNV | Missense_Mutation | novel | c.4469N>T | p.Ala1490Val | p.A1490V | Q5S007 | protein_coding | tolerated(0.18) | possibly_damaging(0.602) | TCGA-AN-A046-01 | Breast | breast invasive carcinoma | Female | >=65 | I/II | Unknown | Unknown | SD |
| LRRK2 | SNV | Missense_Mutation | c.5072N>C | p.Ile1691Thr | p.I1691T | Q5S007 | protein_coding | deleterious(0.04) | benign(0.215) | TCGA-AN-A0XO-01 | Breast | breast invasive carcinoma | Female | <65 | III/IV | Unknown | Unknown | SD | |
| LRRK2 | SNV | Missense_Mutation | c.5312N>C | p.Arg1771Thr | p.R1771T | Q5S007 | protein_coding | tolerated(0.11) | benign(0.152) | TCGA-AN-A0XU-01 | Breast | breast invasive carcinoma | Female | <65 | I/II | Unknown | Unknown | SD | |
| LRRK2 | SNV | Missense_Mutation | novel | c.2515N>A | p.Leu839Ile | p.L839I | Q5S007 | protein_coding | deleterious(0.01) | probably_damaging(0.997) | TCGA-BH-A1FN-01 | Breast | breast invasive carcinoma | Female | <65 | I/II | Unknown | Unknown | PD |
| LRRK2 | SNV | Missense_Mutation | novel | c.7367N>C | p.Arg2456Thr | p.R2456T | Q5S007 | protein_coding | deleterious(0) | probably_damaging(0.999) | TCGA-BH-A28O-01 | Breast | breast invasive carcinoma | Female | <65 | III/IV | Chemotherapy | cytoxan | CR |
| LRRK2 | SNV | Missense_Mutation | novel | c.6322N>A | p.Glu2108Lys | p.E2108K | Q5S007 | protein_coding | deleterious(0.03) | benign(0.27) | TCGA-C8-A3M7-01 | Breast | breast invasive carcinoma | Female | <65 | III/IV | Unknown | Unknown | PD |
| Page: 1 2 3 4 5 6 7 8 9 10 11 12 13 14 15 16 17 18 19 20 21 22 23 24 25 26 27 28 29 30 31 32 33 34 35 36 37 38 39 40 41 42 43 44 45 46 47 |
Top |
Related drugs of malignant transformation related genes |
| Identification of chemicals and drugs interact with genes involved in malignant transfromation |
| (DGIdb 4.0) |
| Entrez ID | Symbol | Category | Interaction Types | Drug Claim Name | Drug Name | PMIDs |
| 120892 | LRRK2 | KINASE, SERINE THREONINE KINASE, ENZYME, DRUGGABLE GENOME, CLINICALLY ACTIONABLE | AZD-1775 | ADAVOSERTIB | ||
| 120892 | LRRK2 | KINASE, SERINE THREONINE KINASE, ENZYME, DRUGGABLE GENOME, CLINICALLY ACTIONABLE | Pyridopyrimidinone derivative 2 | |||
| 120892 | LRRK2 | KINASE, SERINE THREONINE KINASE, ENZYME, DRUGGABLE GENOME, CLINICALLY ACTIONABLE | inhibitor | 384403651 | ||
| 120892 | LRRK2 | KINASE, SERINE THREONINE KINASE, ENZYME, DRUGGABLE GENOME, CLINICALLY ACTIONABLE | PMID28117607-Compound-21 | |||
| 120892 | LRRK2 | KINASE, SERINE THREONINE KINASE, ENZYME, DRUGGABLE GENOME, CLINICALLY ACTIONABLE | Pyridopyrimidinone derivative 1 | |||
| 120892 | LRRK2 | KINASE, SERINE THREONINE KINASE, ENZYME, DRUGGABLE GENOME, CLINICALLY ACTIONABLE | PALBOCICLIB | PALBOCICLIB | ||
| 120892 | LRRK2 | KINASE, SERINE THREONINE KINASE, ENZYME, DRUGGABLE GENOME, CLINICALLY ACTIONABLE | Aminopyridine derivative 2 | |||
| 120892 | LRRK2 | KINASE, SERINE THREONINE KINASE, ENZYME, DRUGGABLE GENOME, CLINICALLY ACTIONABLE | inhibitor | 328083498 | ||
| 120892 | LRRK2 | KINASE, SERINE THREONINE KINASE, ENZYME, DRUGGABLE GENOME, CLINICALLY ACTIONABLE | inhibitor | 328083494 | ||
| 120892 | LRRK2 | KINASE, SERINE THREONINE KINASE, ENZYME, DRUGGABLE GENOME, CLINICALLY ACTIONABLE | PHA-767491 | CHEMBL225519 |
| Page: 1 2 3 4 5 6 7 8 |

Copyright 2023-Present -The University of Texas Health Science Center at Houston |