Schematic overview of the cellular and molecular mechanisms involved in the cancer progression, including the proposed cellular and molecular mechanisms in cancer cells trajectory. AT1: alveolar type 1 cells; AT2: alveolar type 2 cells; AAH: atypical adenomatous hyperplasia; AIS: adenocarcinoma in situ; MIA: minimally invasive adenocarcinoma; IA: invasive adenocarcinoma; EMT: epithelial-mesenchymal transition

Home

Download

Statistics

Help

Contact

Center for Computational Systems Medicine
leaf

Gene summary

leaf

Malignant transformation analysis

leaf

Malignant transformation related pathway analysis

leaf

Cell-cell communication analysis

leaf

Single-cell gene regulatory network inference analysis

leaf

Somatic mutation of malignant transformation related genes

leaf

Related drugs of malignant transformation related genes

Gene: HIPK2

Gene summary for HIPK2

check button Gene summary.

Gene informationSpeciesHuman
Gene symbol

HIPK2

Gene ID

28996

Gene namehomeodomain interacting protein kinase 2
Gene AliasPRO0593
Cytomap7q34
Gene Typeprotein-coding
GO ID

GO:0000122

UniProtAcc

Q9H2X6


Top

Malignant transformation analysis

check button Identification of the aberrant gene expression in precancerous and cancerous lesions by comparing the gene expression of stem-like cells in diseased tissues with normal stem cells
check button Malignant transformation involving gene list.
Entrez IDSymbolReplicatesSpeciesOrganTissueAdj P-valueLog2FCMalignancy
28996HIPK2HTA11_1938_2000001011HumanColorectumAD1.64e-024.24e-01-0.0811
28996HIPK2HTA11_78_2000001011HumanColorectumAD4.10e-045.89e-01-0.1088
28996HIPK2HTA11_347_2000001011HumanColorectumAD3.08e-075.58e-01-0.1954
28996HIPK2HTA11_696_2000001011HumanColorectumAD3.85e-033.64e-01-0.1464
28996HIPK2HTA11_1391_2000001011HumanColorectumAD2.51e-035.17e-01-0.059
28996HIPK2HTA11_7696_3000711011HumanColorectumAD9.47e-033.65e-010.0674
28996HIPK2HTA11_99999965062_69753HumanColorectumMSI-H6.35e-039.82e-010.3487
28996HIPK2A015-C-203HumanColorectumFAP3.47e-13-1.54e-01-0.1294
28996HIPK2A015-C-204HumanColorectumFAP3.93e-02-1.25e-01-0.0228
28996HIPK2A002-C-201HumanColorectumFAP1.24e-05-4.85e-020.0324
28996HIPK2A002-C-203HumanColorectumFAP1.28e-022.25e-010.2786
28996HIPK2A001-C-108HumanColorectumFAP5.44e-07-9.74e-02-0.0272
28996HIPK2A002-C-021HumanColorectumFAP8.78e-032.96e-010.1171
28996HIPK2A002-C-205HumanColorectumFAP1.32e-12-1.10e-01-0.1236
28996HIPK2A015-C-006HumanColorectumFAP3.04e-10-2.84e-01-0.0994
28996HIPK2A015-C-106HumanColorectumFAP3.60e-04-3.09e-02-0.0511
28996HIPK2A002-C-114HumanColorectumFAP9.32e-11-6.80e-02-0.1561
28996HIPK2A015-C-104HumanColorectumFAP6.74e-16-6.46e-02-0.1899
28996HIPK2A001-C-014HumanColorectumFAP1.36e-04-1.06e-010.0135
28996HIPK2A002-C-016HumanColorectumFAP1.35e-09-1.54e-010.0521
Page: 1 2 3 4 5 6 7 8 9 10 

check button Transcriptomic changes along malignancy continuum.
TissueExpression DynamicsAbbreviation
Colorectum (GSE201348)The image shows the transcriptomic changes along malignancy continuum.log2FC in expression of this searched gene in stem-like cells from each diseased tissue sample relative to stem-like cells in normal samples in each tissue plotted against the malignancy continuum. Samples are colored based on if they are from different disease stage.FAP: Familial adenomatous polyposis
CRC: Colorectal cancer
Colorectum (HTA11)The image shows the transcriptomic changes along malignancy continuum.log2FC in expression of this searched gene in stem-like cells from each diseased tissue sample relative to stem-like cells in normal samples in each tissue plotted against the malignancy continuum. Samples are colored based on if they are from different disease stage.AD: Adenomas
SER: Sessile serrated lesions
MSI-H: Microsatellite-high colorectal cancer
MSS: Microsatellite stable colorectal cancer
EndometriumThe image shows the transcriptomic changes along malignancy continuum.log2FC in expression of this searched gene in stem-like cells from each diseased tissue sample relative to stem-like cells in normal samples in each tissue plotted against the malignancy continuum. Samples are colored based on if they are from different disease stage.
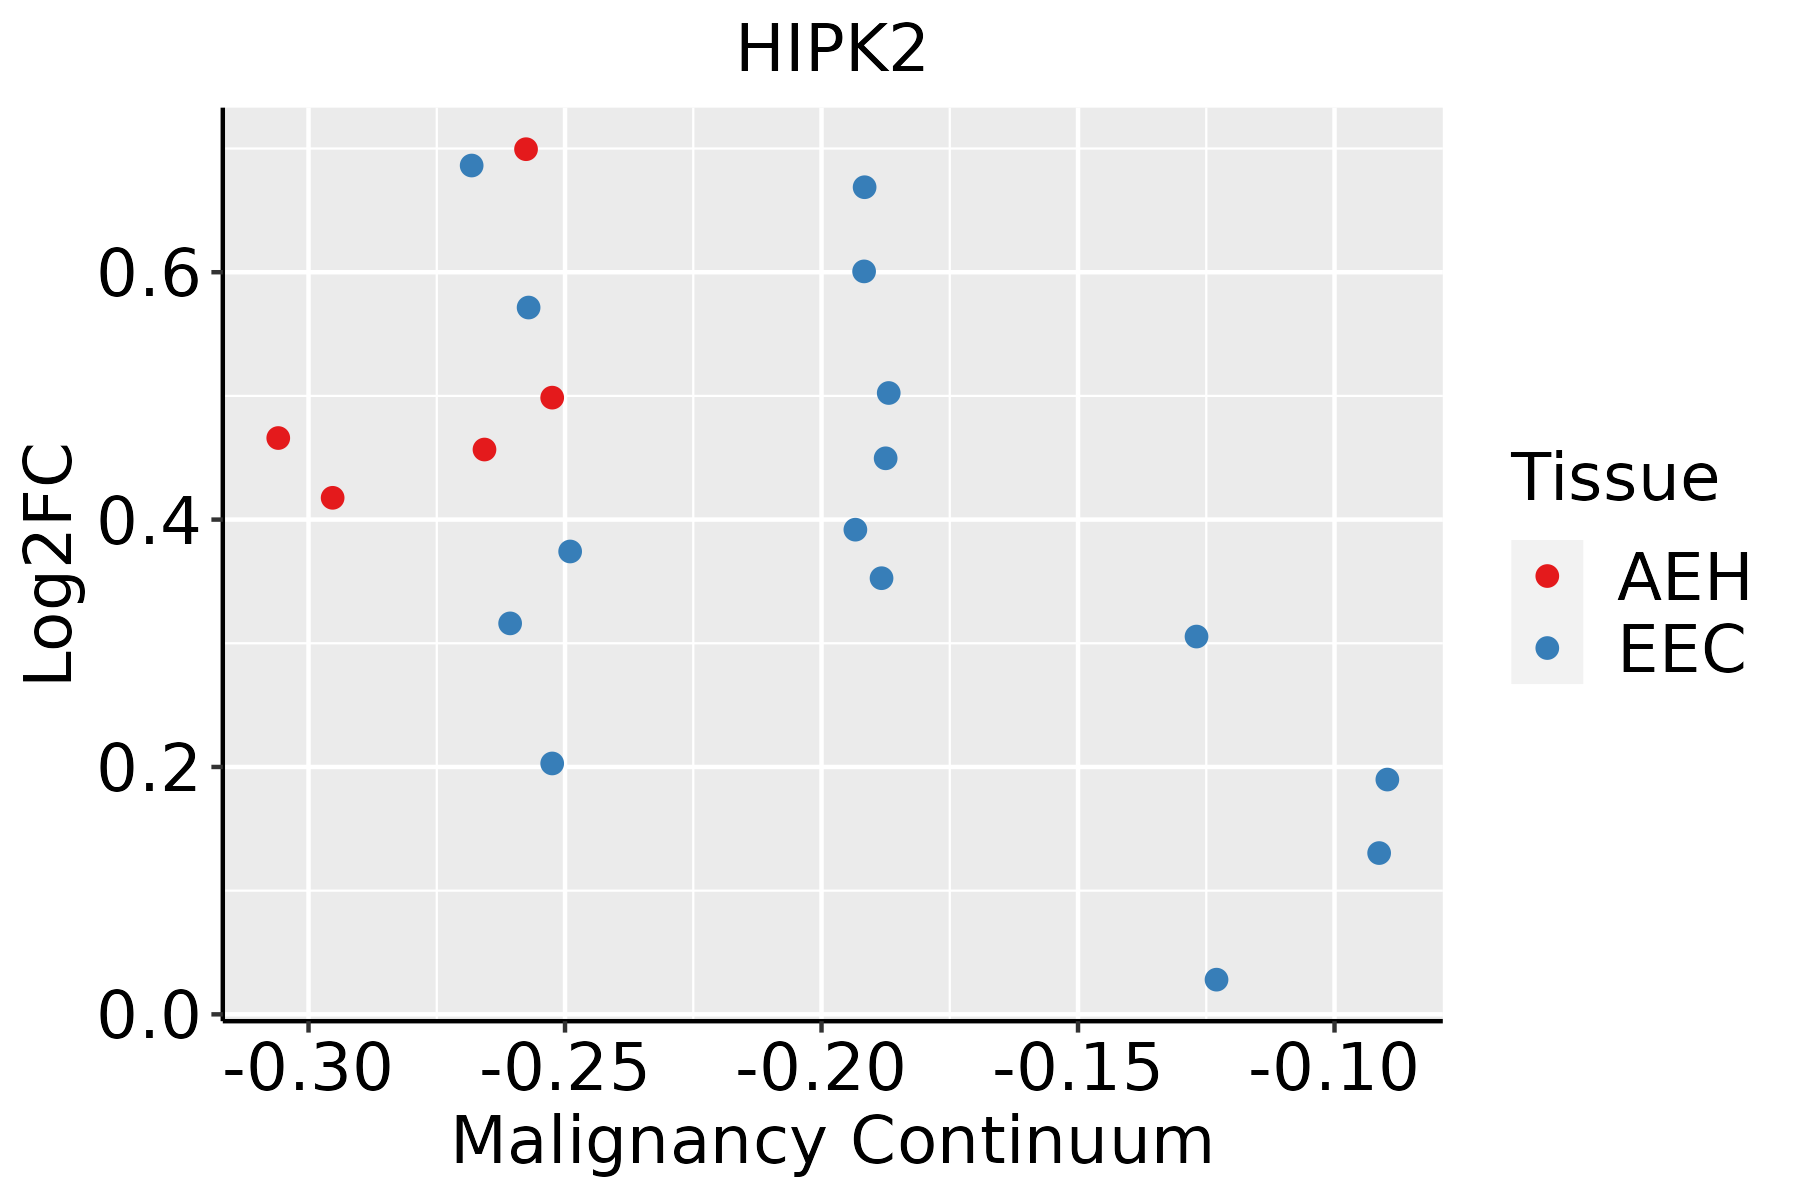
AEH: Atypical endometrial hyperplasia
EEC: Endometrioid Cancer
EsophagusThe image shows the transcriptomic changes along malignancy continuum.log2FC in expression of this searched gene in stem-like cells from each diseased tissue sample relative to stem-like cells in normal samples in each tissue plotted against the malignancy continuum. Samples are colored based on if they are from different disease stage.ESCC: Esophageal squamous cell carcinoma
HGIN: High-grade intraepithelial neoplasias
LGIN: Low-grade intraepithelial neoplasias
GCThe image shows the transcriptomic changes along malignancy continuum.log2FC in expression of this searched gene in stem-like cells from each diseased tissue sample relative to stem-like cells in normal samples in each tissue plotted against the malignancy continuum. Samples are colored based on if they are from different disease stage.CAG: Chronic atrophic gastritis
CAG with IM: Chronic atrophic gastritis with intestinal metaplasia
CSG: Chronic superficial gastritis
GC: Gastric cancer
SIM: Severe intestinal metaplasia
WIM: Wild intestinal metaplasia
LiverThe image shows the transcriptomic changes along malignancy continuum.log2FC in expression of this searched gene in stem-like cells from each diseased tissue sample relative to stem-like cells in normal samples in each tissue plotted against the malignancy continuum. Samples are colored based on if they are from different disease stage.
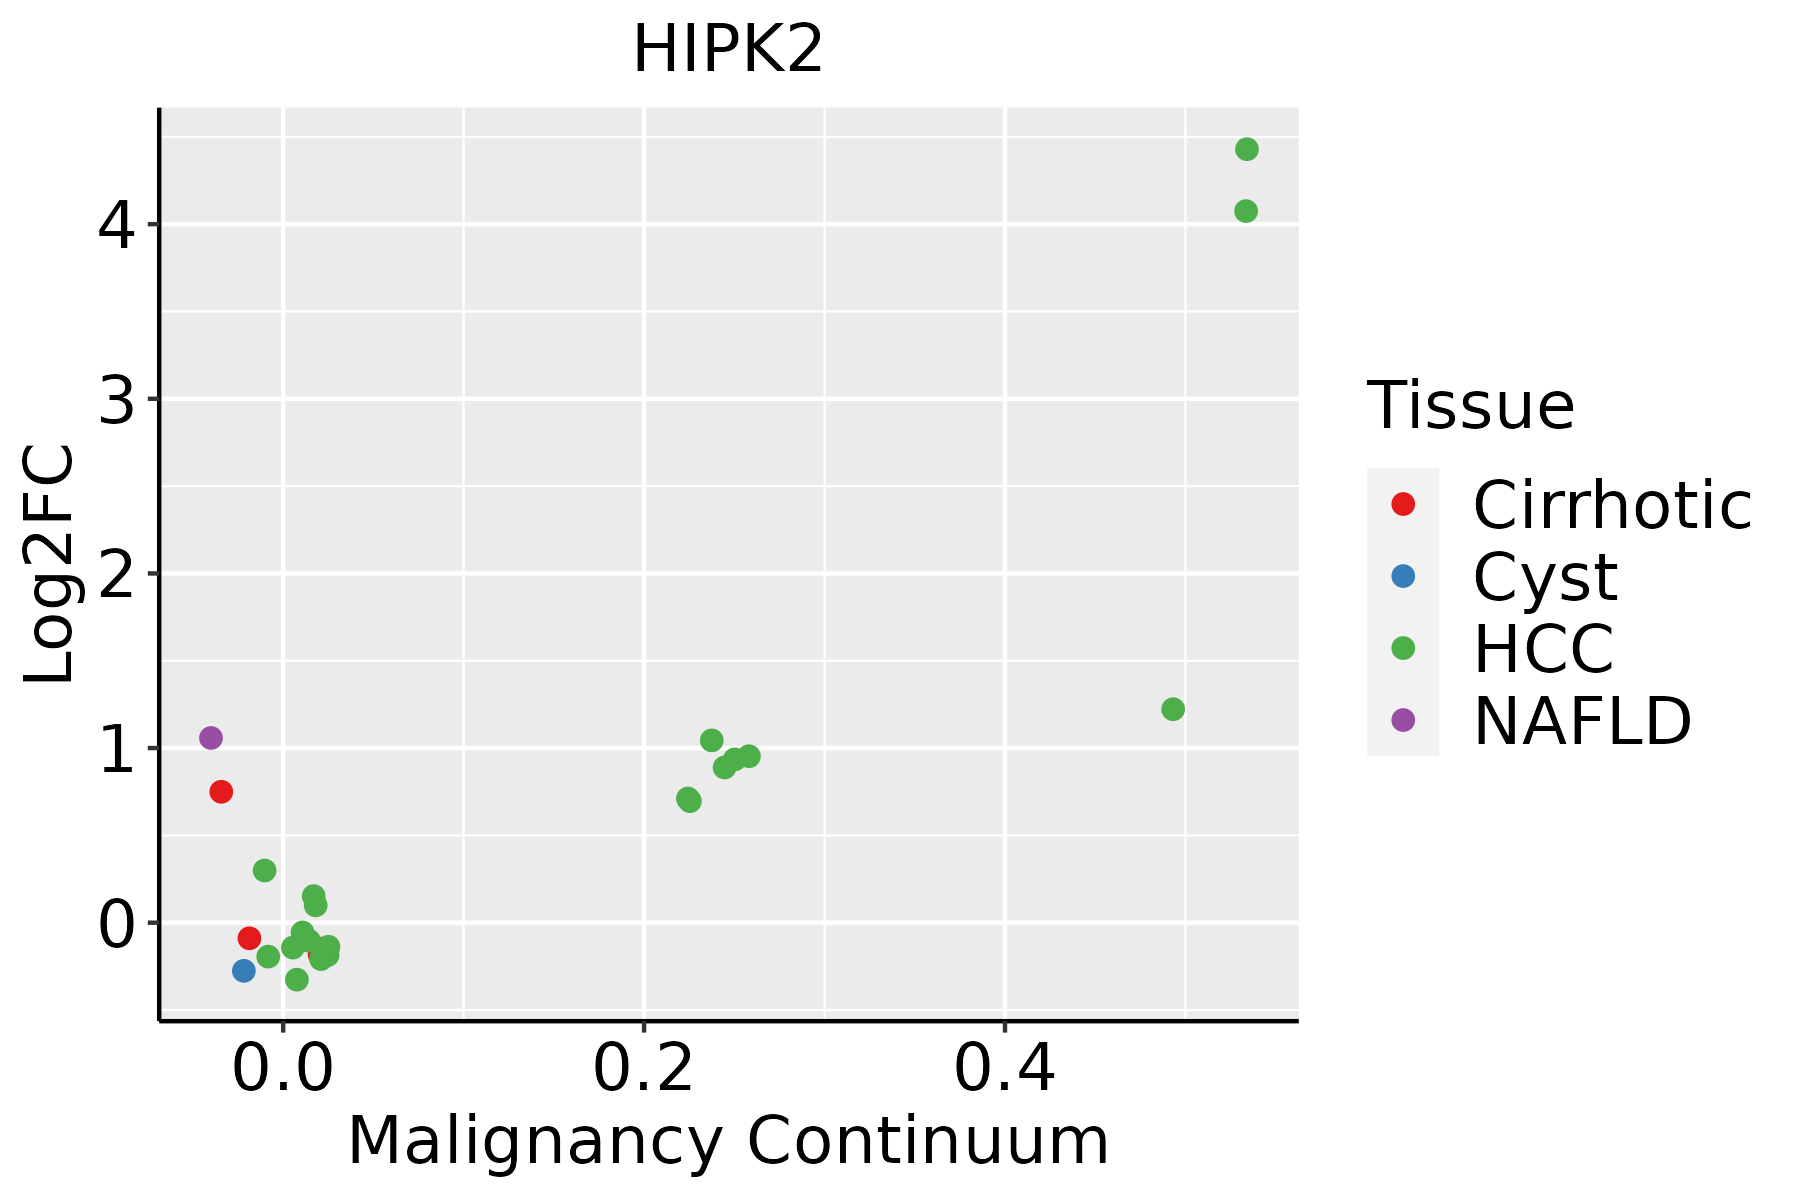
HCC: Hepatocellular carcinoma
NAFLD: Non-alcoholic fatty liver disease
LungThe image shows the transcriptomic changes along malignancy continuum.log2FC in expression of this searched gene in stem-like cells from each diseased tissue sample relative to stem-like cells in normal samples in each tissue plotted against the malignancy continuum. Samples are colored based on if they are from different disease stage.AAH: Atypical adenomatous hyperplasia
AIS: Adenocarcinoma in situ
IAC: Invasive lung adenocarcinoma
MIA: Minimally invasive adenocarcinoma
Oral CavityThe image shows the transcriptomic changes along malignancy continuum.log2FC in expression of this searched gene in stem-like cells from each diseased tissue sample relative to stem-like cells in normal samples in each tissue plotted against the malignancy continuum. Samples are colored based on if they are from different disease stage.EOLP: Erosive Oral lichen planus
LP: leukoplakia
NEOLP: Non-erosive oral lichen planus
OSCC: Oral squamous cell carcinoma
ProstateThe image shows the transcriptomic changes along malignancy continuum.log2FC in expression of this searched gene in stem-like cells from each diseased tissue sample relative to stem-like cells in normal samples in each tissue plotted against the malignancy continuum. Samples are colored based on if they are from different disease stage.BPH: Benign Prostatic Hyperplasia
ThyroidThe image shows the transcriptomic changes along malignancy continuum.log2FC in expression of this searched gene in stem-like cells from each diseased tissue sample relative to stem-like cells in normal samples in each tissue plotted against the malignancy continuum. Samples are colored based on if they are from different disease stage.
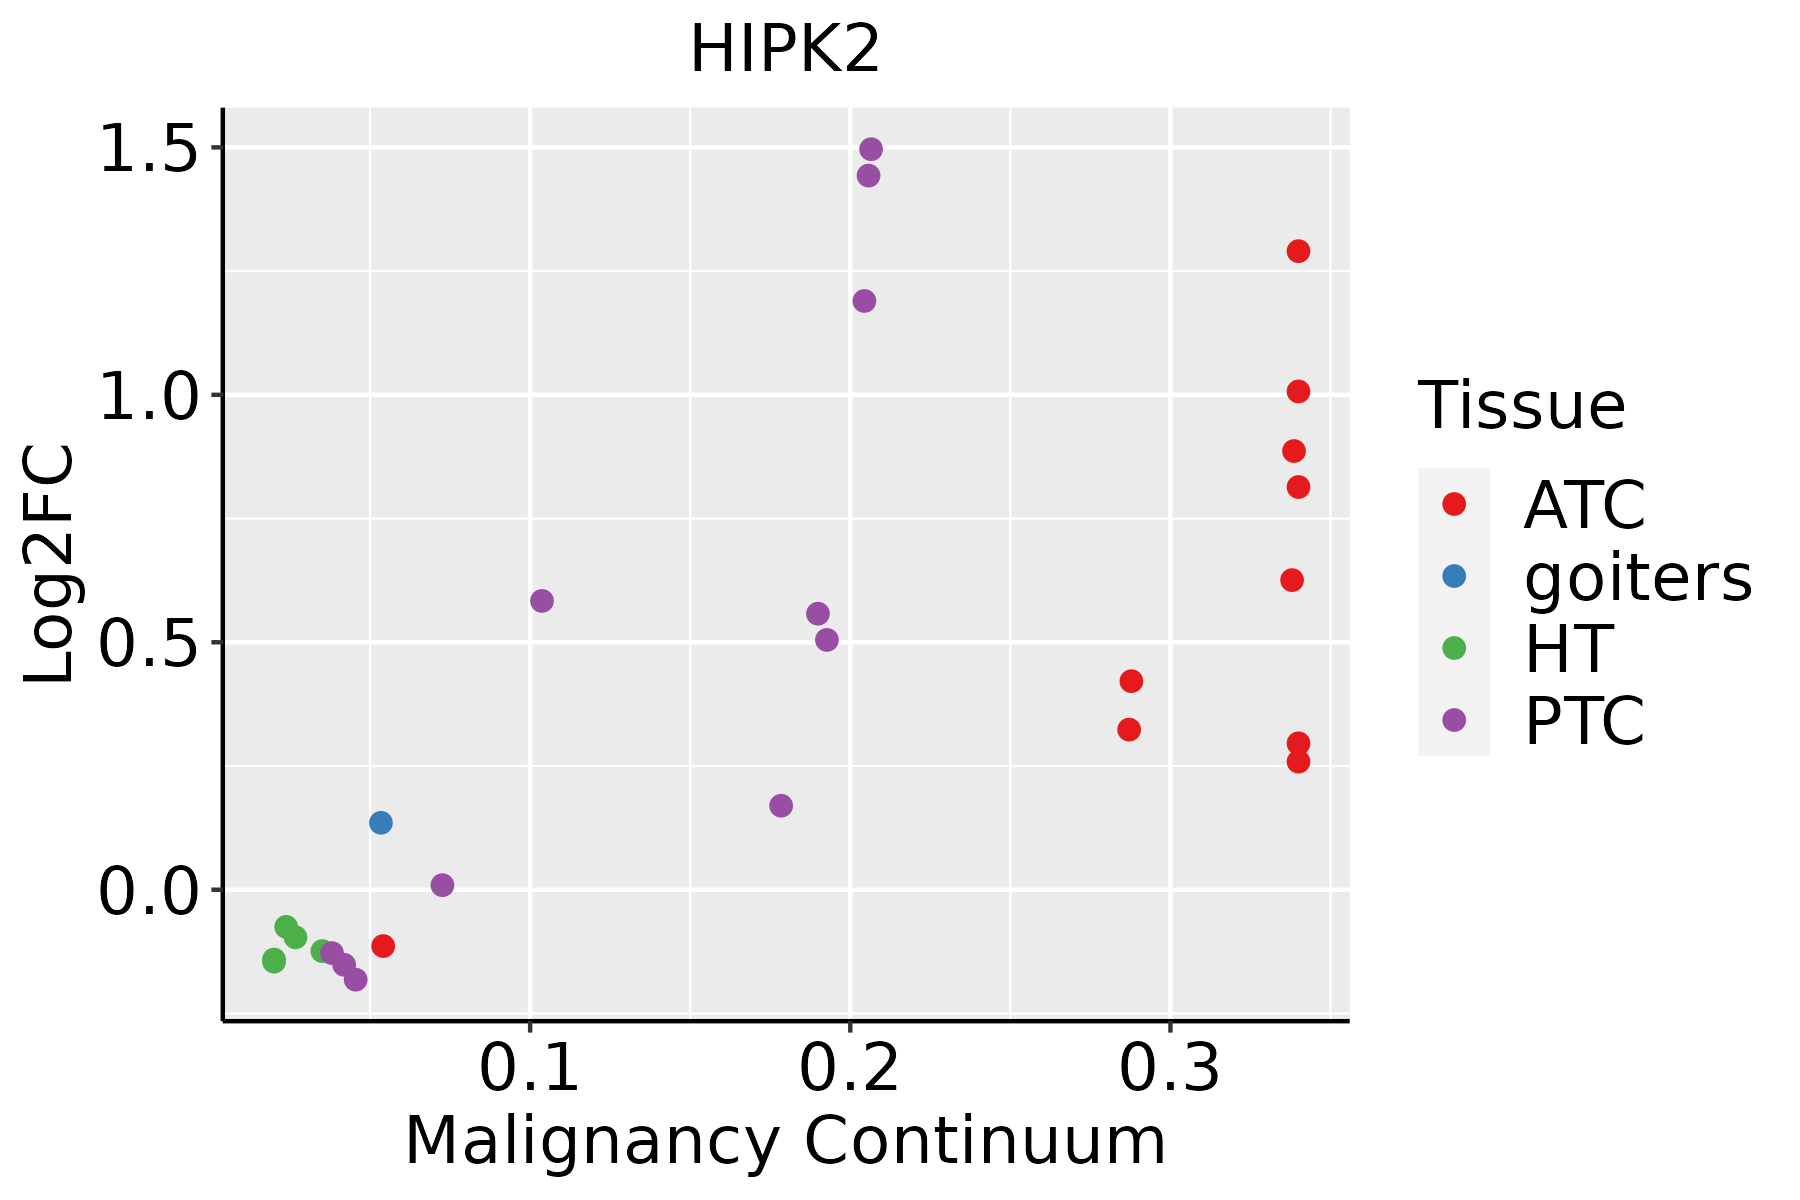
ATC: Anaplastic thyroid cancer
HT: Hashimoto's thyroiditis
PTC: Papillary thyroid cancer
∗log2FC in expression of this searched gene in stem-like cells from each diseased tissue sample relative to stem-like cells in normal samples in each tissue plotted against the malignancy continuum. Samples are colored based on if they are from different disease stage.

Top

Malignant transformation related pathway analysis

check buttonFind out the enriched GO biological processes and KEGG pathways involved in transition from healthy to precancer to cancer
check button Figure of enriched GO biological processes.
TissueDisease StageEnriched GO biological Processes
ColorectumADGO analysis - Figure of enriched GO biological processes: Top 15 enriched GO BP terms are showed in the bar plot of each disease state in each tissue. Each row represents a significant GO biological process which is colored according to the -log10(p.adjust).
ColorectumSERGO analysis - Figure of enriched GO biological processes: Top 15 enriched GO BP terms are showed in the bar plot of each disease state in each tissue. Each row represents a significant GO biological process which is colored according to the -log10(p.adjust).
ColorectumMSSGO analysis - Figure of enriched GO biological processes: Top 15 enriched GO BP terms are showed in the bar plot of each disease state in each tissue. Each row represents a significant GO biological process which is colored according to the -log10(p.adjust).
ColorectumMSI-HGO analysis - Figure of enriched GO biological processes: Top 15 enriched GO BP terms are showed in the bar plot of each disease state in each tissue. Each row represents a significant GO biological process which is colored according to the -log10(p.adjust).
ColorectumFAPGO analysis - Figure of enriched GO biological processes: Top 15 enriched GO BP terms are showed in the bar plot of each disease state in each tissue. Each row represents a significant GO biological process which is colored according to the -log10(p.adjust).
∗Top 15 enriched GO BP terms are showed in the bar plot of each disease state in each tissue. Each row represents a significant GO biological process which is colored according to the -log10(p.adjust).
Page: 1 2 3 4 5 6 7 8 9 

check button Enriched GO biological processes.
GO IDTissueDisease StageDescriptionGene RatioBg Ratiopvaluep.adjustCount
GO:005140316Oral cavityOSCCstress-activated MAPK cascade134/7305239/187236.02e-081.09e-06134
GO:00715598Oral cavityOSCCresponse to transforming growth factor beta140/7305256/187232.34e-073.70e-06140
GO:00715608Oral cavityOSCCcellular response to transforming growth factor beta stimulus137/7305250/187232.68e-074.15e-06137
GO:007030210Oral cavityOSCCregulation of stress-activated protein kinase signaling cascade111/7305195/187232.82e-074.34e-06111
GO:003021820Oral cavityOSCCerythrocyte differentiation74/7305120/187234.09e-076.06e-0674
GO:005140217Oral cavityOSCCneuron apoptotic process134/7305246/187235.65e-078.19e-06134
GO:003287210Oral cavityOSCCregulation of stress-activated MAPK cascade108/7305192/187238.97e-071.22e-05108
GO:00510907Oral cavityOSCCregulation of DNA-binding transcription factor activity221/7305440/187239.06e-071.23e-05221
GO:004586120Oral cavityOSCCnegative regulation of proteolysis181/7305351/187231.01e-061.37e-05181
GO:00182098Oral cavityOSCCpeptidyl-serine modification175/7305338/187231.09e-061.46e-05175
GO:001810510Oral cavityOSCCpeptidyl-serine phosphorylation164/7305315/187231.51e-061.99e-05164
GO:200005919Oral cavityOSCCnegative regulation of ubiquitin-dependent protein catabolic process35/730548/187231.93e-062.47e-0535
GO:00071798Oral cavityOSCCtransforming growth factor beta receptor signaling pathway109/7305198/187233.21e-063.86e-05109
GO:190336317Oral cavityOSCCnegative regulation of cellular protein catabolic process49/730575/187233.49e-064.15e-0549
GO:003209210Oral cavityOSCCpositive regulation of protein binding54/730585/187234.05e-064.71e-0554
GO:007145317Oral cavityOSCCcellular response to oxygen levels98/7305177/187237.10e-067.75e-0598
GO:003033018Oral cavityOSCCDNA damage response, signal transduction by p53 class mediator46/730572/187231.66e-051.64e-0446
GO:00714569Oral cavityOSCCcellular response to hypoxia84/7305151/187232.46e-052.30e-0484
GO:00510917Oral cavityOSCCpositive regulation of DNA-binding transcription factor activity134/7305260/187232.52e-052.35e-04134
GO:003629417Oral cavityOSCCcellular response to decreased oxygen levels88/7305161/187233.91e-053.43e-0488
Page: 1 2 3 4 5 6 7 8 9 10 11 12 13 14 15 16 17 18 19 20 21 22 23 24 25 26 27 28 29 30 31 32 33 34 35 36 37 38 39 40 41 42 43 44 45 46 47 48 49 50 51 52 53 54 55 56 57 58 59 60 61 62 63 64 65 

check button Enriched KEGG pathways.
Pathway IDTissueDisease StageDescriptionGene RatioBg Ratiopvaluep.adjustqvalueCount
hsa04218ColorectumADCellular senescence53/2092156/84655.55e-032.48e-021.58e-0253
hsa042181ColorectumADCellular senescence53/2092156/84655.55e-032.48e-021.58e-0253
hsa042184ColorectumFAPCellular senescence42/1404156/84656.79e-044.63e-032.82e-0342
hsa042185ColorectumFAPCellular senescence42/1404156/84656.79e-044.63e-032.82e-0342
hsa0421816EndometriumAEHCellular senescence37/1197156/84658.49e-045.52e-034.04e-0337
hsa0421817EndometriumAEHCellular senescence37/1197156/84658.49e-045.52e-034.04e-0337
hsa0421825EndometriumEECCellular senescence40/1237156/84651.89e-041.68e-031.25e-0340
hsa0421835EndometriumEECCellular senescence40/1237156/84651.89e-041.68e-031.25e-0340
hsa0421829EsophagusESCCCellular senescence119/4205156/84655.89e-129.40e-114.81e-11119
hsa0421838EsophagusESCCCellular senescence119/4205156/84655.89e-129.40e-114.81e-11119
hsa042187LiverCirrhoticCellular senescence66/2530156/84655.94e-043.60e-032.22e-0366
hsa0421812LiverCirrhoticCellular senescence66/2530156/84655.94e-043.60e-032.22e-0366
hsa0421822LiverHCCCellular senescence102/4020156/84654.18e-063.59e-052.00e-05102
hsa0421832LiverHCCCellular senescence102/4020156/84654.18e-063.59e-052.00e-05102
hsa042188LungIACCellular senescence40/1053156/84654.44e-061.44e-049.59e-0540
hsa0421813LungIACCellular senescence40/1053156/84654.44e-061.44e-049.59e-0540
hsa0421823LungAISCellular senescence35/961156/84655.09e-057.85e-045.03e-0435
hsa0421833LungAISCellular senescence35/961156/84655.09e-057.85e-045.03e-0435
hsa0421820Oral cavityOSCCCellular senescence112/3704156/84658.04e-131.42e-117.21e-12112
hsa04218110Oral cavityOSCCCellular senescence112/3704156/84658.04e-131.42e-117.21e-12112
Page: 1 2 

Top

Cell-cell communication analysis

check buttonIdentification of potential cell-cell interactions between two cell types and their ligand-receptor pairs for different disease states
LigandReceptorLRpairPathwayTissueDisease Stage
Page: 1 

Top

Single-cell gene regulatory network inference analysis

check buttonFind out the significant the regulons (TFs) and the target genes of each regulon across cell types for different disease states
TFCell TypeTissueDisease StageTarget GeneRSSRegulon Activity
∗The dot plots of a searched regulon are shown for all cell subpopulations in each disease state of each tissue based on the regulon specific score inferred using pySCENIC and by calculating the average expression.
Page: 1 

Top

Somatic mutation of malignant transformation related genes

check buttonAnnotation of somatic variants for genes involved in malignant transformation
Hugo SymbolVariant ClassVariant ClassificationdbSNP RSHGVScHGVSpHGVSp ShortSWISSPROTBIOTYPESIFTPolyPhenTumor Sample BarcodeTissueHistologySexAgeStageTherapy TypesDrugsOutcome
HIPK2SNVMissense_Mutationc.1945N>Cp.Asp649Hisp.D649HQ9H2X6protein_codingdeleterious(0)probably_damaging(0.996)TCGA-A7-A26H-01Breastbreast invasive carcinomaFemale>=65I/IIHormone TherapyanastrozolePD
HIPK2SNVMissense_Mutationrs764542823c.350G>Ap.Arg117Glnp.R117QQ9H2X6protein_codingtolerated(0.2)probably_damaging(0.978)TCGA-AN-A046-01Breastbreast invasive carcinomaFemale>=65I/IIUnknownUnknownSD
HIPK2SNVMissense_Mutationnovelc.2665N>Gp.Thr889Alap.T889AQ9H2X6protein_codingdeleterious(0)probably_damaging(0.952)TCGA-AO-A128-01Breastbreast invasive carcinomaFemale<65I/IIChemotherapydoxorubicinSD
HIPK2SNVMissense_Mutationc.1477N>Ap.Glu493Lysp.E493KQ9H2X6protein_codingdeleterious(0)probably_damaging(0.995)TCGA-AR-A0TZ-01Breastbreast invasive carcinomaFemale<65III/IVUnspecificDoxorubicinPD
HIPK2SNVMissense_Mutationc.2108C>Gp.Ala703Glyp.A703GQ9H2X6protein_codingdeleterious(0)benign(0.108)TCGA-AR-A0U2-01Breastbreast invasive carcinomaFemale<65III/IVHormone TherapytamoxiphenPD
HIPK2SNVMissense_Mutationrs747709692c.280N>Ap.Val94Metp.V94MQ9H2X6protein_codingdeleterious(0.01)probably_damaging(0.994)TCGA-AR-A2LN-01Breastbreast invasive carcinomaFemale>=65I/IIHormone TherapyletrozoleSD
HIPK2SNVMissense_Mutationc.47N>Gp.Ser16Cysp.S16CQ9H2X6protein_codingdeleterious(0.02)probably_damaging(0.993)TCGA-B6-A3ZX-01Breastbreast invasive carcinomaFemale<65III/IVChemotherapycyclophosphamidePD
HIPK2SNVMissense_Mutationc.2220N>Cp.Glu740Aspp.E740DQ9H2X6protein_codingtolerated(0.99)benign(0.001)TCGA-BH-A18P-01Breastbreast invasive carcinomaFemale<65I/IIUnknownUnknownPD
HIPK2SNVMissense_Mutationrs773782325c.140N>Cp.His47Prop.H47PQ9H2X6protein_codingtolerated(0.1)possibly_damaging(0.71)TCGA-C8-A1HO-01Breastbreast invasive carcinomaFemale<65III/IVChemotherapy5-fluorouracilCR
HIPK2SNVMissense_Mutationrs773782325c.140N>Cp.His47Prop.H47PQ9H2X6protein_codingtolerated(0.1)possibly_damaging(0.71)TCGA-D8-A1JI-01Breastbreast invasive carcinomaFemale<65I/IIChemotherapydoxorubicineSD
Page: 1 2 3 4 5 6 7 8 9 10 11 

Top

Related drugs of malignant transformation related genes

check buttonIdentification of chemicals and drugs interact with genes involved in malignant transfromation
(DGIdb 4.0)
Entrez IDSymbolCategoryInteraction TypesDrug Claim NameDrug NamePMIDs
28996HIPK2TYROSINE KINASE, SERINE THREONINE KINASE, TUMOR SUPPRESSOR, KINASE, TRANSCRIPTION FACTOR, DRUGGABLE GENOME, ENZYMEinhibitor249565808
28996HIPK2TYROSINE KINASE, SERINE THREONINE KINASE, TUMOR SUPPRESSOR, KINASE, TRANSCRIPTION FACTOR, DRUGGABLE GENOME, ENZYMETAMATINIBR-406
28996HIPK2TYROSINE KINASE, SERINE THREONINE KINASE, TUMOR SUPPRESSOR, KINASE, TRANSCRIPTION FACTOR, DRUGGABLE GENOME, ENZYMEPI-103PI-103
28996HIPK2TYROSINE KINASE, SERINE THREONINE KINASE, TUMOR SUPPRESSOR, KINASE, TRANSCRIPTION FACTOR, DRUGGABLE GENOME, ENZYMEGSK-269962AGSK-269962A
28996HIPK2TYROSINE KINASE, SERINE THREONINE KINASE, TUMOR SUPPRESSOR, KINASE, TRANSCRIPTION FACTOR, DRUGGABLE GENOME, ENZYMECENISERTIBCENISERTIB
28996HIPK2TYROSINE KINASE, SERINE THREONINE KINASE, TUMOR SUPPRESSOR, KINASE, TRANSCRIPTION FACTOR, DRUGGABLE GENOME, ENZYMEBAY-613606CHEMBL541400
28996HIPK2TYROSINE KINASE, SERINE THREONINE KINASE, TUMOR SUPPRESSOR, KINASE, TRANSCRIPTION FACTOR, DRUGGABLE GENOME, ENZYMEILORASERTIBILORASERTIB
28996HIPK2TYROSINE KINASE, SERINE THREONINE KINASE, TUMOR SUPPRESSOR, KINASE, TRANSCRIPTION FACTOR, DRUGGABLE GENOME, ENZYMEPF-562271PF-00562271
28996HIPK2TYROSINE KINASE, SERINE THREONINE KINASE, TUMOR SUPPRESSOR, KINASE, TRANSCRIPTION FACTOR, DRUGGABLE GENOME, ENZYMEPHA-767491CHEMBL225519
28996HIPK2TYROSINE KINASE, SERINE THREONINE KINASE, TUMOR SUPPRESSOR, KINASE, TRANSCRIPTION FACTOR, DRUGGABLE GENOME, ENZYMESP-600125SP-600125
Page: 1 2