| Tissue | Expression Dynamics | Abbreviation |
| Breast | 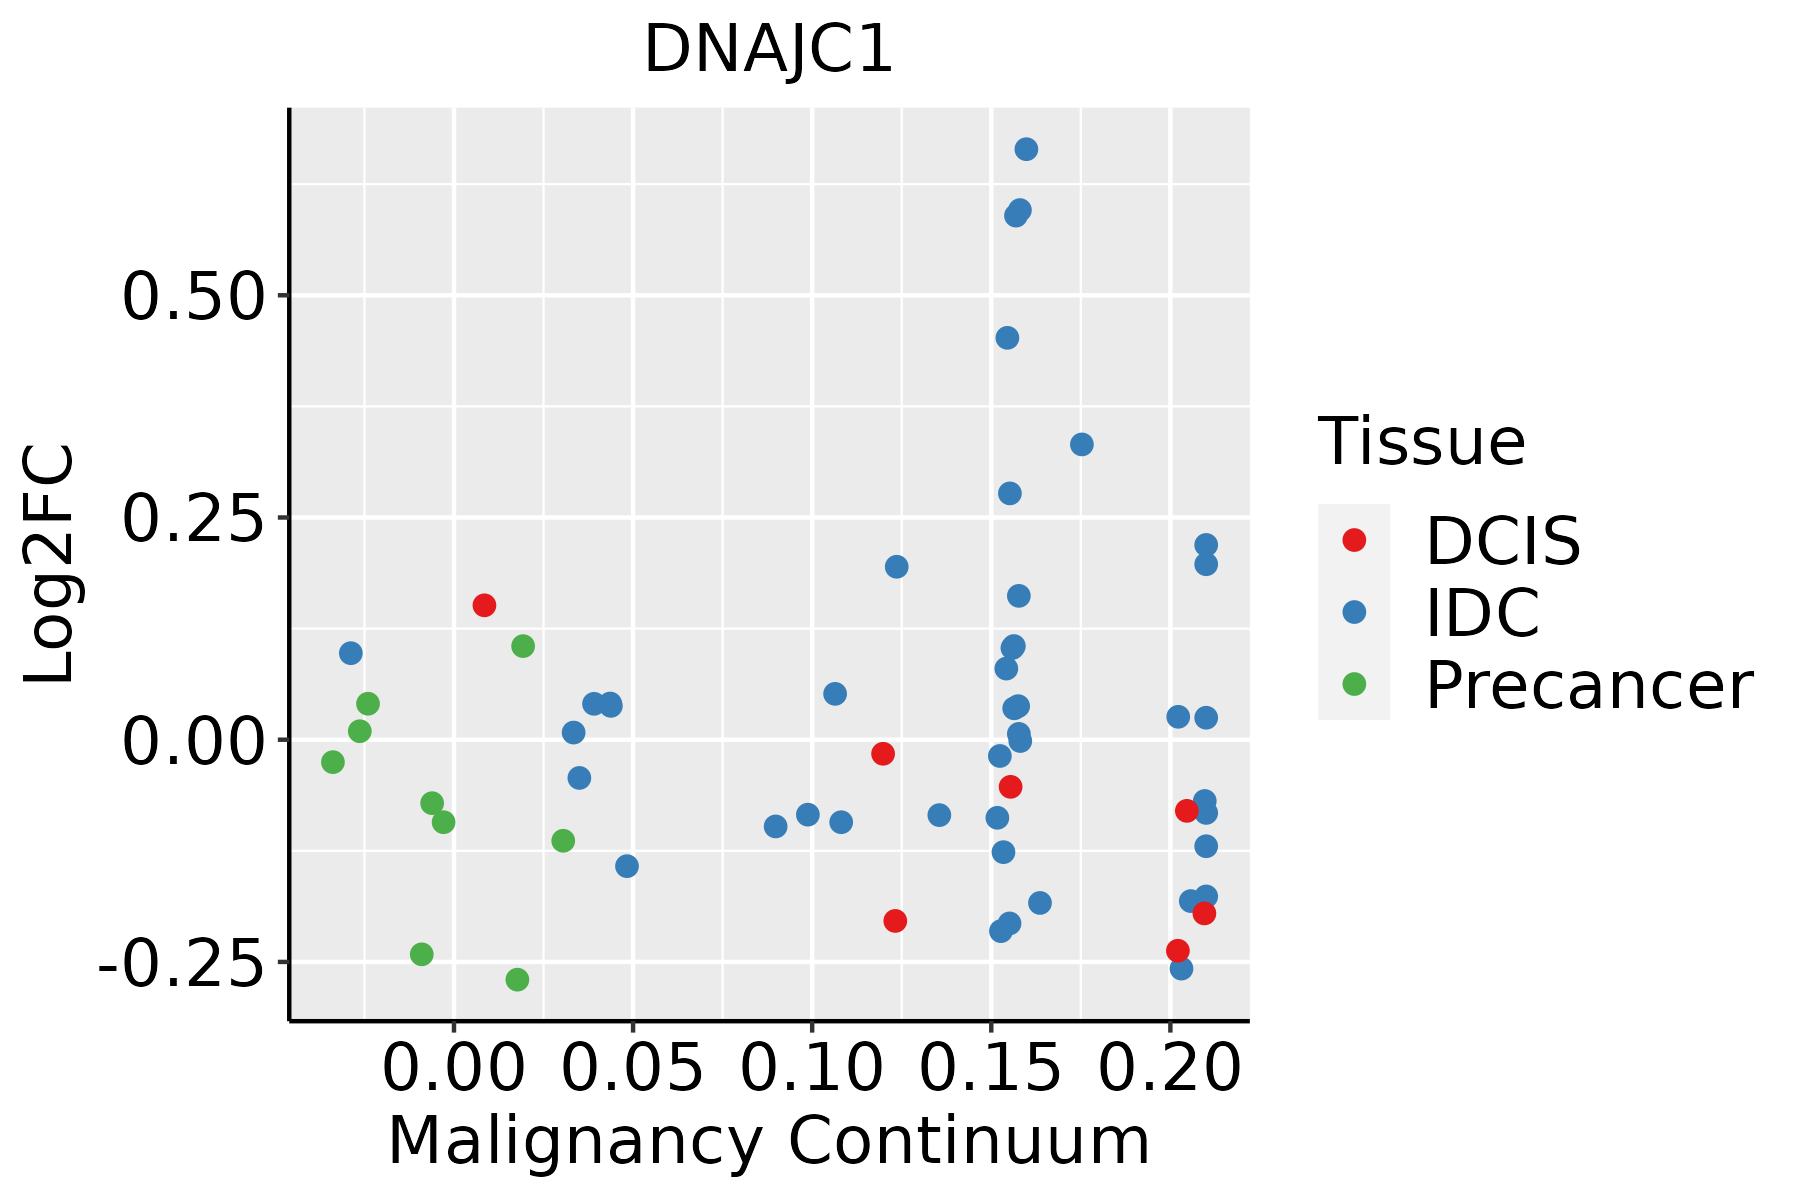 | IDC: Invasive ductal carcinoma |
| DCIS: Ductal carcinoma in situ |
| Precancer(BRCA1-mut): Precancerous lesion from BRCA1 mutation carriers |
| Colorectum (GSE201348) |  | FAP: Familial adenomatous polyposis |
| CRC: Colorectal cancer |
| Colorectum (HTA11) |  | AD: Adenomas |
| SER: Sessile serrated lesions |
| MSI-H: Microsatellite-high colorectal cancer |
| MSS: Microsatellite stable colorectal cancer |
| Esophagus | 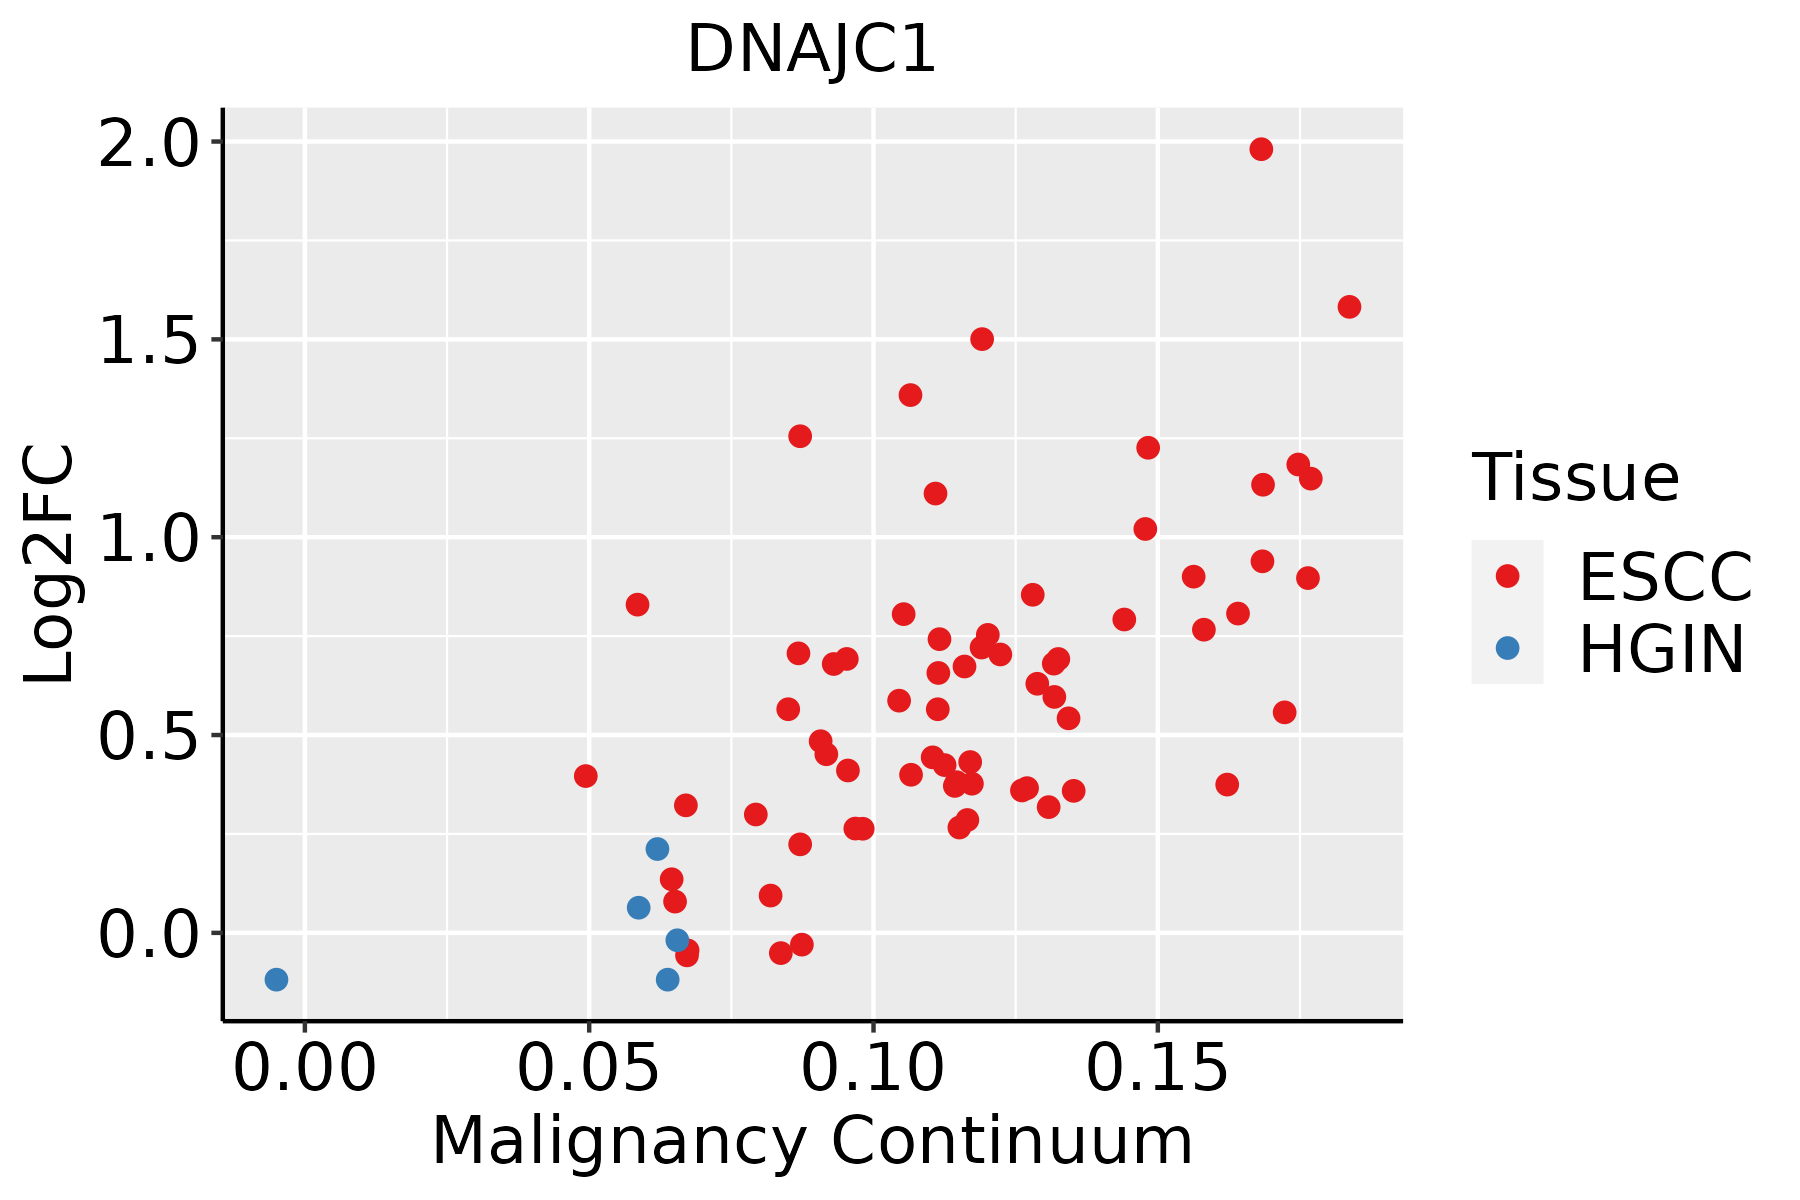 | ESCC: Esophageal squamous cell carcinoma |
| HGIN: High-grade intraepithelial neoplasias |
| LGIN: Low-grade intraepithelial neoplasias |
| GC | 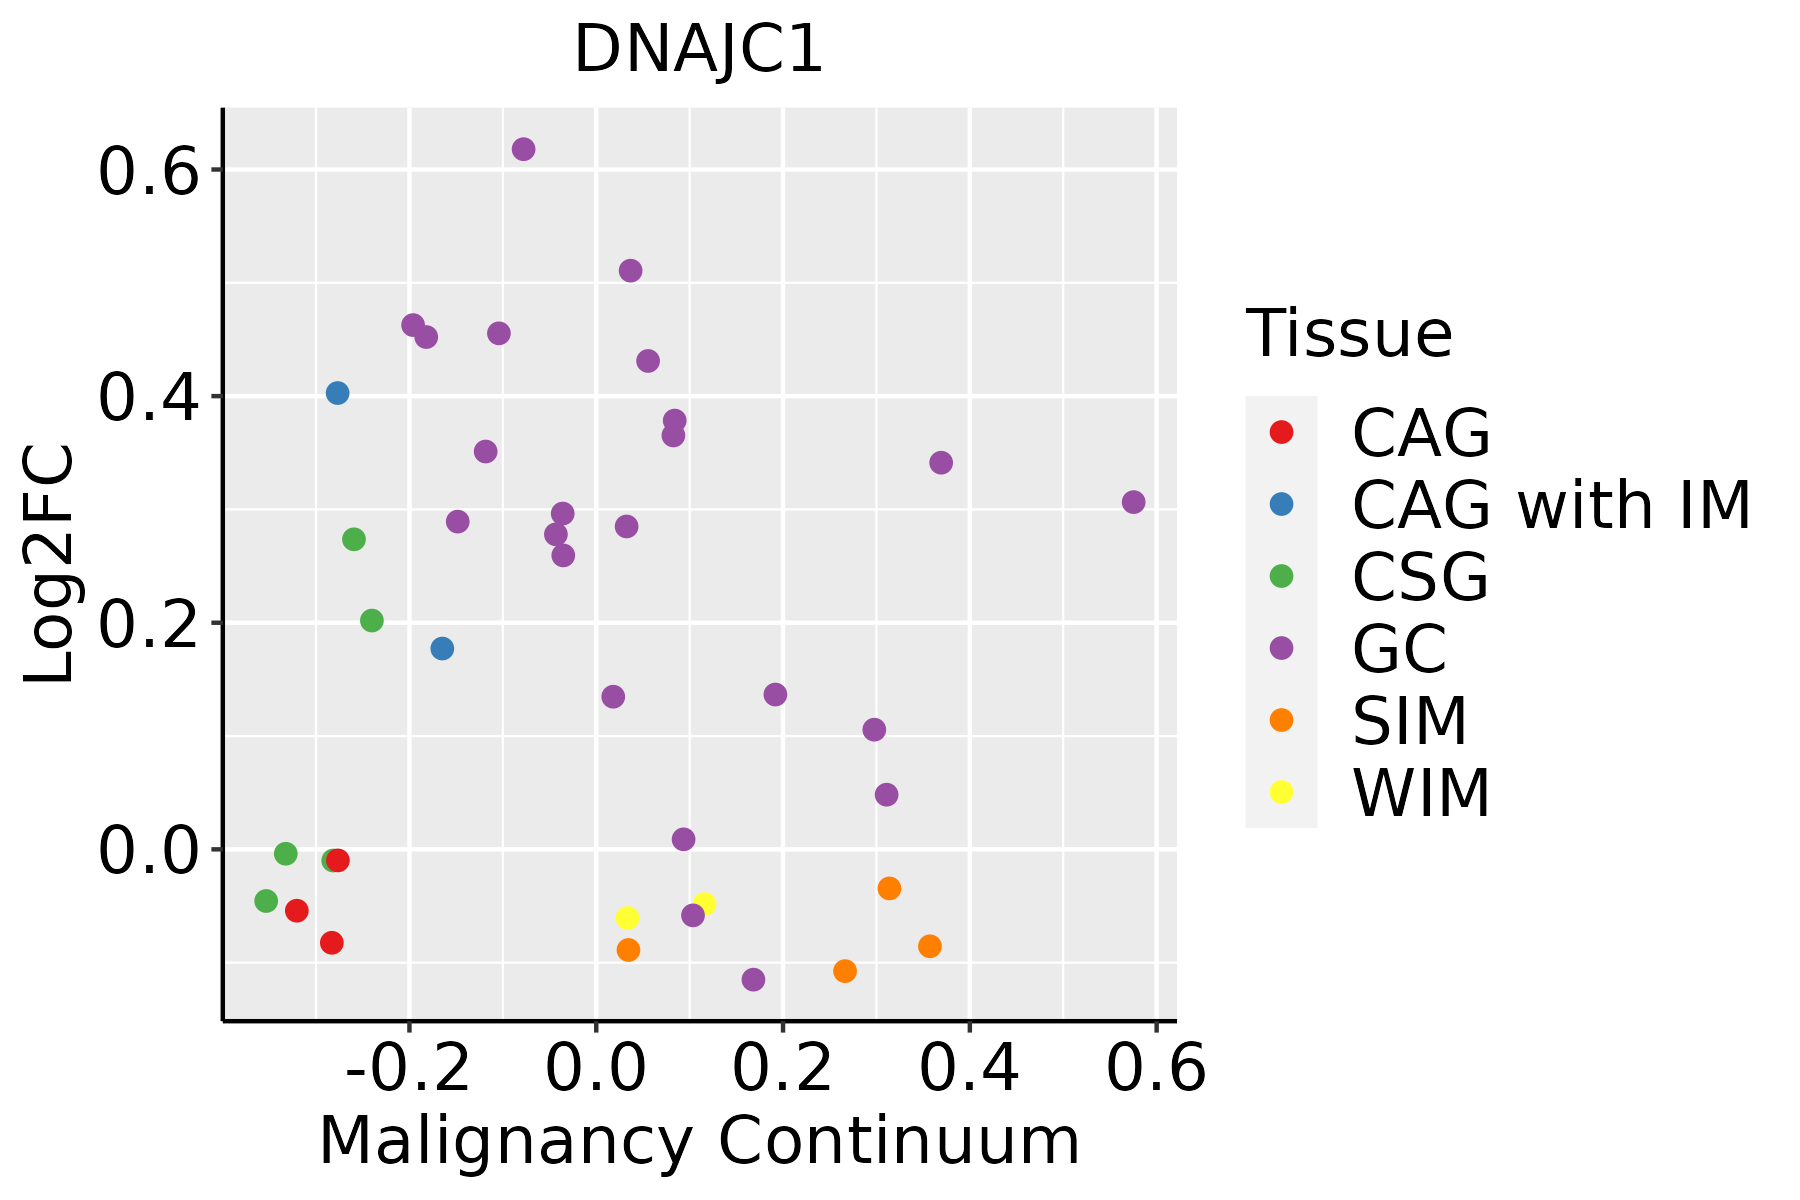 | CAG: Chronic atrophic gastritis |
| CAG with IM: Chronic atrophic gastritis with intestinal metaplasia |
| CSG: Chronic superficial gastritis |
| GC: Gastric cancer |
| SIM: Severe intestinal metaplasia |
| WIM: Wild intestinal metaplasia |
| Liver | 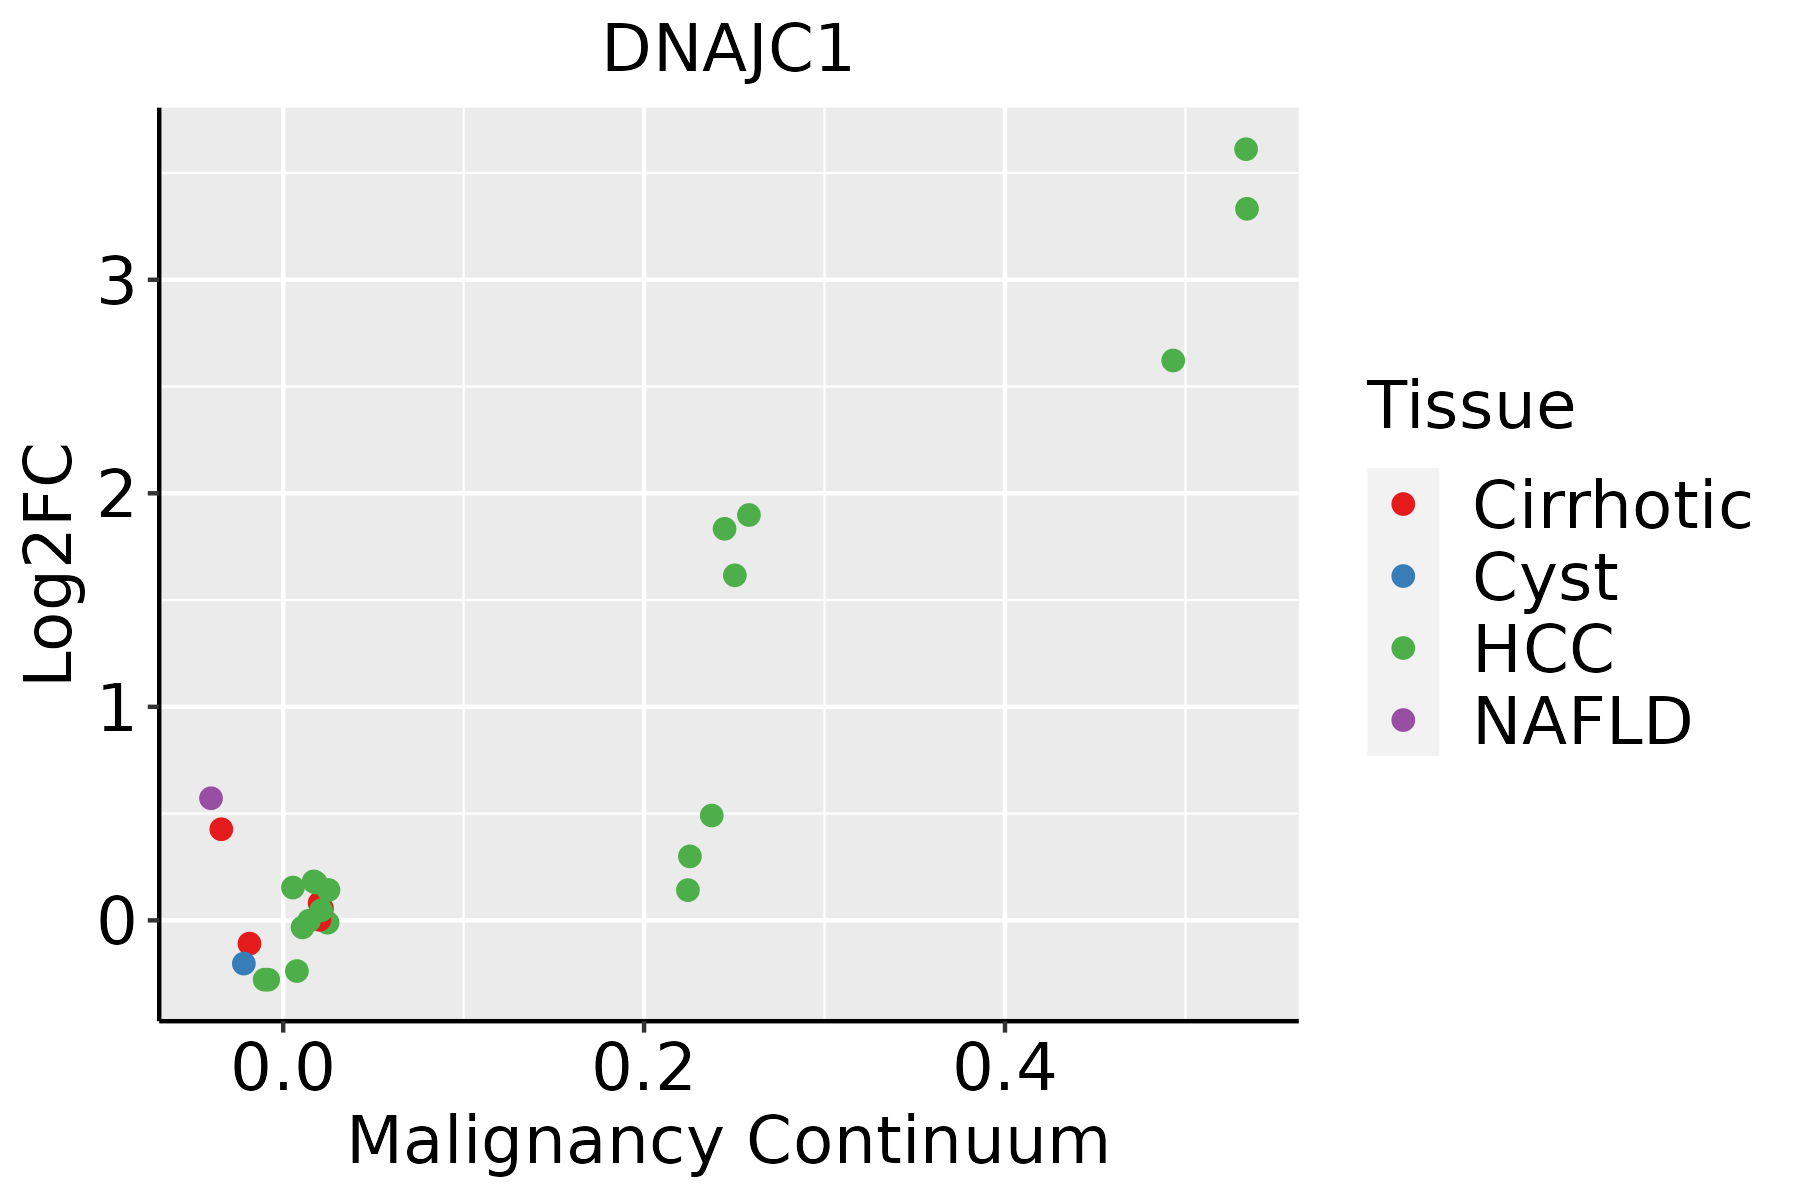 | HCC: Hepatocellular carcinoma |
| NAFLD: Non-alcoholic fatty liver disease |
| Lung | 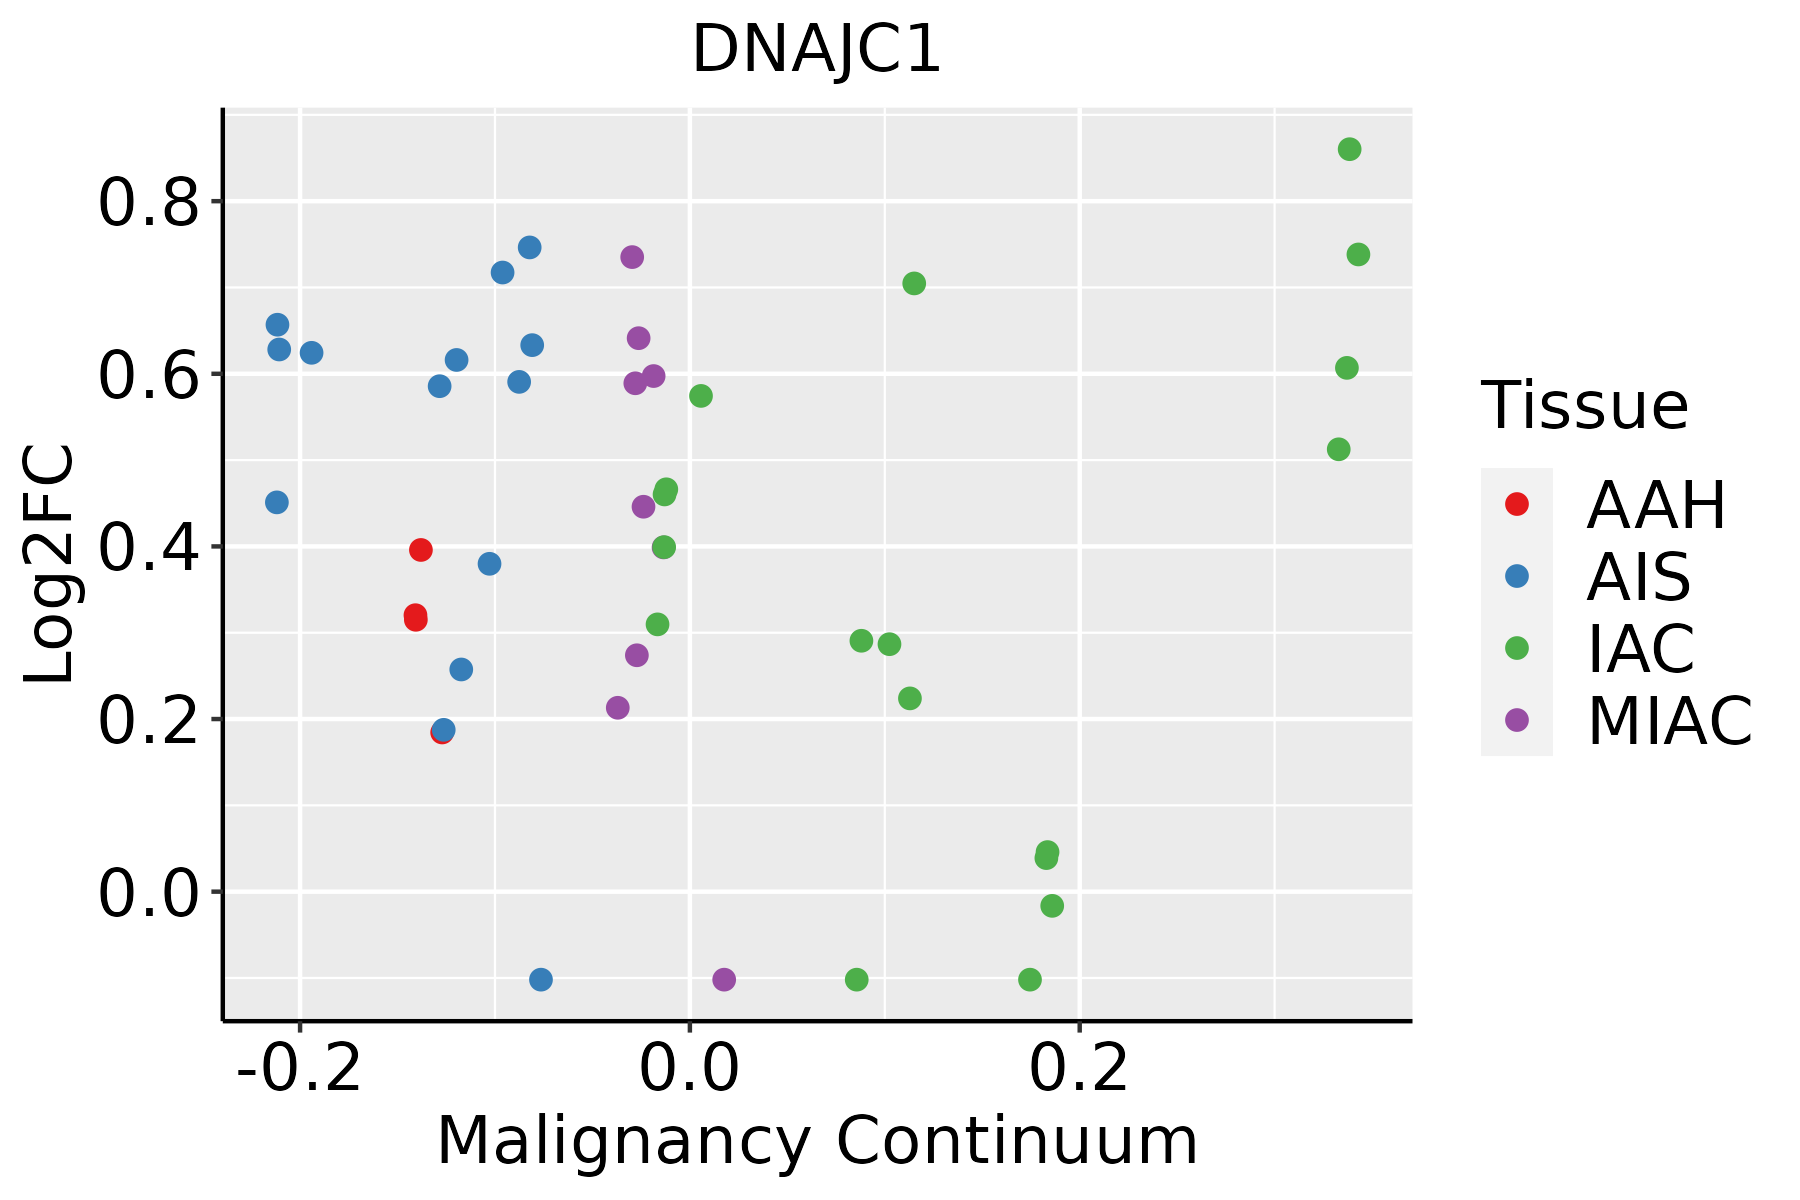 | AAH: Atypical adenomatous hyperplasia |
| AIS: Adenocarcinoma in situ |
| IAC: Invasive lung adenocarcinoma |
| MIA: Minimally invasive adenocarcinoma |
| Oral Cavity | 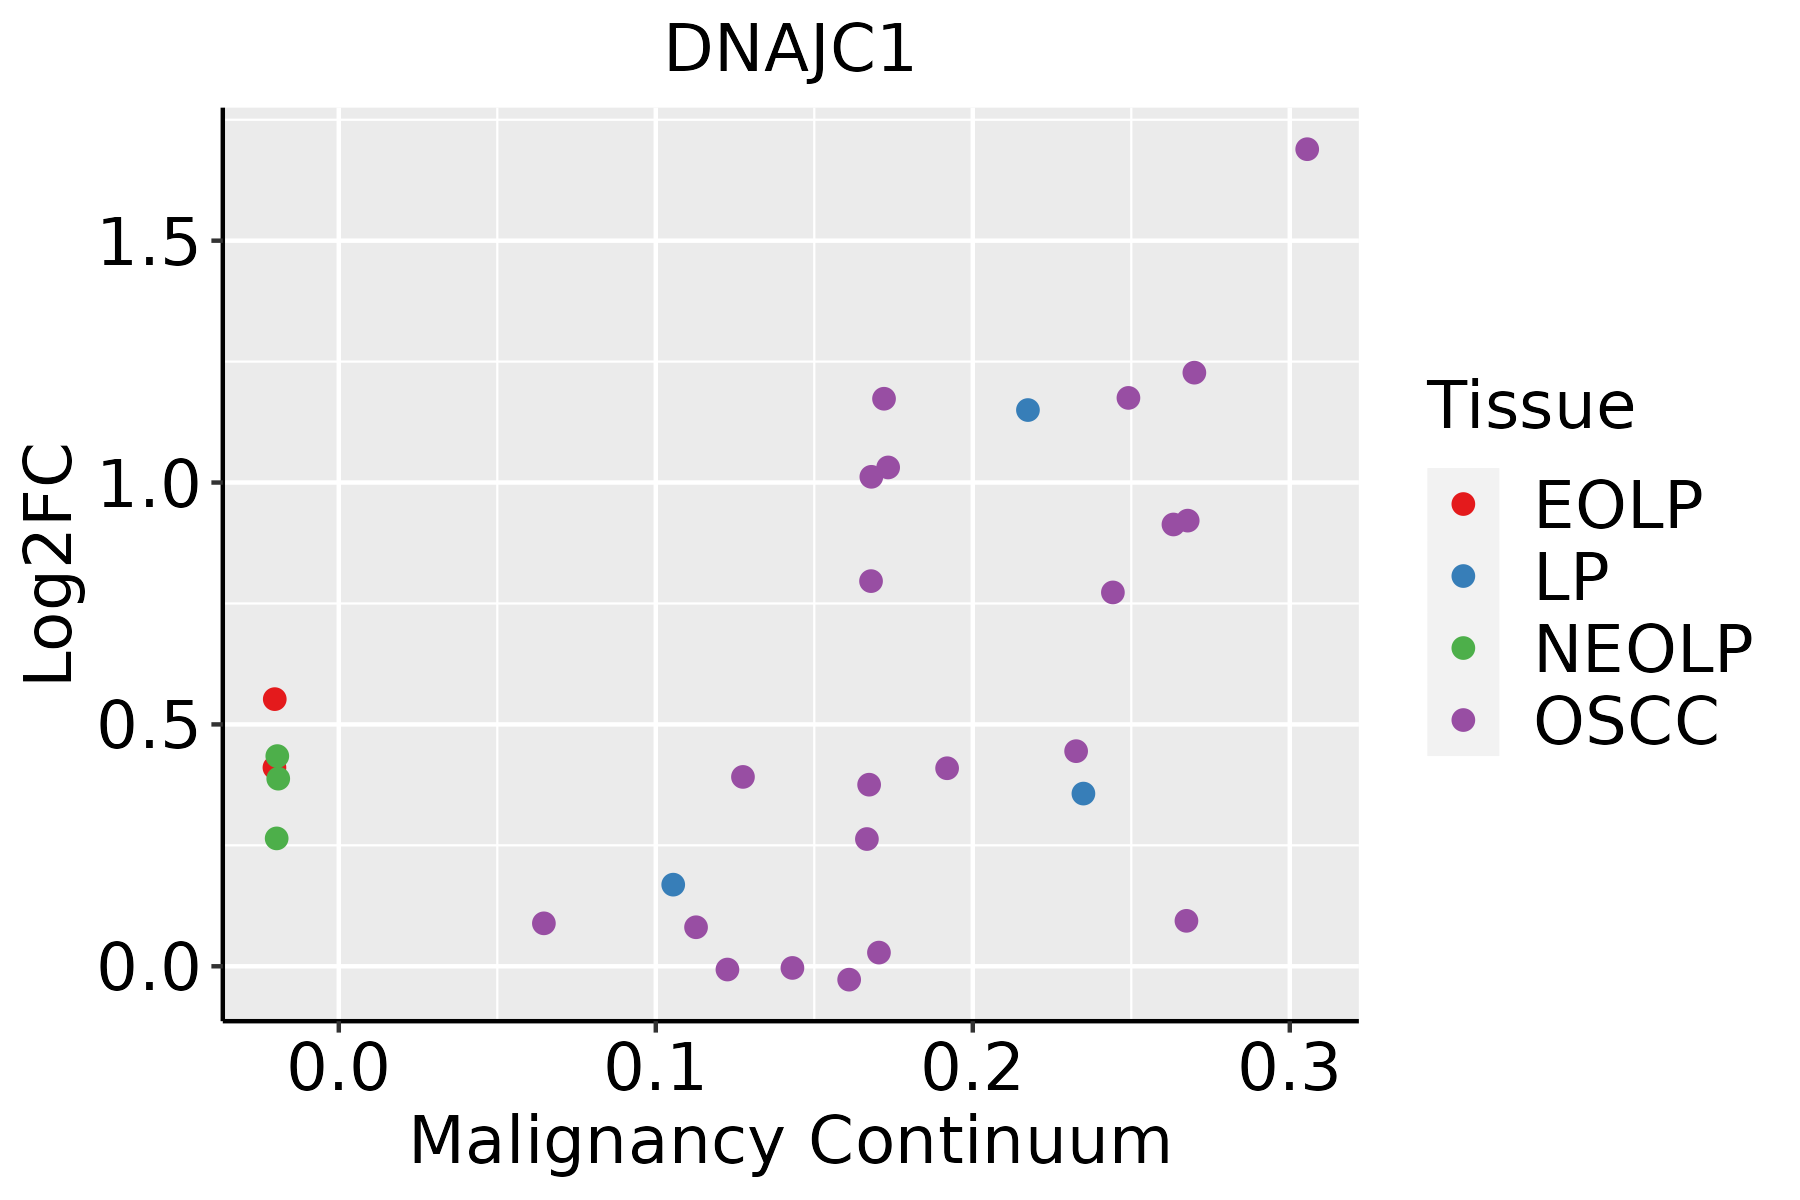 | EOLP: Erosive Oral lichen planus |
| LP: leukoplakia |
| NEOLP: Non-erosive oral lichen planus |
| OSCC: Oral squamous cell carcinoma |
| Prostate | 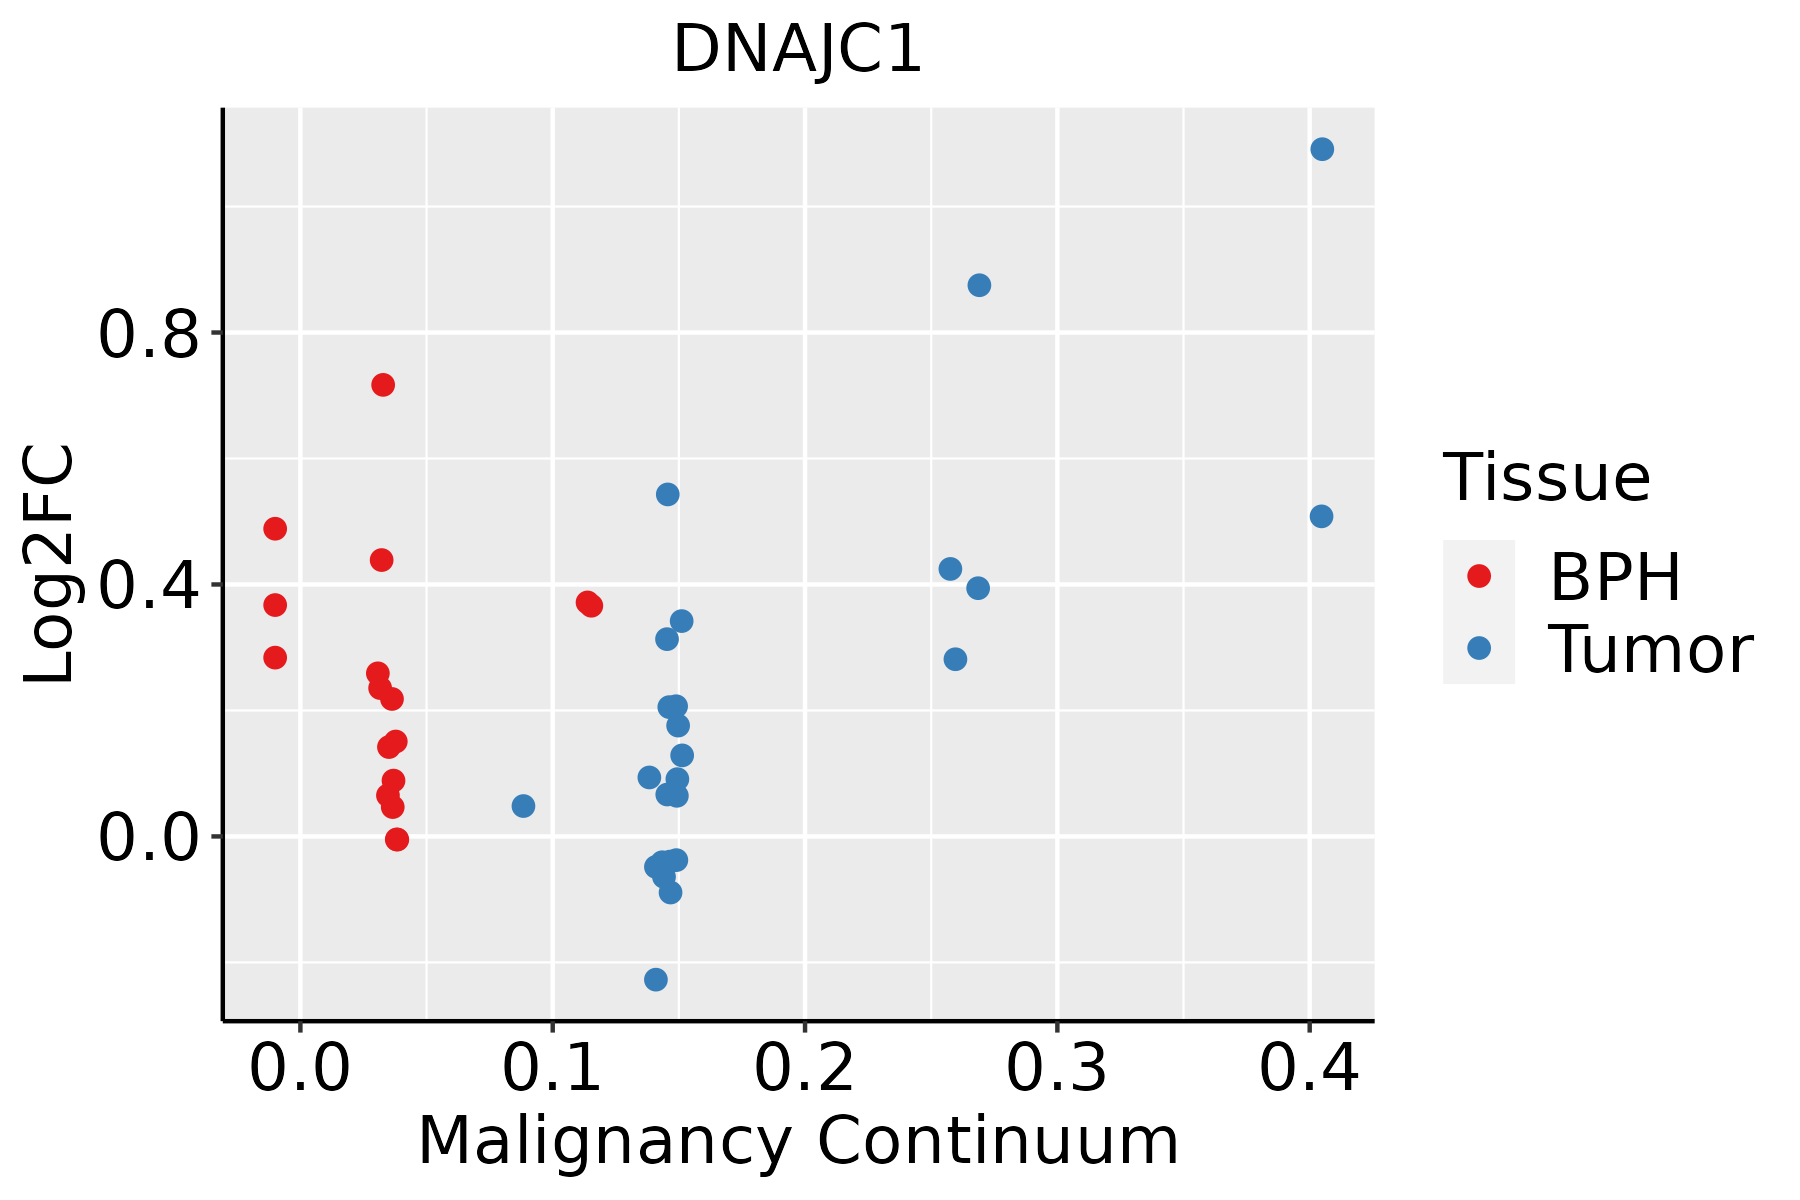 | BPH: Benign Prostatic Hyperplasia |
| Skin | 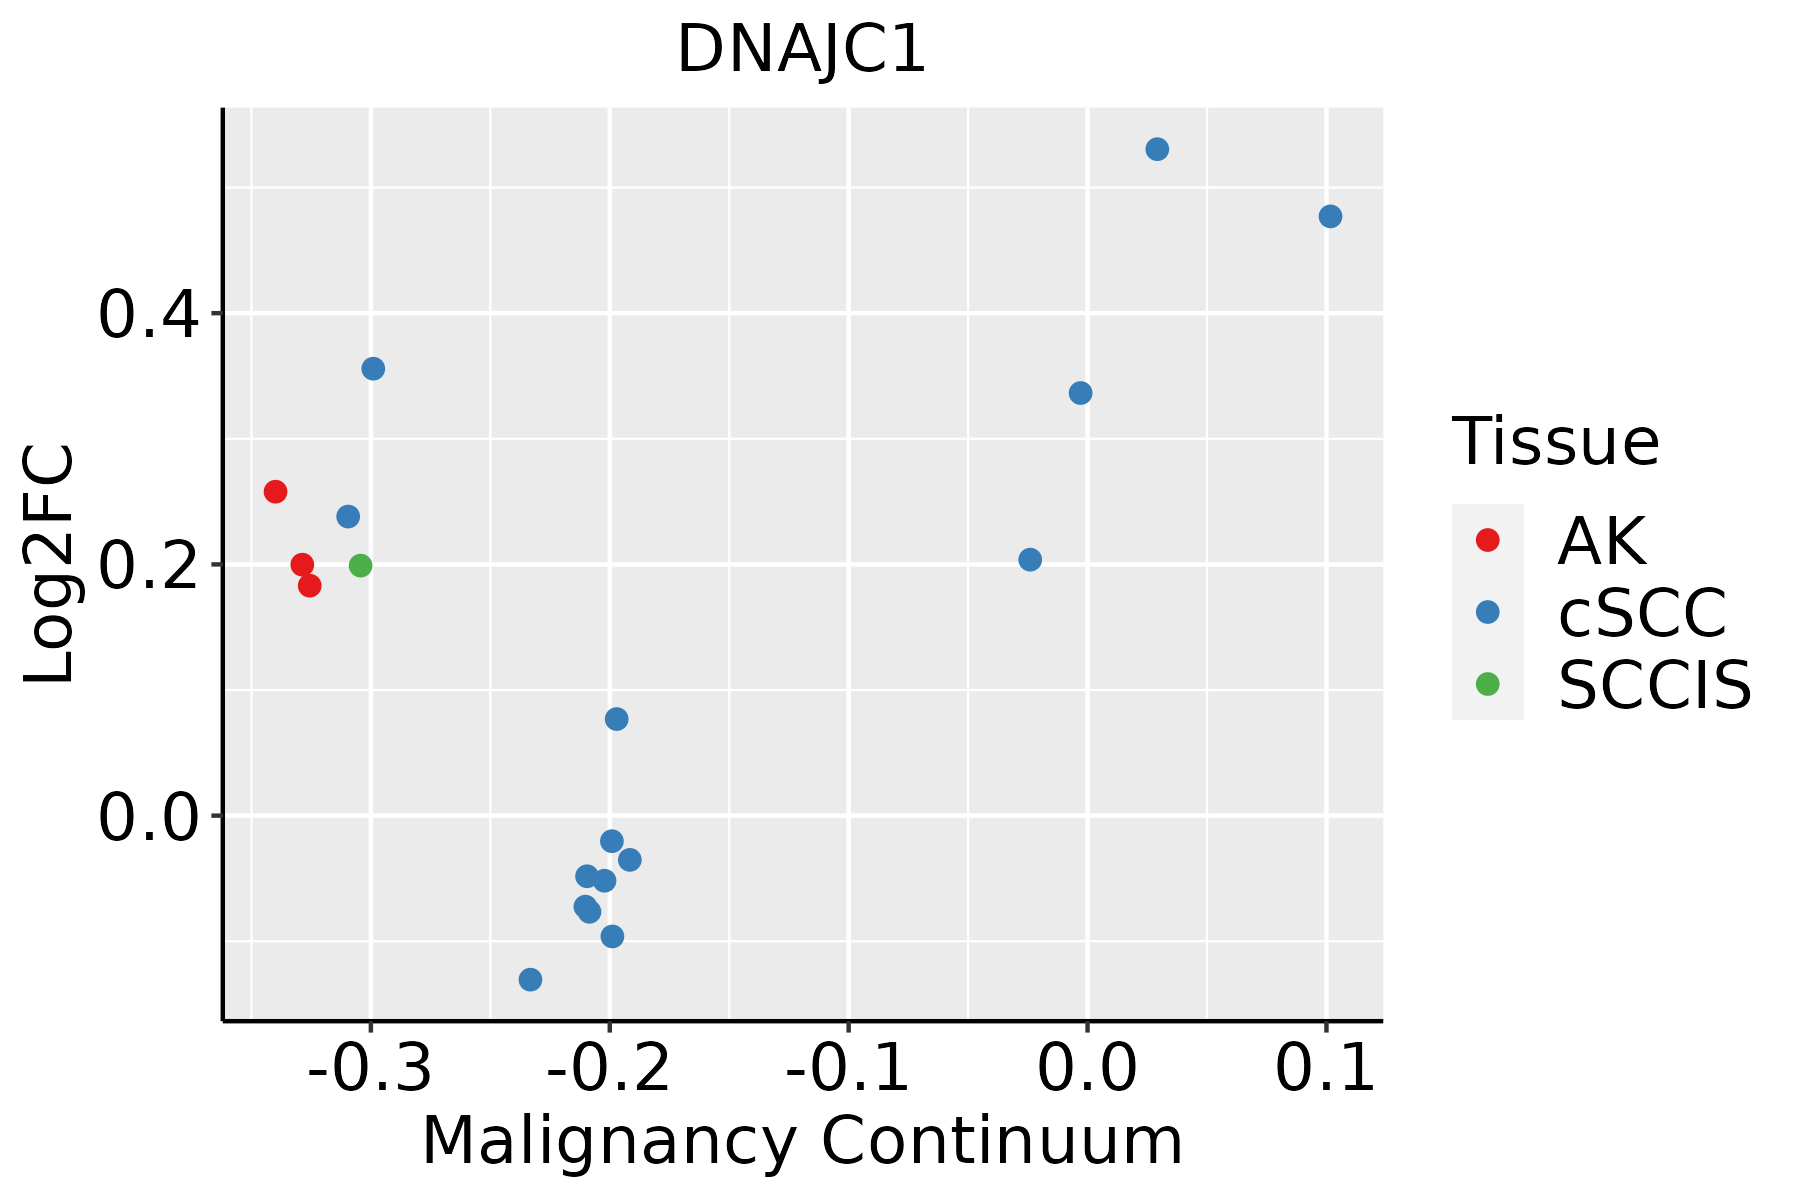 | AK: Actinic keratosis |
| cSCC: Cutaneous squamous cell carcinoma |
| SCCIS:squamous cell carcinoma in situ |
| Thyroid | 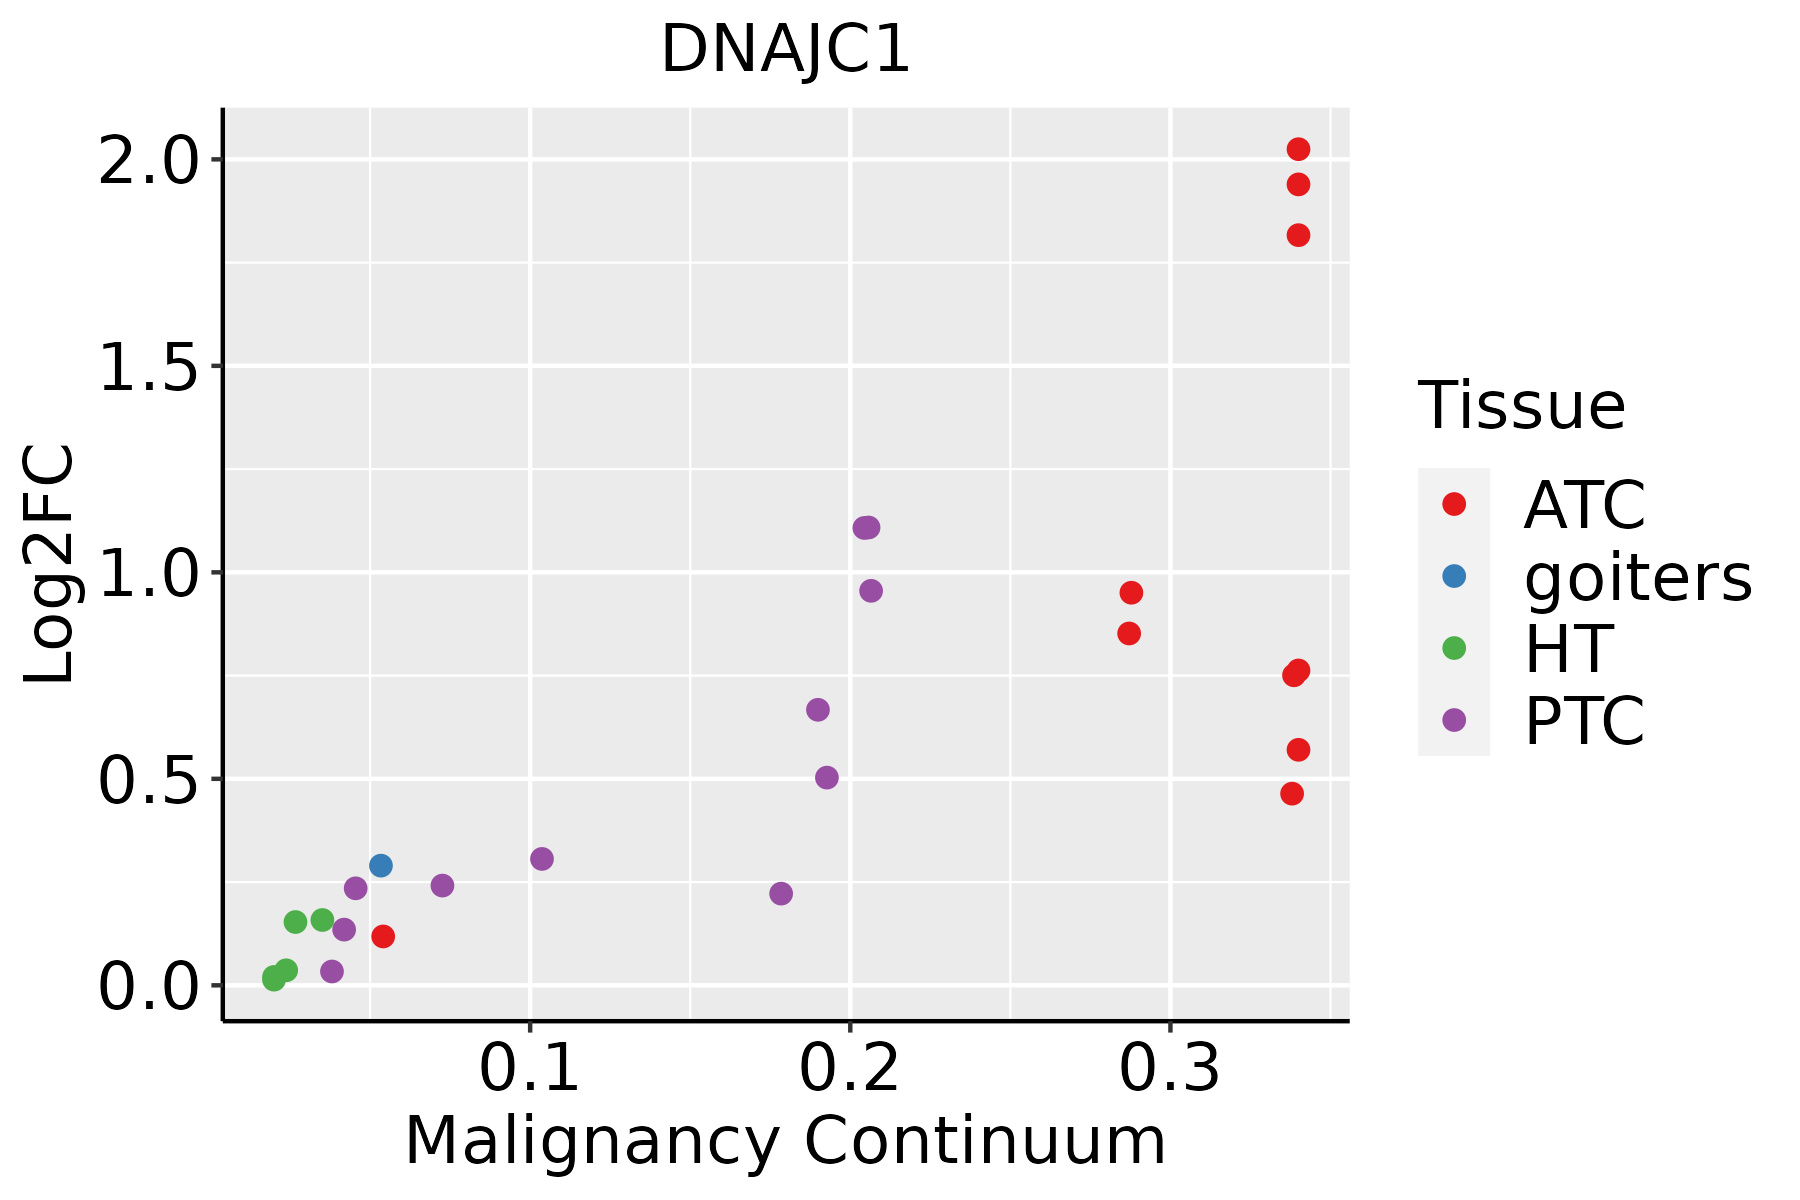 | ATC: Anaplastic thyroid cancer |
| HT: Hashimoto's thyroiditis |
| PTC: Papillary thyroid cancer |
| GO ID | Tissue | Disease Stage | Description | Gene Ratio | Bg Ratio | pvalue | p.adjust | Count |
| GO:004586118 | Prostate | BPH | negative regulation of proteolysis | 98/3107 | 351/18723 | 5.43e-08 | 1.49e-06 | 98 |
| GO:00015039 | Prostate | BPH | ossification | 107/3107 | 408/18723 | 4.31e-07 | 8.83e-06 | 107 |
| GO:007265516 | Prostate | BPH | establishment of protein localization to mitochondrion | 42/3107 | 120/18723 | 7.32e-07 | 1.39e-05 | 42 |
| GO:007058516 | Prostate | BPH | protein localization to mitochondrion | 43/3107 | 125/18723 | 9.29e-07 | 1.70e-05 | 43 |
| GO:001703810 | Prostate | BPH | protein import | 62/3107 | 206/18723 | 9.72e-07 | 1.77e-05 | 62 |
| GO:00160507 | Prostate | BPH | vesicle organization | 82/3107 | 300/18723 | 1.64e-06 | 2.78e-05 | 82 |
| GO:003497516 | Prostate | BPH | protein folding in endoplasmic reticulum | 9/3107 | 11/18723 | 3.77e-06 | 5.81e-05 | 9 |
| GO:00164828 | Prostate | BPH | cytosolic transport | 51/3107 | 168/18723 | 6.56e-06 | 9.53e-05 | 51 |
| GO:000662616 | Prostate | BPH | protein targeting to mitochondrion | 34/3107 | 100/18723 | 1.64e-05 | 2.05e-04 | 34 |
| GO:00068989 | Prostate | BPH | receptor-mediated endocytosis | 66/3107 | 244/18723 | 2.34e-05 | 2.80e-04 | 66 |
| GO:199054210 | Prostate | BPH | mitochondrial transmembrane transport | 34/3107 | 102/18723 | 2.63e-05 | 3.10e-04 | 34 |
| GO:00365034 | Prostate | BPH | ERAD pathway | 35/3107 | 107/18723 | 3.17e-05 | 3.60e-04 | 35 |
| GO:007005917 | Prostate | BPH | intrinsic apoptotic signaling pathway in response to endoplasmic reticulum stress | 24/3107 | 63/18723 | 3.48e-05 | 3.87e-04 | 24 |
| GO:00304333 | Prostate | BPH | ubiquitin-dependent ERAD pathway | 29/3107 | 85/18723 | 6.22e-05 | 6.23e-04 | 29 |
| GO:00327814 | Prostate | BPH | positive regulation of ATPase activity | 13/3107 | 27/18723 | 1.40e-04 | 1.25e-03 | 13 |
| GO:00989276 | Prostate | BPH | vesicle-mediated transport between endosomal compartments | 17/3107 | 43/18723 | 2.81e-04 | 2.19e-03 | 17 |
| GO:00075483 | Prostate | BPH | sex differentiation | 68/3107 | 276/18723 | 3.75e-04 | 2.76e-03 | 68 |
| GO:00070326 | Prostate | BPH | endosome organization | 26/3107 | 82/18723 | 5.42e-04 | 3.81e-03 | 26 |
| GO:00450224 | Prostate | BPH | early endosome to late endosome transport | 15/3107 | 40/18723 | 1.21e-03 | 7.41e-03 | 15 |
| GO:00434625 | Prostate | BPH | regulation of ATPase activity | 16/3107 | 46/18723 | 2.11e-03 | 1.18e-02 | 16 |
| Pathway ID | Tissue | Disease Stage | Description | Gene Ratio | Bg Ratio | pvalue | p.adjust | qvalue | Count |
| hsa0414124 | Breast | IDC | Protein processing in endoplasmic reticulum | 36/867 | 174/8465 | 2.73e-05 | 2.86e-04 | 2.14e-04 | 36 |
| hsa0414134 | Breast | IDC | Protein processing in endoplasmic reticulum | 36/867 | 174/8465 | 2.73e-05 | 2.86e-04 | 2.14e-04 | 36 |
| hsa0414143 | Breast | DCIS | Protein processing in endoplasmic reticulum | 36/846 | 174/8465 | 1.60e-05 | 1.91e-04 | 1.41e-04 | 36 |
| hsa0414153 | Breast | DCIS | Protein processing in endoplasmic reticulum | 36/846 | 174/8465 | 1.60e-05 | 1.91e-04 | 1.41e-04 | 36 |
| hsa04141 | Colorectum | AD | Protein processing in endoplasmic reticulum | 80/2092 | 174/8465 | 5.96e-10 | 1.25e-08 | 7.96e-09 | 80 |
| hsa041411 | Colorectum | AD | Protein processing in endoplasmic reticulum | 80/2092 | 174/8465 | 5.96e-10 | 1.25e-08 | 7.96e-09 | 80 |
| hsa041414 | Colorectum | MSS | Protein processing in endoplasmic reticulum | 75/1875 | 174/8465 | 3.78e-10 | 8.44e-09 | 5.17e-09 | 75 |
| hsa041415 | Colorectum | MSS | Protein processing in endoplasmic reticulum | 75/1875 | 174/8465 | 3.78e-10 | 8.44e-09 | 5.17e-09 | 75 |
| hsa041418 | Colorectum | FAP | Protein processing in endoplasmic reticulum | 50/1404 | 174/8465 | 3.64e-05 | 3.68e-04 | 2.24e-04 | 50 |
| hsa041419 | Colorectum | FAP | Protein processing in endoplasmic reticulum | 50/1404 | 174/8465 | 3.64e-05 | 3.68e-04 | 2.24e-04 | 50 |
| hsa0414139 | Esophagus | HGIN | Protein processing in endoplasmic reticulum | 67/1383 | 174/8465 | 1.06e-12 | 2.16e-11 | 1.72e-11 | 67 |
| hsa04141114 | Esophagus | HGIN | Protein processing in endoplasmic reticulum | 67/1383 | 174/8465 | 1.06e-12 | 2.16e-11 | 1.72e-11 | 67 |
| hsa04141211 | Esophagus | ESCC | Protein processing in endoplasmic reticulum | 147/4205 | 174/8465 | 3.29e-22 | 1.10e-19 | 5.64e-20 | 147 |
| hsa04141310 | Esophagus | ESCC | Protein processing in endoplasmic reticulum | 147/4205 | 174/8465 | 3.29e-22 | 1.10e-19 | 5.64e-20 | 147 |
| hsa0414114 | Liver | Cirrhotic | Protein processing in endoplasmic reticulum | 114/2530 | 174/8465 | 1.16e-22 | 9.67e-21 | 5.96e-21 | 114 |
| hsa0414115 | Liver | Cirrhotic | Protein processing in endoplasmic reticulum | 114/2530 | 174/8465 | 1.16e-22 | 9.67e-21 | 5.96e-21 | 114 |
| hsa0414122 | Liver | HCC | Protein processing in endoplasmic reticulum | 146/4020 | 174/8465 | 7.34e-24 | 2.46e-21 | 1.37e-21 | 146 |
| hsa0414132 | Liver | HCC | Protein processing in endoplasmic reticulum | 146/4020 | 174/8465 | 7.34e-24 | 2.46e-21 | 1.37e-21 | 146 |
| hsa0414116 | Lung | IAC | Protein processing in endoplasmic reticulum | 37/1053 | 174/8465 | 6.53e-04 | 5.73e-03 | 3.81e-03 | 37 |
| hsa0414117 | Lung | IAC | Protein processing in endoplasmic reticulum | 37/1053 | 174/8465 | 6.53e-04 | 5.73e-03 | 3.81e-03 | 37 |
| Hugo Symbol | Variant Class | Variant Classification | dbSNP RS | HGVSc | HGVSp | HGVSp Short | SWISSPROT | BIOTYPE | SIFT | PolyPhen | Tumor Sample Barcode | Tissue | Histology | Sex | Age | Stage | Therapy Types | Drugs | Outcome |
| DNAJC1 | SNV | Missense_Mutation | | c.869N>T | p.Pro290Leu | p.P290L | Q96KC8 | protein_coding | deleterious(0.01) | benign(0.005) | TCGA-BH-A0HF-01 | Breast | breast invasive carcinoma | Female | >=65 | I/II | Hormone Therapy | arimidex | SD |
| DNAJC1 | SNV | Missense_Mutation | | c.1644N>C | p.Lys548Asn | p.K548N | Q96KC8 | protein_coding | deleterious(0) | possibly_damaging(0.563) | TCGA-D8-A1JA-01 | Breast | breast invasive carcinoma | Female | <65 | III/IV | Chemotherapy | adriamycin | PD |
| DNAJC1 | insertion | Frame_Shift_Ins | novel | c.1285_1286insTGATGGGGAAAGAGGCCTCTGCACAGGTGTTAGAATCC | p.Asp429ValfsTer58 | p.D429Vfs*58 | Q96KC8 | protein_coding | | | TCGA-A8-A07U-01 | Breast | breast invasive carcinoma | Female | >=65 | III/IV | Chemotherapy | 5-fluorouracil | SD |
| DNAJC1 | SNV | Missense_Mutation | rs781526289 | c.1333N>T | p.Arg445Trp | p.R445W | Q96KC8 | protein_coding | deleterious(0) | probably_damaging(0.995) | TCGA-C5-A7CO-01 | Cervix | cervical & endocervical cancer | Female | >=65 | I/II | Chemotherapy | cisplatin | SD |
| DNAJC1 | SNV | Missense_Mutation | | c.1252G>C | p.Glu418Gln | p.E418Q | Q96KC8 | protein_coding | tolerated(0.25) | benign(0.005) | TCGA-DR-A0ZM-01 | Cervix | cervical & endocervical cancer | Female | <65 | III/IV | Unspecific | Cisplatin | SD |
| DNAJC1 | SNV | Missense_Mutation | | c.1180N>C | p.Val394Leu | p.V394L | Q96KC8 | protein_coding | tolerated(0.13) | benign(0.001) | TCGA-JW-A5VK-01 | Cervix | cervical & endocervical cancer | Female | <65 | I/II | Unknown | Unknown | SD |
| DNAJC1 | SNV | Missense_Mutation | | c.1466N>C | p.Arg489Thr | p.R489T | Q96KC8 | protein_coding | tolerated(0.17) | benign(0.024) | TCGA-Q1-A73P-01 | Cervix | cervical & endocervical cancer | Female | <65 | I/II | Unknown | Unknown | SD |
| DNAJC1 | SNV | Missense_Mutation | | c.1225N>A | p.Asp409Asn | p.D409N | Q96KC8 | protein_coding | tolerated(0.14) | benign(0.038) | TCGA-Q1-A73P-01 | Cervix | cervical & endocervical cancer | Female | <65 | I/II | Unknown | Unknown | SD |
| DNAJC1 | SNV | Missense_Mutation | | c.332N>T | p.Ala111Val | p.A111V | Q96KC8 | protein_coding | deleterious(0) | probably_damaging(0.999) | TCGA-A6-6780-01 | Colorectum | colon adenocarcinoma | Male | >=65 | I/II | Unknown | Unknown | SD |
| DNAJC1 | SNV | Missense_Mutation | | c.1439G>T | p.Ser480Ile | p.S480I | Q96KC8 | protein_coding | deleterious(0.03) | probably_damaging(0.994) | TCGA-AD-5900-01 | Colorectum | colon adenocarcinoma | Male | >=65 | I/II | Unknown | Unknown | SD |


