
|
|||||
|
 | |
| |
| |
| |
| |
| |
|
Gene: TCF7 |
Gene summary for TCF7 |
| Gene information | Species | Human | Gene symbol | TCF7 | Gene ID | 6932 |
| Gene name | transcription factor 7 | |
| Gene Alias | TCF-1 | |
| Cytomap | 5q31.1 | |
| Gene Type | protein-coding | GO ID | GO:0001775 | UniProtAcc | P36402 |
Top |
Malignant transformation analysis |
| Identification of the aberrant gene expression in precancerous and cancerous lesions by comparing the gene expression of stem-like cells in diseased tissues with normal stem cells |
| Entrez ID | Symbol | Replicates | Species | Organ | Tissue | Adj P-value | Log2FC | Malignancy |
| 6932 | TCF7 | HTA11_1938_2000001011 | Human | Colorectum | AD | 2.21e-03 | 3.11e-01 | -0.0811 |
| 6932 | TCF7 | HTA11_696_2000001011 | Human | Colorectum | AD | 1.42e-02 | 1.81e-01 | -0.1464 |
| 6932 | TCF7 | HTA11_866_3004761011 | Human | Colorectum | AD | 2.46e-04 | 2.80e-01 | 0.096 |
| 6932 | TCF7 | HTA11_7696_3000711011 | Human | Colorectum | AD | 9.17e-05 | 2.56e-01 | 0.0674 |
| 6932 | TCF7 | HTA11_99999971662_82457 | Human | Colorectum | MSS | 5.47e-27 | 8.19e-01 | 0.3859 |
| 6932 | TCF7 | HTA11_99999973899_84307 | Human | Colorectum | MSS | 6.34e-12 | 6.41e-01 | 0.2585 |
| 6932 | TCF7 | HTA11_99999974143_84620 | Human | Colorectum | MSS | 7.93e-20 | 5.40e-01 | 0.3005 |
| 6932 | TCF7 | S43 | Human | Liver | Cirrhotic | 3.14e-02 | -1.41e-01 | -0.0187 |
| 6932 | TCF7 | HCC1_Meng | Human | Liver | HCC | 2.48e-13 | -1.54e-01 | 0.0246 |
| 6932 | TCF7 | HCC2_Meng | Human | Liver | HCC | 5.22e-12 | -7.61e-02 | 0.0107 |
| 6932 | TCF7 | HCC1 | Human | Liver | HCC | 9.59e-03 | 3.01e+00 | 0.5336 |
| 6932 | TCF7 | S014 | Human | Liver | HCC | 3.18e-12 | 7.11e-01 | 0.2254 |
| 6932 | TCF7 | S015 | Human | Liver | HCC | 9.32e-10 | 6.73e-01 | 0.2375 |
| 6932 | TCF7 | S016 | Human | Liver | HCC | 8.72e-11 | 6.83e-01 | 0.2243 |
| 6932 | TCF7 | C21 | Human | Oral cavity | OSCC | 4.01e-06 | 1.80e-01 | 0.2678 |
| 6932 | TCF7 | C30 | Human | Oral cavity | OSCC | 2.40e-06 | 3.87e-01 | 0.3055 |
| 6932 | TCF7 | C43 | Human | Oral cavity | OSCC | 1.05e-13 | 3.78e-01 | 0.1704 |
| 6932 | TCF7 | C46 | Human | Oral cavity | OSCC | 1.63e-09 | 2.47e-01 | 0.1673 |
| 6932 | TCF7 | C06 | Human | Oral cavity | OSCC | 2.77e-06 | 7.68e-01 | 0.2699 |
| 6932 | TCF7 | C08 | Human | Oral cavity | OSCC | 7.11e-08 | 2.41e-01 | 0.1919 |
| Page: 1 2 |
| Tissue | Expression Dynamics | Abbreviation |
| Colorectum (GSE201348) |  | FAP: Familial adenomatous polyposis |
| CRC: Colorectal cancer | ||
| Colorectum (HTA11) |  | AD: Adenomas |
| SER: Sessile serrated lesions | ||
| MSI-H: Microsatellite-high colorectal cancer | ||
| MSS: Microsatellite stable colorectal cancer | ||
| Liver |  | HCC: Hepatocellular carcinoma |
| NAFLD: Non-alcoholic fatty liver disease | ||
| Oral Cavity | 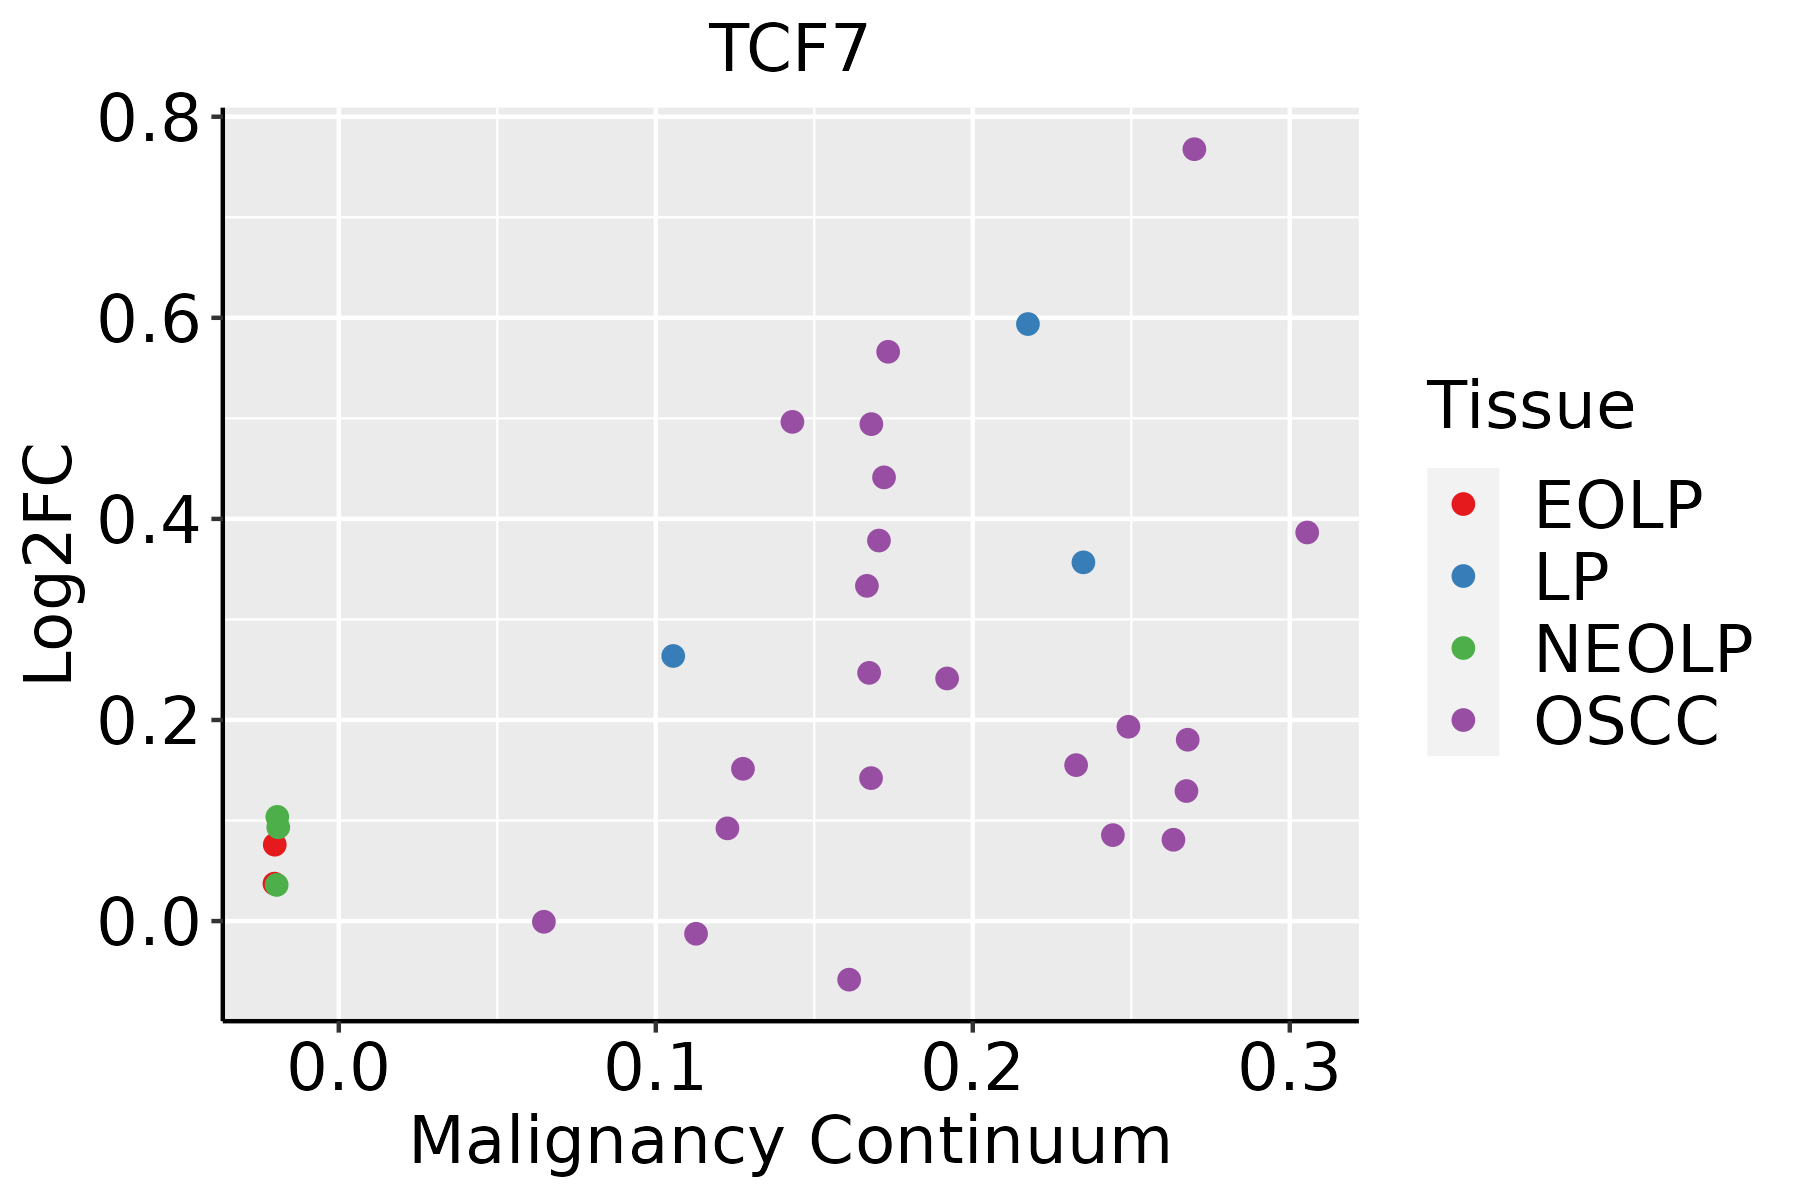 | EOLP: Erosive Oral lichen planus |
| LP: leukoplakia | ||
| NEOLP: Non-erosive oral lichen planus | ||
| OSCC: Oral squamous cell carcinoma | ||
| Thyroid |  | ATC: Anaplastic thyroid cancer |
| HT: Hashimoto's thyroiditis | ||
| PTC: Papillary thyroid cancer |
| ∗log2FC in expression of this searched gene in stem-like cells from each diseased tissue sample relative to stem-like cells in normal samples in each tissue plotted against the malignancy continuum. Samples are colored based on if they are from different disease stage. |
Top |
Malignant transformation related pathway analysis |
| Find out the enriched GO biological processes and KEGG pathways involved in transition from healthy to precancer to cancer |
| Tissue | Disease Stage | Enriched GO biological Processes |
| Colorectum | AD |  |
| Colorectum | SER |  |
| Colorectum | MSS |  |
| Colorectum | MSI-H |  |
| Colorectum | FAP |  |
| ∗Top 15 enriched GO BP terms are showed in the bar plot of each disease state in each tissue. Each row represents a significant GO biological process which is colored according to the -log10(p.adjust). |
| Page: 1 2 3 4 5 6 7 8 9 |
| GO ID | Tissue | Disease Stage | Description | Gene Ratio | Bg Ratio | pvalue | p.adjust | Count |
| GO:003017811 | Lung | AIS | negative regulation of Wnt signaling pathway | 32/1849 | 170/18723 | 2.64e-04 | 5.05e-03 | 32 |
| GO:003428413 | Lung | AIS | response to monosaccharide | 39/1849 | 225/18723 | 3.59e-04 | 6.39e-03 | 39 |
| GO:00512228 | Lung | AIS | positive regulation of protein transport | 49/1849 | 303/18723 | 3.78e-04 | 6.61e-03 | 49 |
| GO:004682513 | Lung | AIS | regulation of protein export from nucleus | 10/1849 | 30/18723 | 4.05e-04 | 7.00e-03 | 10 |
| GO:000632512 | Lung | AIS | chromatin organization | 62/1849 | 409/18723 | 4.24e-04 | 7.29e-03 | 62 |
| GO:006048511 | Lung | AIS | mesenchyme development | 47/1849 | 291/18723 | 5.06e-04 | 8.28e-03 | 47 |
| GO:003209212 | Lung | AIS | positive regulation of protein binding | 19/1849 | 85/18723 | 5.23e-04 | 8.42e-03 | 19 |
| GO:003238612 | Lung | AIS | regulation of intracellular transport | 52/1849 | 337/18723 | 7.89e-04 | 1.11e-02 | 52 |
| GO:004339313 | Lung | AIS | regulation of protein binding | 34/1849 | 196/18723 | 8.16e-04 | 1.14e-02 | 34 |
| GO:005109011 | Lung | AIS | regulation of DNA-binding transcription factor activity | 64/1849 | 440/18723 | 1.04e-03 | 1.36e-02 | 64 |
| GO:19049518 | Lung | AIS | positive regulation of establishment of protein localization | 49/1849 | 319/18723 | 1.21e-03 | 1.54e-02 | 49 |
| GO:004682212 | Lung | AIS | regulation of nucleocytoplasmic transport | 21/1849 | 106/18723 | 1.45e-03 | 1.77e-02 | 21 |
| GO:005109913 | Lung | AIS | positive regulation of binding | 30/1849 | 173/18723 | 1.61e-03 | 1.87e-02 | 30 |
| GO:004544411 | Lung | AIS | fat cell differentiation | 37/1849 | 229/18723 | 1.88e-03 | 2.08e-02 | 37 |
| GO:005067312 | Lung | AIS | epithelial cell proliferation | 62/1849 | 437/18723 | 2.26e-03 | 2.39e-02 | 62 |
| GO:003238812 | Lung | AIS | positive regulation of intracellular transport | 33/1849 | 202/18723 | 2.67e-03 | 2.70e-02 | 33 |
| GO:00097468 | Lung | AIS | response to hexose | 35/1849 | 219/18723 | 2.95e-03 | 2.93e-02 | 35 |
| GO:000661113 | Lung | AIS | protein export from nucleus | 13/1849 | 57/18723 | 3.16e-03 | 3.03e-02 | 13 |
| GO:004876211 | Lung | AIS | mesenchymal cell differentiation | 37/1849 | 236/18723 | 3.19e-03 | 3.05e-02 | 37 |
| GO:0090090 | Lung | AIS | negative regulation of canonical Wnt signaling pathway | 24/1849 | 137/18723 | 3.91e-03 | 3.59e-02 | 24 |
| Page: 1 2 3 4 5 6 7 8 9 10 11 12 13 14 15 16 17 18 19 20 21 22 23 24 25 26 27 28 29 30 31 32 33 34 35 36 37 38 39 40 41 42 43 44 45 46 47 48 49 50 51 52 53 54 |
| Pathway ID | Tissue | Disease Stage | Description | Gene Ratio | Bg Ratio | pvalue | p.adjust | qvalue | Count |
| hsa04520 | Colorectum | AD | Adherens junction | 50/2092 | 93/8465 | 1.52e-09 | 2.83e-08 | 1.81e-08 | 50 |
| hsa05132 | Colorectum | AD | Salmonella infection | 102/2092 | 249/8465 | 7.65e-09 | 1.28e-07 | 8.17e-08 | 102 |
| hsa05213 | Colorectum | AD | Endometrial cancer | 29/2092 | 58/8465 | 2.69e-05 | 2.57e-04 | 1.64e-04 | 29 |
| hsa05216 | Colorectum | AD | Thyroid cancer | 21/2092 | 37/8465 | 3.05e-05 | 2.76e-04 | 1.76e-04 | 21 |
| hsa05210 | Colorectum | AD | Colorectal cancer | 35/2092 | 86/8465 | 7.54e-04 | 5.49e-03 | 3.50e-03 | 35 |
| hsa05225 | Colorectum | AD | Hepatocellular carcinoma | 59/2092 | 168/8465 | 1.50e-03 | 8.69e-03 | 5.54e-03 | 59 |
| hsa05215 | Colorectum | AD | Prostate cancer | 35/2092 | 97/8465 | 7.95e-03 | 3.13e-02 | 2.00e-02 | 35 |
| hsa04310 | Colorectum | AD | Wnt signaling pathway | 56/2092 | 171/8465 | 1.03e-02 | 3.93e-02 | 2.51e-02 | 56 |
| hsa045201 | Colorectum | AD | Adherens junction | 50/2092 | 93/8465 | 1.52e-09 | 2.83e-08 | 1.81e-08 | 50 |
| hsa051321 | Colorectum | AD | Salmonella infection | 102/2092 | 249/8465 | 7.65e-09 | 1.28e-07 | 8.17e-08 | 102 |
| hsa052131 | Colorectum | AD | Endometrial cancer | 29/2092 | 58/8465 | 2.69e-05 | 2.57e-04 | 1.64e-04 | 29 |
| hsa052161 | Colorectum | AD | Thyroid cancer | 21/2092 | 37/8465 | 3.05e-05 | 2.76e-04 | 1.76e-04 | 21 |
| hsa052101 | Colorectum | AD | Colorectal cancer | 35/2092 | 86/8465 | 7.54e-04 | 5.49e-03 | 3.50e-03 | 35 |
| hsa052251 | Colorectum | AD | Hepatocellular carcinoma | 59/2092 | 168/8465 | 1.50e-03 | 8.69e-03 | 5.54e-03 | 59 |
| hsa052151 | Colorectum | AD | Prostate cancer | 35/2092 | 97/8465 | 7.95e-03 | 3.13e-02 | 2.00e-02 | 35 |
| hsa043101 | Colorectum | AD | Wnt signaling pathway | 56/2092 | 171/8465 | 1.03e-02 | 3.93e-02 | 2.51e-02 | 56 |
| hsa051324 | Colorectum | MSS | Salmonella infection | 92/1875 | 249/8465 | 5.23e-08 | 9.74e-07 | 5.97e-07 | 92 |
| hsa045204 | Colorectum | MSS | Adherens junction | 42/1875 | 93/8465 | 6.18e-07 | 9.01e-06 | 5.52e-06 | 42 |
| hsa052162 | Colorectum | MSS | Thyroid cancer | 21/1875 | 37/8465 | 4.98e-06 | 6.00e-05 | 3.68e-05 | 21 |
| hsa052102 | Colorectum | MSS | Colorectal cancer | 36/1875 | 86/8465 | 3.08e-05 | 3.22e-04 | 1.97e-04 | 36 |
| Page: 1 2 3 4 5 |
Top |
Cell-cell communication analysis |
| Identification of potential cell-cell interactions between two cell types and their ligand-receptor pairs for different disease states |
| Ligand | Receptor | LRpair | Pathway | Tissue | Disease Stage |
| Page: 1 |
Top |
Single-cell gene regulatory network inference analysis |
| Find out the significant the regulons (TFs) and the target genes of each regulon across cell types for different disease states |
| TF | Cell Type | Tissue | Disease Stage | Target Gene | RSS | Regulon Activity |
| TCF7 | TFH | Breast | DCIS | IL7R,LEF1,FYB1, etc. | 1.02e-01 |  |
| TCF7 | CD4TN | Breast | DCIS | IL7R,LEF1,FYB1, etc. | 3.17e-01 | |
| TCF7 | TH17 | Breast | DCIS | IL7R,LEF1,FYB1, etc. | 4.70e-02 | |
| TCF7 | CD8TEXINT | Breast | Healthy | IL7R,LEF1,FYB1, etc. | 1.49e-01 |  |
| TCF7 | CD8TCM | Breast | Healthy | IL7R,LEF1,FYB1, etc. | 1.71e-01 | |
| TCF7 | TH17 | Breast | Healthy | IL7R,LEF1,FYB1, etc. | 5.04e-02 | |
| TCF7 | CD4TN | Breast | IDC | IL7R,LEF1,FYB1, etc. | 1.42e-01 |  |
| TCF7 | TFH | Breast | IDC | IL7R,LEF1,FYB1, etc. | 1.63e-01 | |
| TCF7 | CD8TEXINT | Breast | IDC | IL7R,LEF1,FYB1, etc. | 5.67e-02 | |
| TCF7 | TH17 | Breast | IDC | IL7R,LEF1,FYB1, etc. | 5.63e-02 | |
| ∗The dot plots of a searched regulon are shown for all cell subpopulations in each disease state of each tissue based on the regulon specific score inferred using pySCENIC and by calculating the average expression. |
| Page: 1 2 3 4 5 6 7 8 |
Top |
Somatic mutation of malignant transformation related genes |
| Annotation of somatic variants for genes involved in malignant transformation |
| Hugo Symbol | Variant Class | Variant Classification | dbSNP RS | HGVSc | HGVSp | HGVSp Short | SWISSPROT | BIOTYPE | SIFT | PolyPhen | Tumor Sample Barcode | Tissue | Histology | Sex | Age | Stage | Therapy Types | Drugs | Outcome |
| TCF7 | SNV | Missense_Mutation | c.379N>A | p.Leu127Met | p.L127M | P36402 | protein_coding | tolerated(0.27) | probably_damaging(0.991) | TCGA-AC-A23H-01 | Breast | breast invasive carcinoma | Female | >=65 | I/II | Unknown | Unknown | PD | |
| TCF7 | insertion | Frame_Shift_Ins | rs771602751 | c.456_457insC | p.His155ProfsTer37 | p.H155Pfs*37 | P36402 | protein_coding | TCGA-A8-A07R-01 | Breast | breast invasive carcinoma | Female | >=65 | III/IV | Ancillary | zoledronic | SD | ||
| TCF7 | insertion | Frame_Shift_Ins | rs771602751 | c.456_457insC | p.His155ProfsTer37 | p.H155Pfs*37 | P36402 | protein_coding | TCGA-MA-AA42-01 | Cervix | cervical & endocervical cancer | Female | >=65 | I/II | Unknown | Unknown | SD | ||
| TCF7 | SNV | Missense_Mutation | rs766182177 | c.1043G>A | p.Arg348Gln | p.R348Q | P36402 | protein_coding | deleterious(0.01) | probably_damaging(0.99) | TCGA-AZ-6598-01 | Colorectum | colon adenocarcinoma | Female | >=65 | I/II | Unknown | Unknown | SD |
| TCF7 | SNV | Missense_Mutation | rs775076567 | c.490N>A | p.Glu164Lys | p.E164K | P36402 | protein_coding | deleterious(0.03) | benign(0.049) | TCGA-CA-6717-01 | Colorectum | colon adenocarcinoma | Male | <65 | I/II | Chemotherapy | oxaliplatin | CR |
| TCF7 | SNV | Missense_Mutation | novel | c.854C>T | p.Ala285Val | p.A285V | P36402 | protein_coding | deleterious(0) | probably_damaging(0.994) | TCGA-NH-A5IV-01 | Colorectum | colon adenocarcinoma | Female | >=65 | I/II | Unknown | Unknown | SD |
| TCF7 | SNV | Missense_Mutation | c.1016N>A | p.Arg339Gln | p.R339Q | P36402 | protein_coding | deleterious(0) | probably_damaging(0.99) | TCGA-WS-AB45-01 | Colorectum | colon adenocarcinoma | Female | <65 | I/II | Unknown | Unknown | SD | |
| TCF7 | SNV | Missense_Mutation | rs775076567 | c.490G>A | p.Glu164Lys | p.E164K | P36402 | protein_coding | deleterious(0.03) | benign(0.049) | TCGA-AG-A002-01 | Colorectum | rectum adenocarcinoma | Male | <65 | I/II | Unknown | Unknown | SD |
| TCF7 | SNV | Missense_Mutation | novel | c.810G>T | p.Lys270Asn | p.K270N | P36402 | protein_coding | deleterious(0) | probably_damaging(0.996) | TCGA-AG-A002-01 | Colorectum | rectum adenocarcinoma | Male | <65 | I/II | Unknown | Unknown | SD |
| TCF7 | SNV | Missense_Mutation | novel | c.601N>T | p.Gly201Cys | p.G201C | P36402 | protein_coding | deleterious(0) | probably_damaging(0.939) | TCGA-AP-A059-01 | Endometrium | uterine corpus endometrioid carcinoma | Female | >=65 | I/II | Unknown | Unknown | SD |
| Page: 1 2 3 4 |
Top |
Related drugs of malignant transformation related genes |
| Identification of chemicals and drugs interact with genes involved in malignant transfromation |
| (DGIdb 4.0) |
| Entrez ID | Symbol | Category | Interaction Types | Drug Claim Name | Drug Name | PMIDs |
| Page: 1 |

Copyright 2023-Present -The University of Texas Health Science Center at Houston |