| Tissue | Expression Dynamics | Abbreviation |
| Colorectum (GSE201348) |  | FAP: Familial adenomatous polyposis |
| CRC: Colorectal cancer |
| Colorectum (HTA11) |  | AD: Adenomas |
| SER: Sessile serrated lesions |
| MSI-H: Microsatellite-high colorectal cancer |
| MSS: Microsatellite stable colorectal cancer |
| Esophagus | 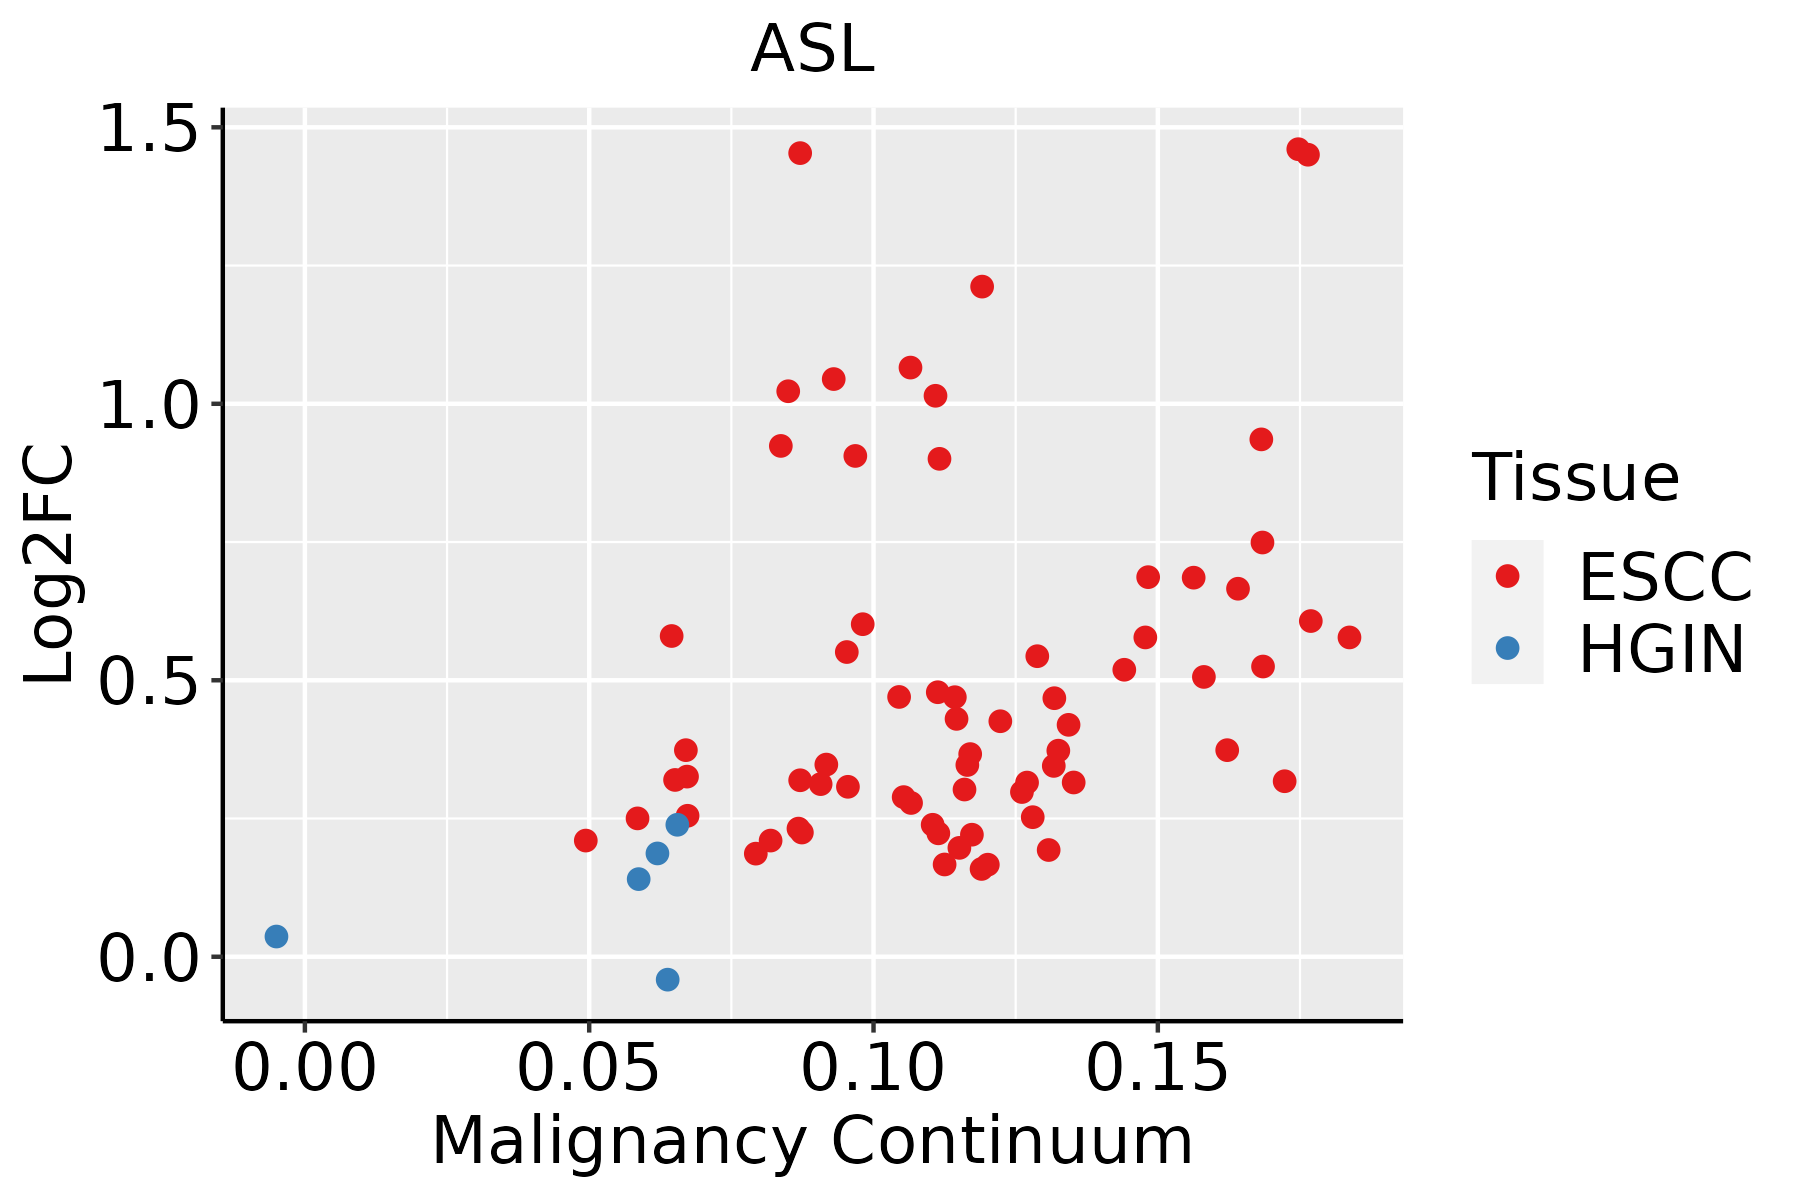 | ESCC: Esophageal squamous cell carcinoma |
| HGIN: High-grade intraepithelial neoplasias |
| LGIN: Low-grade intraepithelial neoplasias |
| GC | 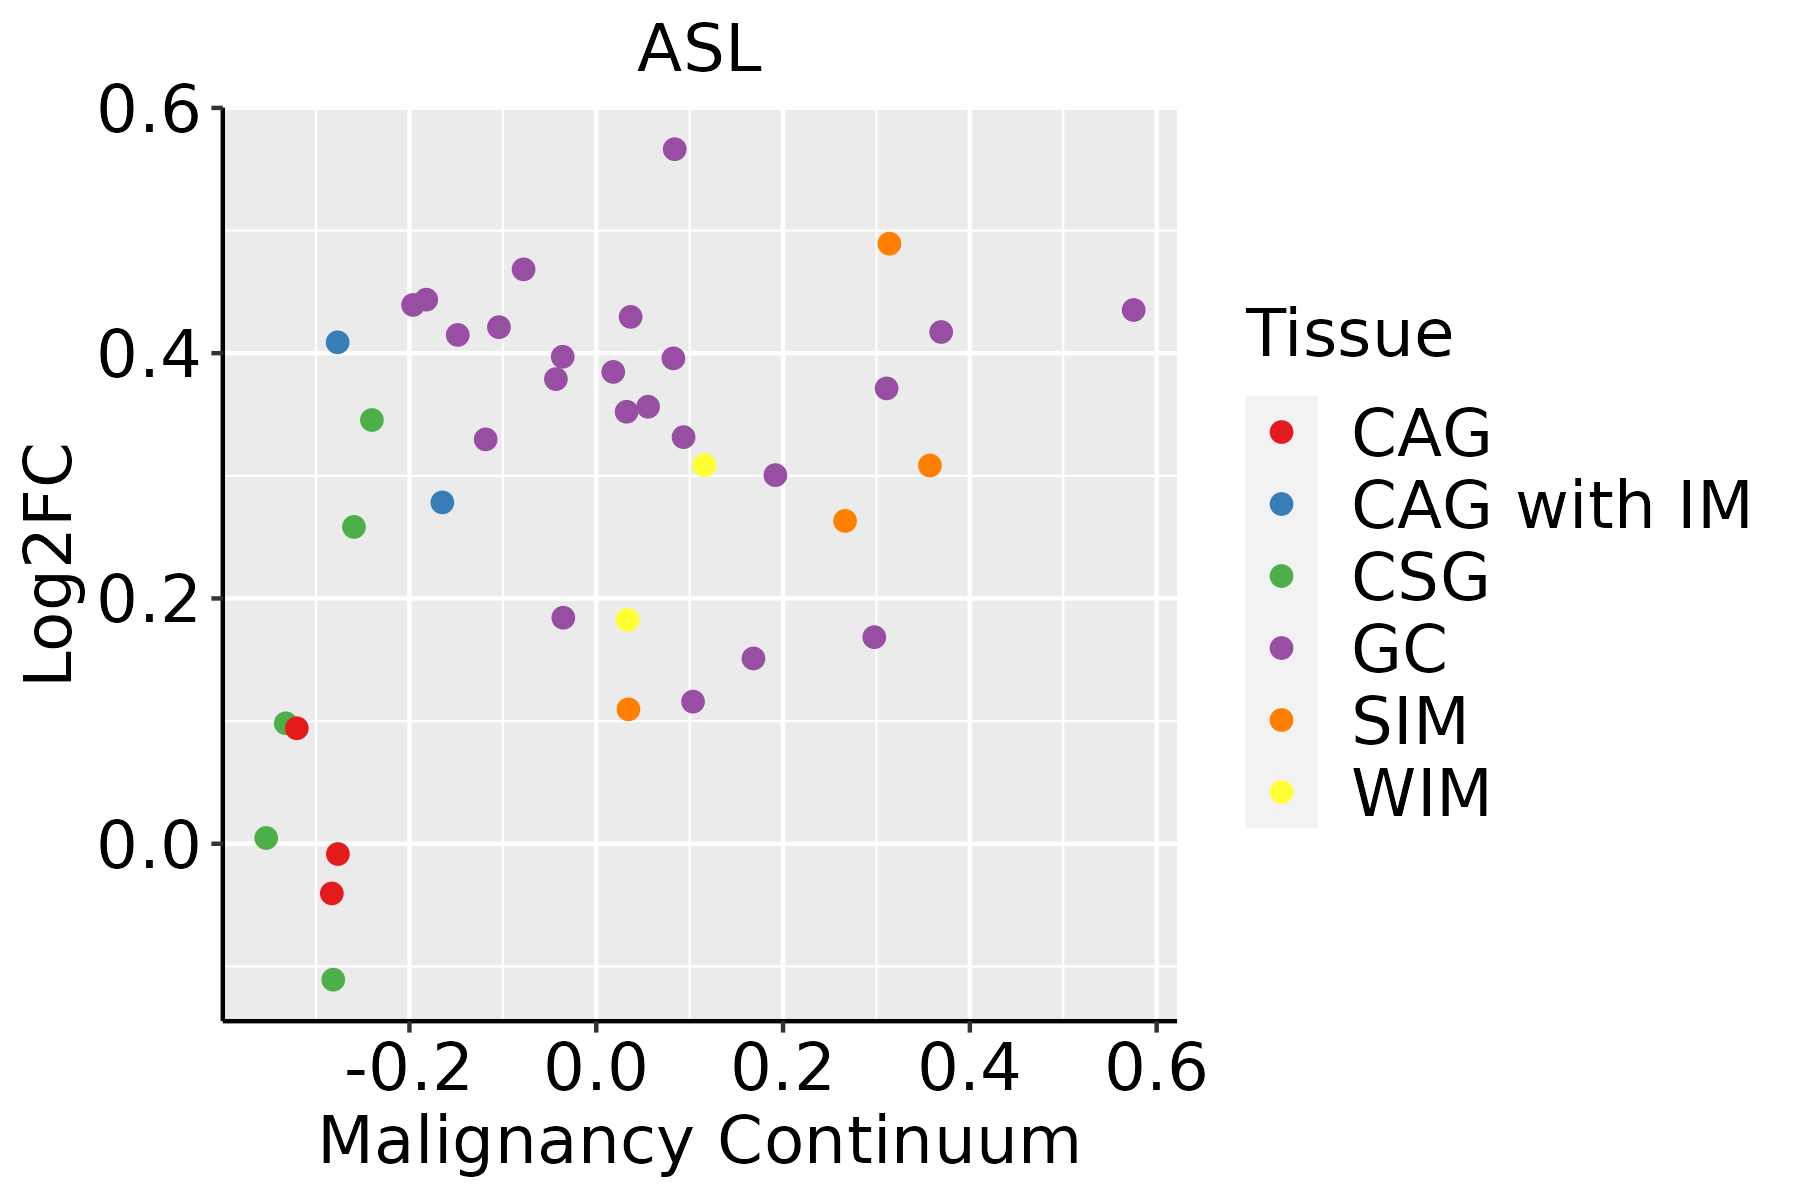 | CAG: Chronic atrophic gastritis |
| CAG with IM: Chronic atrophic gastritis with intestinal metaplasia |
| CSG: Chronic superficial gastritis |
| GC: Gastric cancer |
| SIM: Severe intestinal metaplasia |
| WIM: Wild intestinal metaplasia |
| Liver | 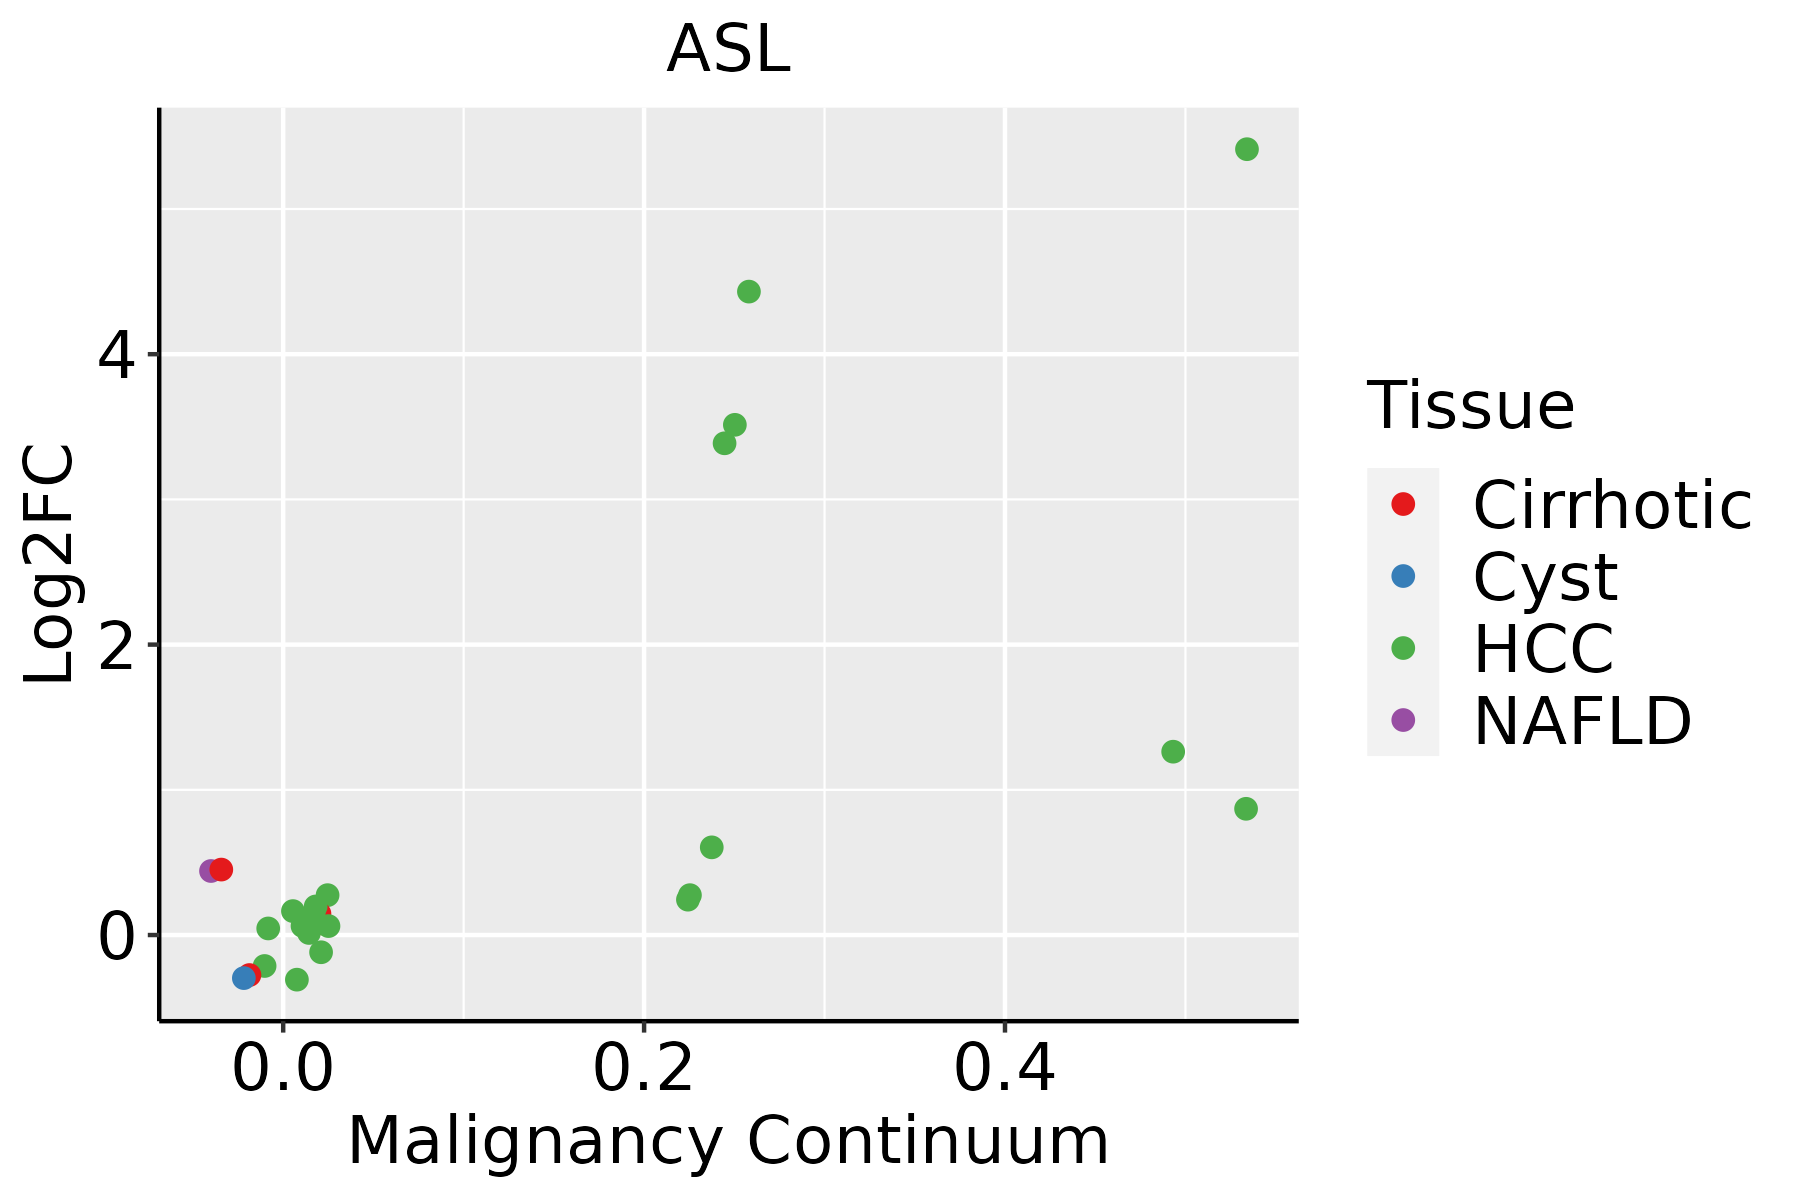 | HCC: Hepatocellular carcinoma |
| NAFLD: Non-alcoholic fatty liver disease |
| Lung | 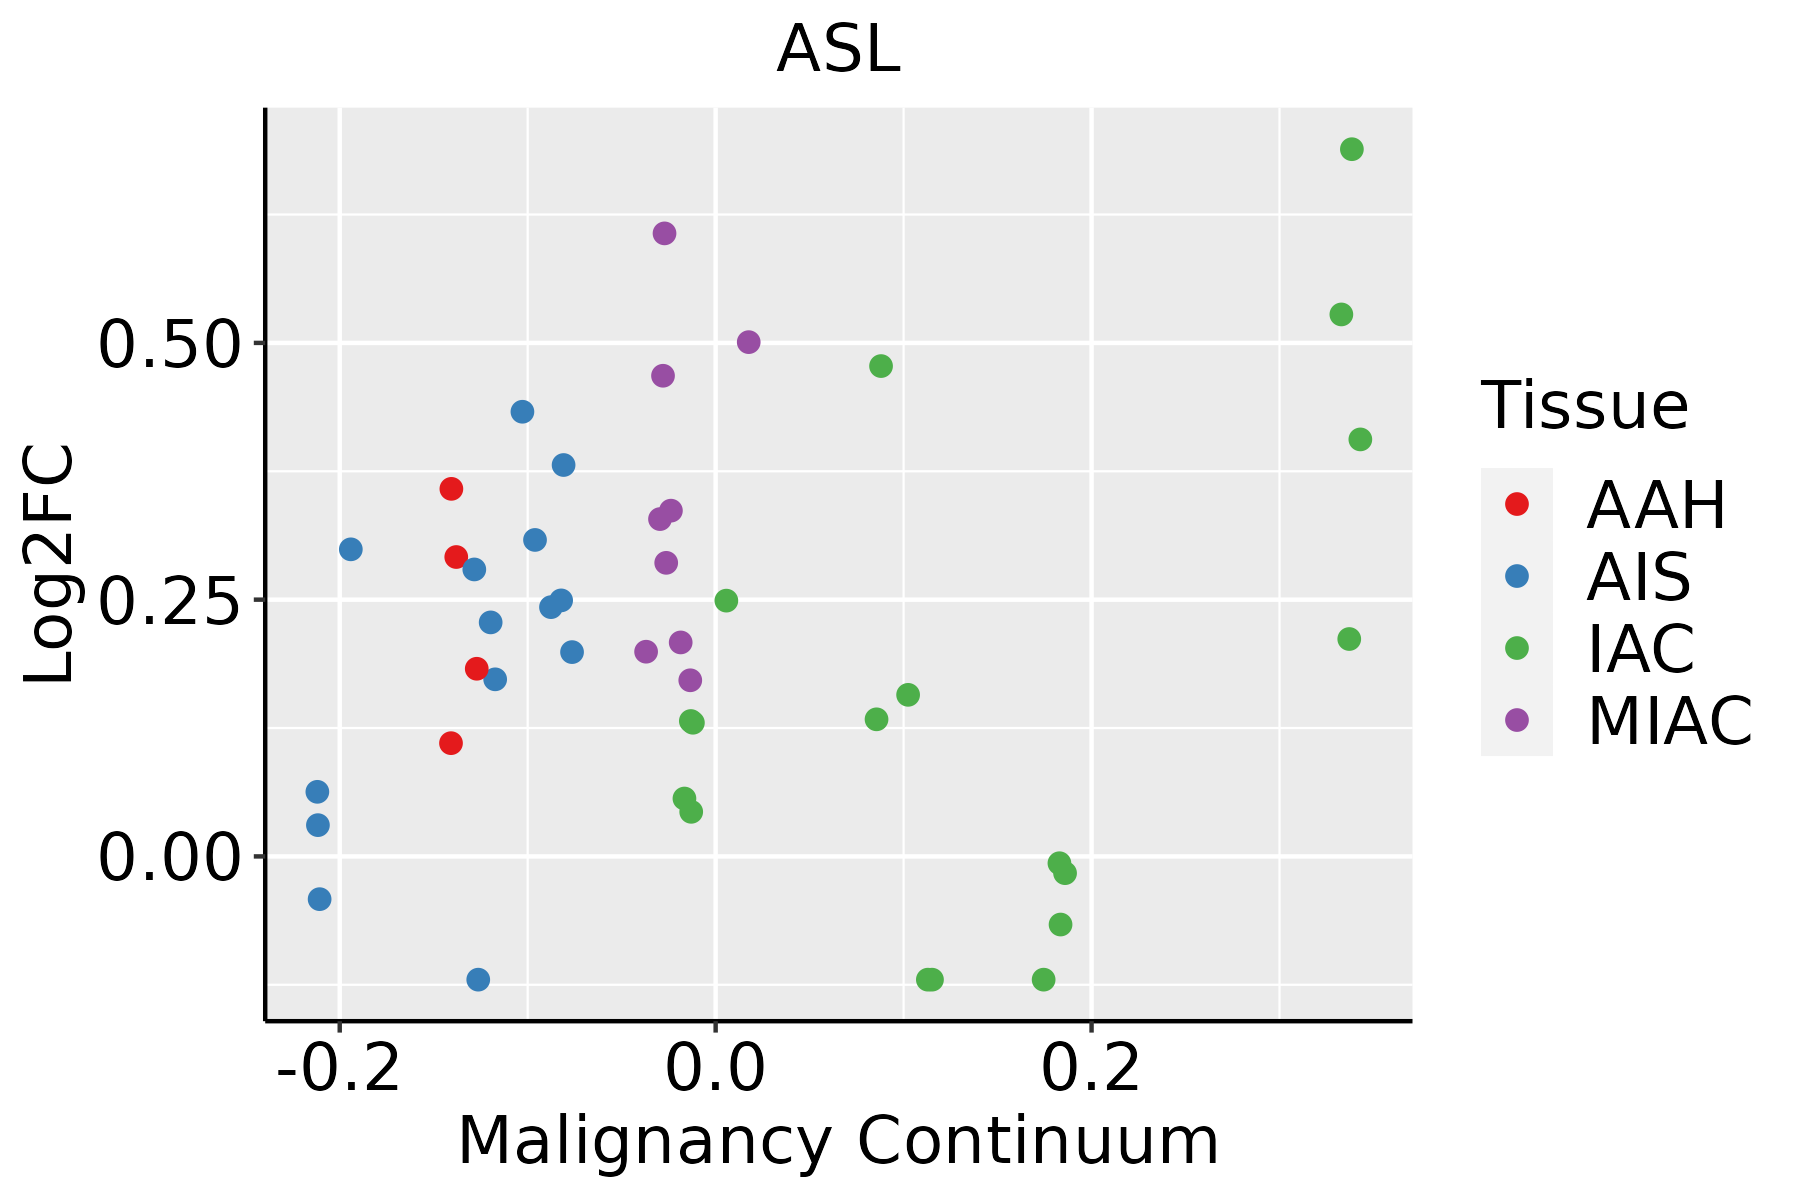 | AAH: Atypical adenomatous hyperplasia |
| AIS: Adenocarcinoma in situ |
| IAC: Invasive lung adenocarcinoma |
| MIA: Minimally invasive adenocarcinoma |
| Oral Cavity | 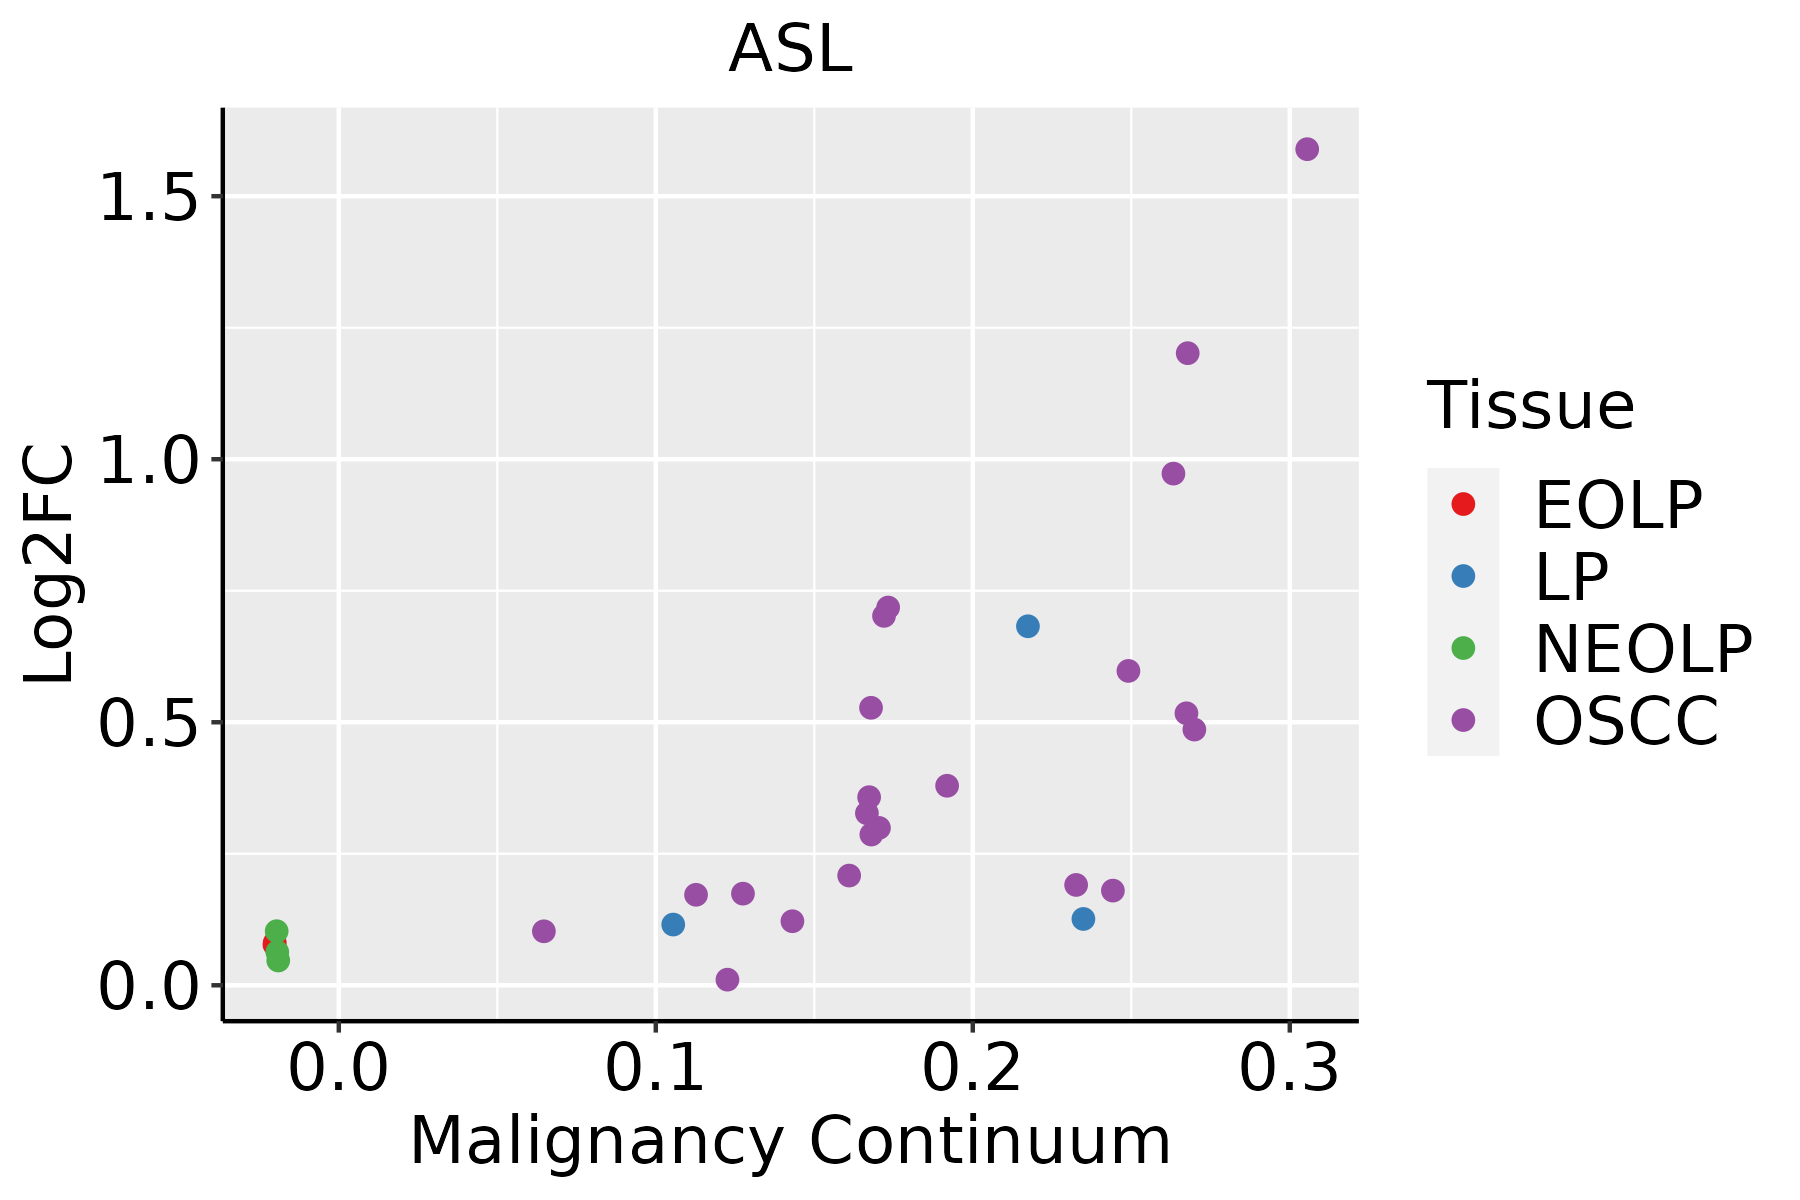 | EOLP: Erosive Oral lichen planus |
| LP: leukoplakia |
| NEOLP: Non-erosive oral lichen planus |
| OSCC: Oral squamous cell carcinoma |
| Thyroid | 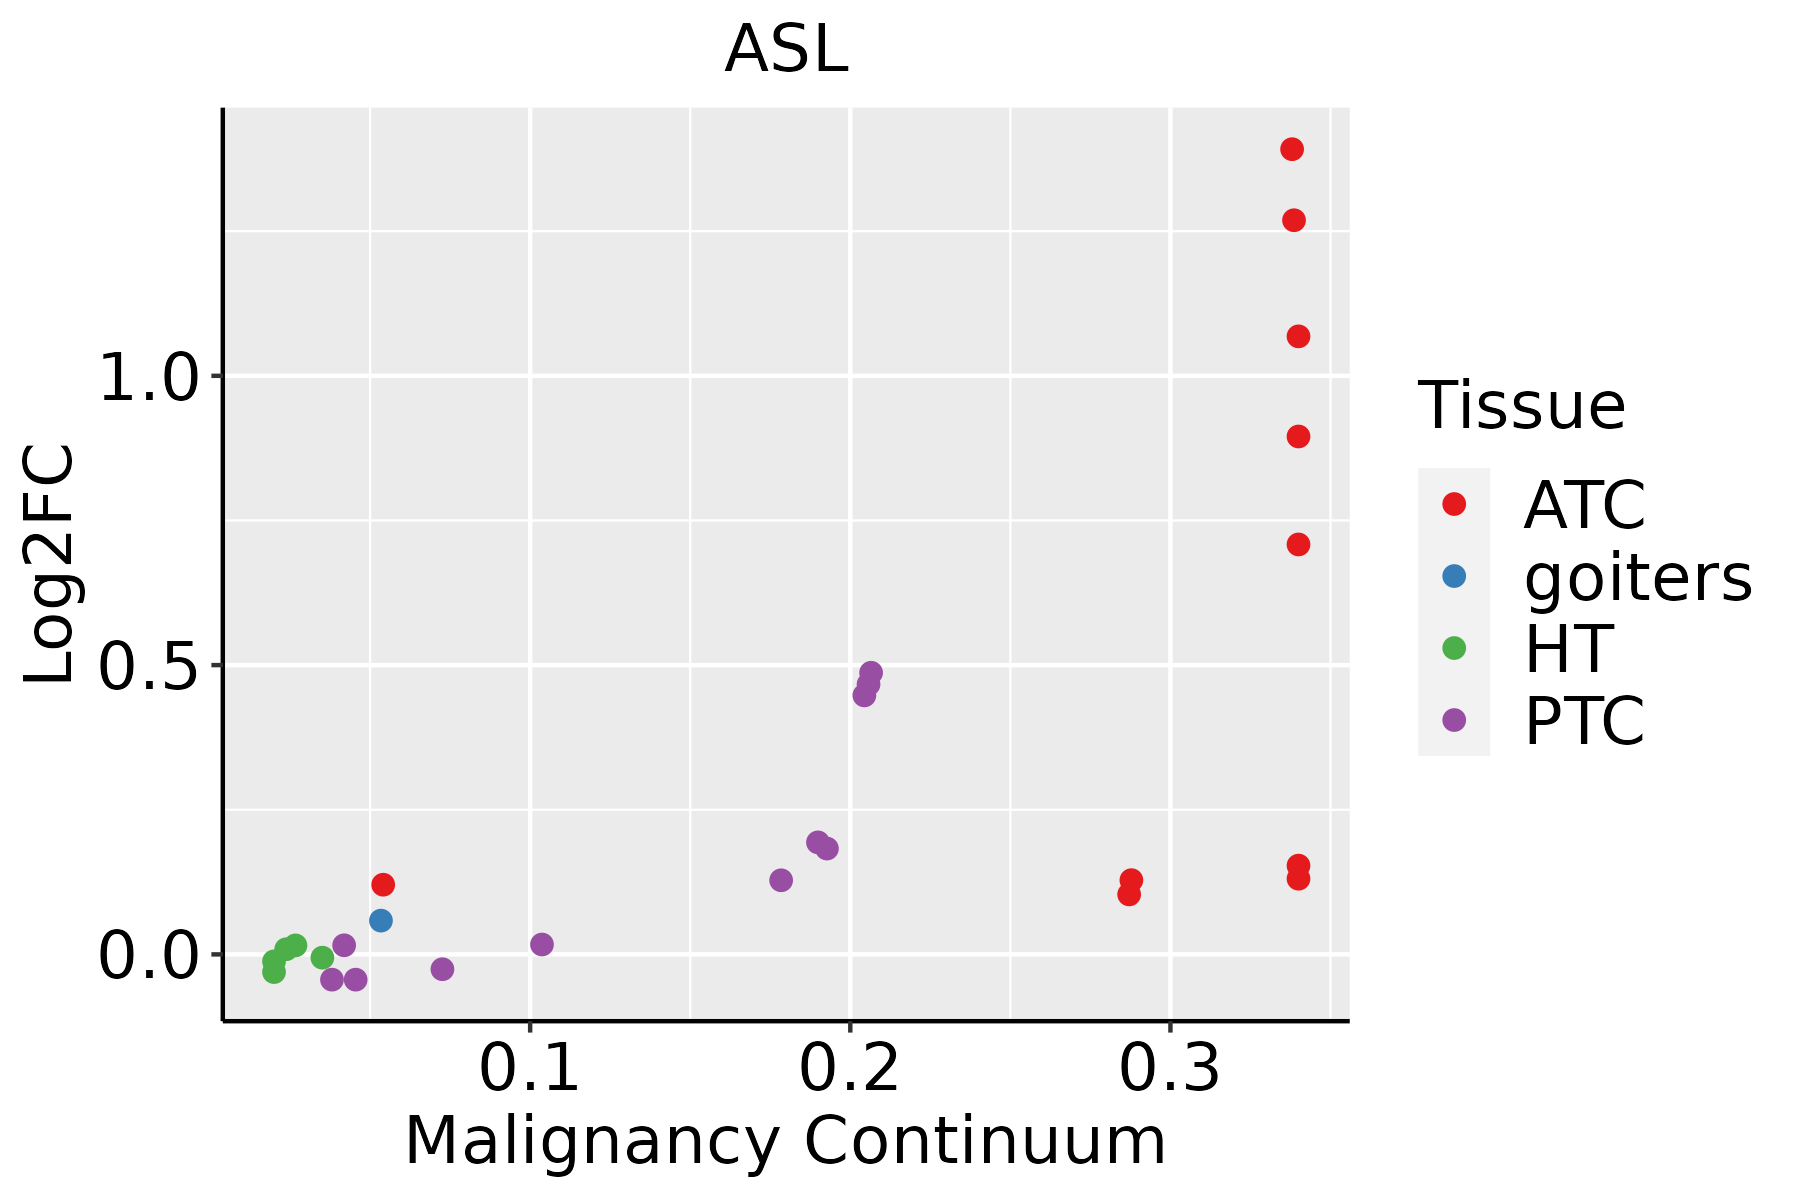 | ATC: Anaplastic thyroid cancer |
| HT: Hashimoto's thyroiditis |
| PTC: Papillary thyroid cancer |
| GO ID | Tissue | Disease Stage | Description | Gene Ratio | Bg Ratio | pvalue | p.adjust | Count |
| GO:000268314 | Prostate | Tumor | negative regulation of immune system process | 101/3246 | 434/18723 | 8.70e-04 | 5.85e-03 | 101 |
| GO:006099711 | Prostate | Tumor | dendritic spine morphogenesis | 21/3246 | 61/18723 | 9.70e-04 | 6.30e-03 | 21 |
| GO:003431511 | Prostate | Tumor | regulation of Arp2/3 complex-mediated actin nucleation | 10/3246 | 21/18723 | 1.33e-03 | 8.31e-03 | 10 |
| GO:003004815 | Prostate | Tumor | actin filament-based movement | 36/3246 | 127/18723 | 1.38e-03 | 8.62e-03 | 36 |
| GO:004825914 | Prostate | Tumor | regulation of receptor-mediated endocytosis | 31/3246 | 110/18723 | 3.15e-03 | 1.65e-02 | 31 |
| GO:009951514 | Prostate | Tumor | actin filament-based transport | 9/3246 | 21/18723 | 5.54e-03 | 2.61e-02 | 9 |
| GO:005112711 | Prostate | Tumor | positive regulation of actin nucleation | 7/3246 | 15/18723 | 8.22e-03 | 3.60e-02 | 7 |
| GO:00070093 | Prostate | Tumor | plasma membrane organization | 36/3246 | 142/18723 | 1.00e-02 | 4.20e-02 | 36 |
| GO:009951811 | Prostate | Tumor | vesicle cytoskeletal trafficking | 21/3246 | 73/18723 | 1.06e-02 | 4.41e-02 | 21 |
| GO:00463944 | Stomach | GC | carboxylic acid biosynthetic process | 37/1159 | 314/18723 | 1.28e-04 | 2.41e-03 | 37 |
| GO:00160534 | Stomach | GC | organic acid biosynthetic process | 37/1159 | 316/18723 | 1.46e-04 | 2.67e-03 | 37 |
| GO:0009084 | Stomach | GC | glutamine family amino acid biosynthetic process | 5/1159 | 17/18723 | 2.98e-03 | 2.66e-02 | 5 |
| GO:004639411 | Stomach | CAG with IM | carboxylic acid biosynthetic process | 31/1050 | 314/18723 | 1.63e-03 | 1.80e-02 | 31 |
| GO:001605311 | Stomach | CAG with IM | organic acid biosynthetic process | 31/1050 | 316/18723 | 1.81e-03 | 1.94e-02 | 31 |
| GO:00090841 | Stomach | CAG with IM | glutamine family amino acid biosynthetic process | 5/1050 | 17/18723 | 1.93e-03 | 2.02e-02 | 5 |
| GO:00090842 | Stomach | CSG | glutamine family amino acid biosynthetic process | 5/1034 | 17/18723 | 1.80e-03 | 1.93e-02 | 5 |
| GO:00463942 | Stomach | CSG | carboxylic acid biosynthetic process | 30/1034 | 314/18723 | 2.52e-03 | 2.46e-02 | 30 |
| GO:00160532 | Stomach | CSG | organic acid biosynthetic process | 30/1034 | 316/18723 | 2.77e-03 | 2.63e-02 | 30 |
| GO:00463943 | Stomach | SIM | carboxylic acid biosynthetic process | 30/708 | 314/18723 | 3.33e-06 | 1.57e-04 | 30 |
| GO:00160533 | Stomach | SIM | organic acid biosynthetic process | 30/708 | 316/18723 | 3.79e-06 | 1.68e-04 | 30 |
| Pathway ID | Tissue | Disease Stage | Description | Gene Ratio | Bg Ratio | pvalue | p.adjust | qvalue | Count |
| hsa01230 | Colorectum | AD | Biosynthesis of amino acids | 28/2092 | 75/8465 | 9.99e-03 | 3.89e-02 | 2.48e-02 | 28 |
| hsa012301 | Colorectum | AD | Biosynthesis of amino acids | 28/2092 | 75/8465 | 9.99e-03 | 3.89e-02 | 2.48e-02 | 28 |
| hsa012302 | Colorectum | SER | Biosynthesis of amino acids | 23/1580 | 75/8465 | 8.11e-03 | 4.14e-02 | 3.01e-02 | 23 |
| hsa012303 | Colorectum | SER | Biosynthesis of amino acids | 23/1580 | 75/8465 | 8.11e-03 | 4.14e-02 | 3.01e-02 | 23 |
| hsa0123023 | Esophagus | ESCC | Biosynthesis of amino acids | 49/4205 | 75/8465 | 4.35e-03 | 1.12e-02 | 5.74e-03 | 49 |
| hsa0123033 | Esophagus | ESCC | Biosynthesis of amino acids | 49/4205 | 75/8465 | 4.35e-03 | 1.12e-02 | 5.74e-03 | 49 |
| hsa012304 | Liver | Cirrhotic | Biosynthesis of amino acids | 35/2530 | 75/8465 | 1.54e-03 | 7.83e-03 | 4.83e-03 | 35 |
| hsa0123011 | Liver | Cirrhotic | Biosynthesis of amino acids | 35/2530 | 75/8465 | 1.54e-03 | 7.83e-03 | 4.83e-03 | 35 |
| hsa0123021 | Liver | HCC | Biosynthesis of amino acids | 53/4020 | 75/8465 | 3.79e-05 | 2.11e-04 | 1.18e-04 | 53 |
| hsa0123031 | Liver | HCC | Biosynthesis of amino acids | 53/4020 | 75/8465 | 3.79e-05 | 2.11e-04 | 1.18e-04 | 53 |
| hsa012305 | Oral cavity | OSCC | Biosynthesis of amino acids | 45/3704 | 75/8465 | 3.27e-03 | 8.23e-03 | 4.19e-03 | 45 |
| hsa0123012 | Oral cavity | OSCC | Biosynthesis of amino acids | 45/3704 | 75/8465 | 3.27e-03 | 8.23e-03 | 4.19e-03 | 45 |
| hsa00220 | Stomach | GC | Arginine biosynthesis | 6/708 | 22/8465 | 7.81e-03 | 4.10e-02 | 2.88e-02 | 6 |
| hsa002201 | Stomach | GC | Arginine biosynthesis | 6/708 | 22/8465 | 7.81e-03 | 4.10e-02 | 2.88e-02 | 6 |
| Hugo Symbol | Variant Class | Variant Classification | dbSNP RS | HGVSc | HGVSp | HGVSp Short | SWISSPROT | BIOTYPE | SIFT | PolyPhen | Tumor Sample Barcode | Tissue | Histology | Sex | Age | Stage | Therapy Types | Drugs | Outcome |
| ASL | SNV | Missense_Mutation | | c.22N>T | p.Leu8Phe | p.L8F | P04424 | protein_coding | deleterious(0) | probably_damaging(0.912) | TCGA-A1-A0SH-01 | Breast | breast invasive carcinoma | Female | <65 | I/II | Chemotherapy | tc | SD |
| ASL | SNV | Missense_Mutation | | c.1188N>G | p.Phe396Leu | p.F396L | P04424 | protein_coding | tolerated(0.69) | benign(0.003) | TCGA-A8-A09G-01 | Breast | breast invasive carcinoma | Female | >=65 | III/IV | Unknown | Unknown | SD |
| ASL | SNV | Missense_Mutation | | c.653C>T | p.Ala218Val | p.A218V | P04424 | protein_coding | tolerated(0.08) | benign(0.01) | TCGA-D8-A1XW-01 | Breast | breast invasive carcinoma | Female | <65 | I/II | Chemotherapy | adriamycin+cyclophosphamide | SD |
| ASL | SNV | Missense_Mutation | | c.219N>C | p.Glu73Asp | p.E73D | P04424 | protein_coding | deleterious(0.04) | probably_damaging(1) | TCGA-E2-A14R-01 | Breast | breast invasive carcinoma | Female | <65 | I/II | Chemotherapy | doxorubicin | PD |
| ASL | SNV | Missense_Mutation | | c.491N>T | p.Ala164Val | p.A164V | P04424 | protein_coding | deleterious(0) | probably_damaging(0.971) | TCGA-E2-A15M-01 | Breast | breast invasive carcinoma | Female | >=65 | I/II | Hormone Therapy | arimidex | SD |
| ASL | SNV | Missense_Mutation | | c.1188N>G | p.Phe396Leu | p.F396L | P04424 | protein_coding | tolerated(0.69) | benign(0.003) | TCGA-XX-A89A-01 | Breast | breast invasive carcinoma | Female | >=65 | I/II | Unknown | Unknown | SD |
| ASL | insertion | Frame_Shift_Ins | novel | c.1285_1286insAA | p.Asp429GlufsTer120 | p.D429Efs*120 | P04424 | protein_coding | | | TCGA-A8-A06P-01 | Breast | breast invasive carcinoma | Female | <65 | III/IV | Unspecific | | SD |
| ASL | insertion | In_Frame_Ins | novel | c.1287_1288insATAAAGGCCAGTAAAACA | p.Asp429_Tyr430insIleLysAlaSerLysThr | p.D429_Y430insIKASKT | P04424 | protein_coding | | | TCGA-A8-A06P-01 | Breast | breast invasive carcinoma | Female | <65 | III/IV | Unspecific | | SD |
| ASL | SNV | Missense_Mutation | novel | c.486N>C | p.Gln162His | p.Q162H | P04424 | protein_coding | deleterious(0) | probably_damaging(0.997) | TCGA-JW-A5VL-01 | Cervix | cervical & endocervical cancer | Female | <65 | I/II | Unknown | Unknown | SD |
| ASL | SNV | Missense_Mutation | | c.535G>A | p.Ala179Thr | p.A179T | P04424 | protein_coding | tolerated(0.13) | possibly_damaging(0.886) | TCGA-AA-3492-01 | Colorectum | colon adenocarcinoma | Female | >=65 | I/II | Unknown | Unknown | SD |


