
|
|||||
|
 | |
| |
| |
| |
| |
| |
|
Gene: ANK3 |
Gene summary for ANK3 |
| Gene information | Species | Human | Gene symbol | ANK3 | Gene ID | 288 |
| Gene name | ankyrin 3 | |
| Gene Alias | ANKYRIN-G | |
| Cytomap | 10q21.2 | |
| Gene Type | protein-coding | GO ID | GO:0000278 | UniProtAcc | Q12955 |
Top |
Malignant transformation analysis |
| Identification of the aberrant gene expression in precancerous and cancerous lesions by comparing the gene expression of stem-like cells in diseased tissues with normal stem cells |
| Entrez ID | Symbol | Replicates | Species | Organ | Tissue | Adj P-value | Log2FC | Malignancy |
| 288 | ANK3 | CA_HPV_1 | Human | Cervix | CC | 6.30e-03 | -2.39e-01 | 0.0264 |
| 288 | ANK3 | CCI_1 | Human | Cervix | CC | 6.68e-11 | 1.43e+00 | 0.528 |
| 288 | ANK3 | CCI_2 | Human | Cervix | CC | 1.57e-20 | 2.22e+00 | 0.5249 |
| 288 | ANK3 | CCI_3 | Human | Cervix | CC | 1.66e-37 | 2.03e+00 | 0.516 |
| 288 | ANK3 | CCII_1 | Human | Cervix | CC | 5.77e-03 | 3.56e-01 | 0.3249 |
| 288 | ANK3 | HTA11_3410_2000001011 | Human | Colorectum | AD | 3.42e-31 | -7.79e-01 | 0.0155 |
| 288 | ANK3 | HTA11_2487_2000001011 | Human | Colorectum | SER | 2.30e-04 | -4.55e-01 | -0.1808 |
| 288 | ANK3 | HTA11_3361_2000001011 | Human | Colorectum | AD | 5.21e-20 | -8.78e-01 | -0.1207 |
| 288 | ANK3 | HTA11_696_2000001011 | Human | Colorectum | AD | 1.95e-29 | -6.31e-01 | -0.1464 |
| 288 | ANK3 | HTA11_866_2000001011 | Human | Colorectum | AD | 3.63e-07 | -3.70e-01 | -0.1001 |
| 288 | ANK3 | HTA11_5212_2000001011 | Human | Colorectum | AD | 5.52e-04 | -5.71e-01 | -0.2061 |
| 288 | ANK3 | HTA11_7862_2000001011 | Human | Colorectum | AD | 2.44e-05 | -5.84e-01 | -0.0179 |
| 288 | ANK3 | HTA11_866_3004761011 | Human | Colorectum | AD | 8.05e-24 | -7.61e-01 | 0.096 |
| 288 | ANK3 | HTA11_8622_2000001021 | Human | Colorectum | SER | 9.09e-08 | -7.04e-01 | 0.0528 |
| 288 | ANK3 | HTA11_10711_2000001011 | Human | Colorectum | AD | 1.24e-07 | -5.69e-01 | 0.0338 |
| 288 | ANK3 | HTA11_7696_3000711011 | Human | Colorectum | AD | 1.51e-12 | -4.65e-01 | 0.0674 |
| 288 | ANK3 | HTA11_11156_2000001011 | Human | Colorectum | AD | 1.74e-05 | -9.51e-01 | 0.0397 |
| 288 | ANK3 | HTA11_99999970781_79442 | Human | Colorectum | MSS | 1.73e-15 | -4.97e-01 | 0.294 |
| 288 | ANK3 | HTA11_99999971662_82457 | Human | Colorectum | MSS | 8.50e-08 | -3.67e-01 | 0.3859 |
| 288 | ANK3 | HTA11_99999973899_84307 | Human | Colorectum | MSS | 4.60e-18 | -9.56e-01 | 0.2585 |
| Page: 1 2 3 4 5 6 7 8 9 10 11 |
| Tissue | Expression Dynamics | Abbreviation |
| Cervix | 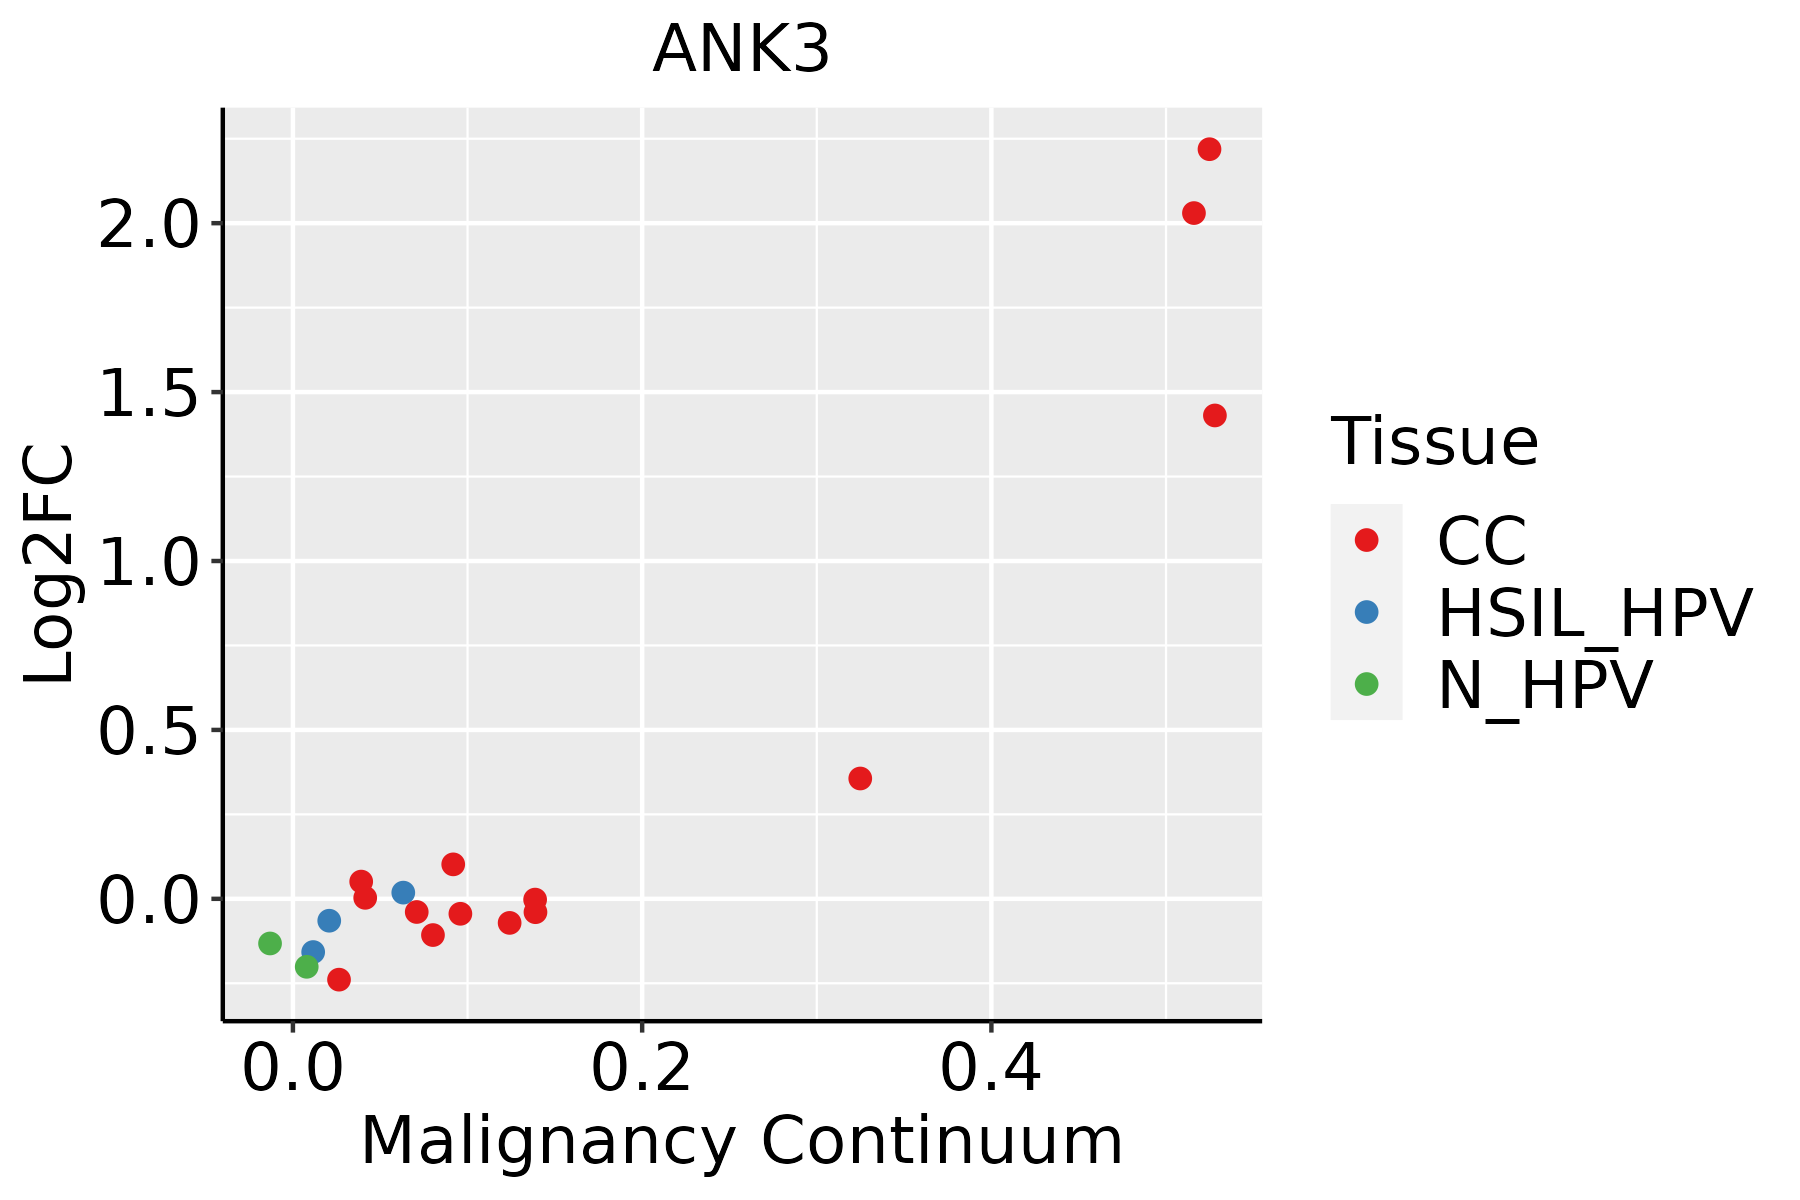 | CC: Cervix cancer |
| HSIL_HPV: HPV-infected high-grade squamous intraepithelial lesions | ||
| N_HPV: HPV-infected normal cervix | ||
| Colorectum (GSE201348) |  | FAP: Familial adenomatous polyposis |
| CRC: Colorectal cancer | ||
| Colorectum (HTA11) |  | AD: Adenomas |
| SER: Sessile serrated lesions | ||
| MSI-H: Microsatellite-high colorectal cancer | ||
| MSS: Microsatellite stable colorectal cancer | ||
| Endometrium | 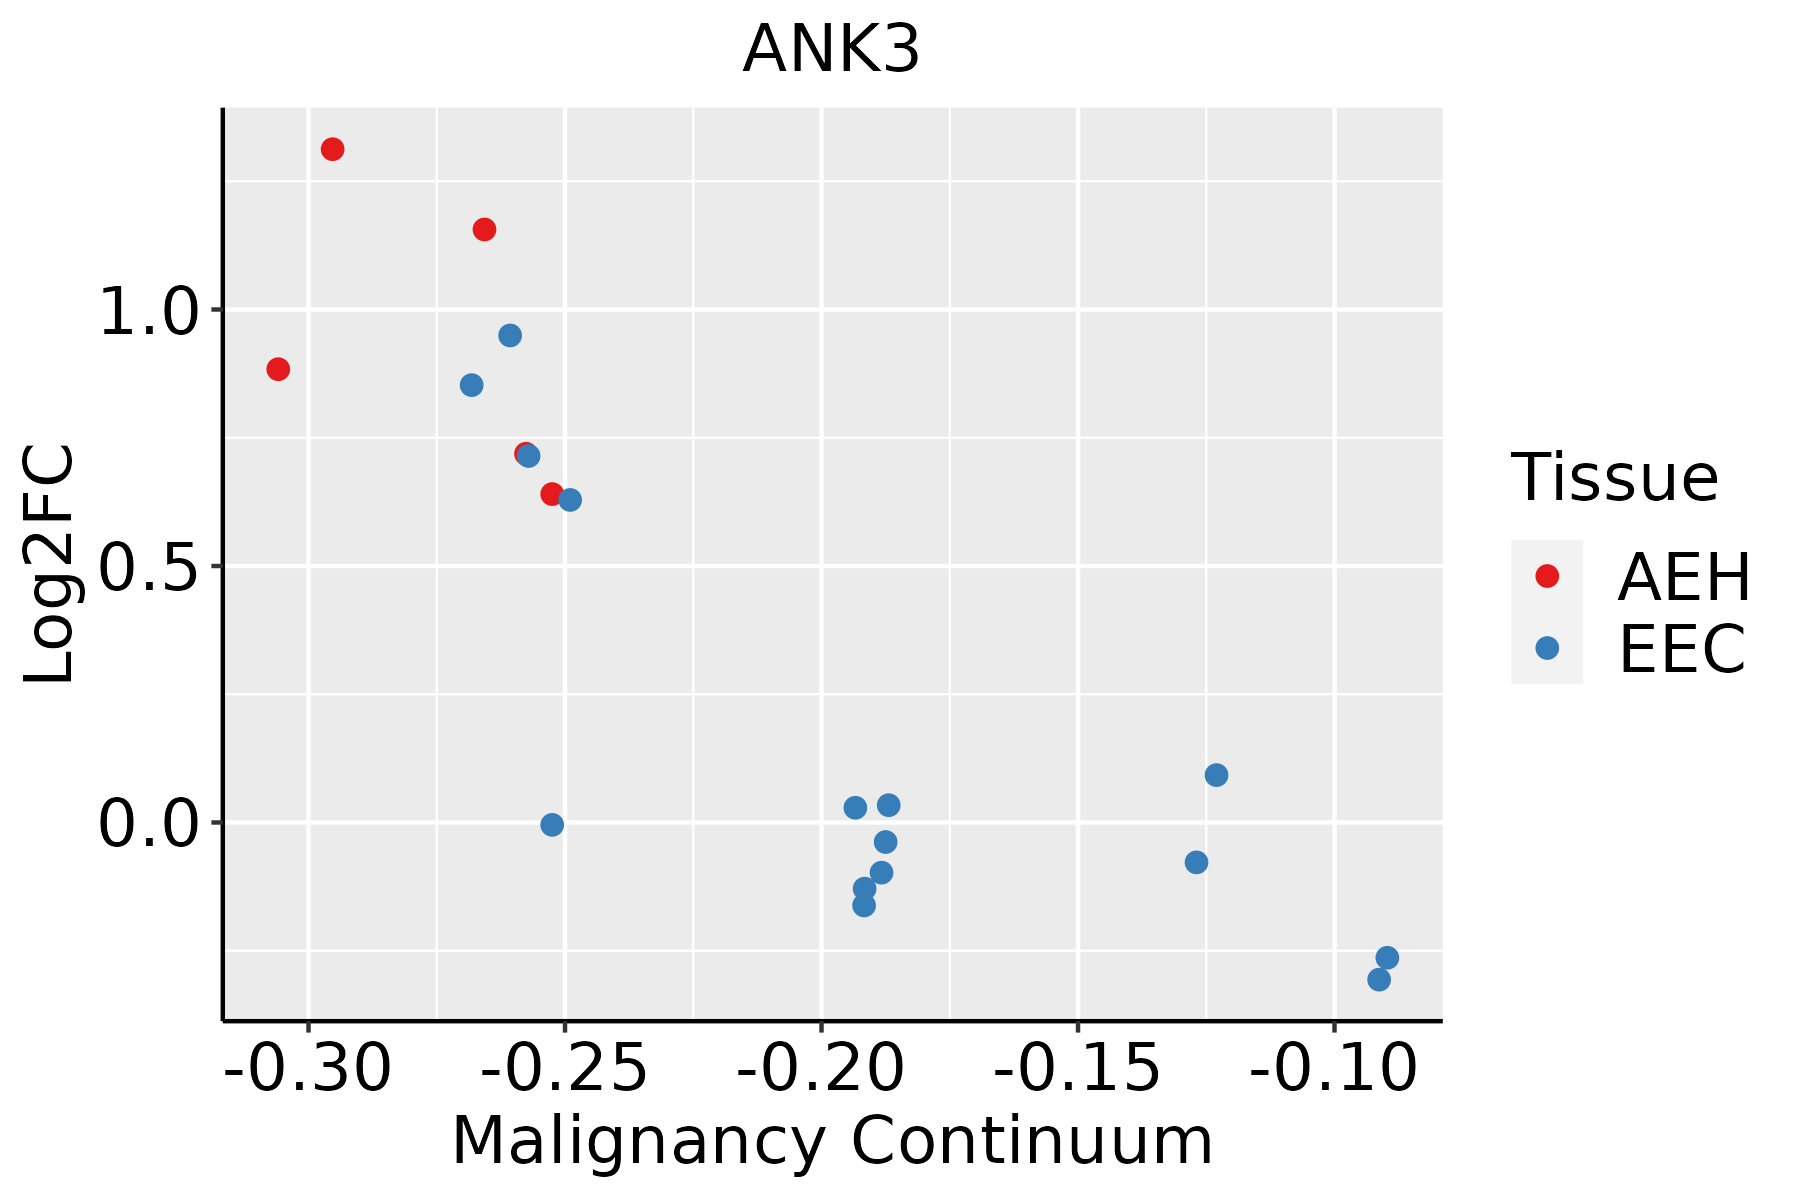 | AEH: Atypical endometrial hyperplasia |
| EEC: Endometrioid Cancer | ||
| Esophagus |  | ESCC: Esophageal squamous cell carcinoma |
| HGIN: High-grade intraepithelial neoplasias | ||
| LGIN: Low-grade intraepithelial neoplasias | ||
| Liver | 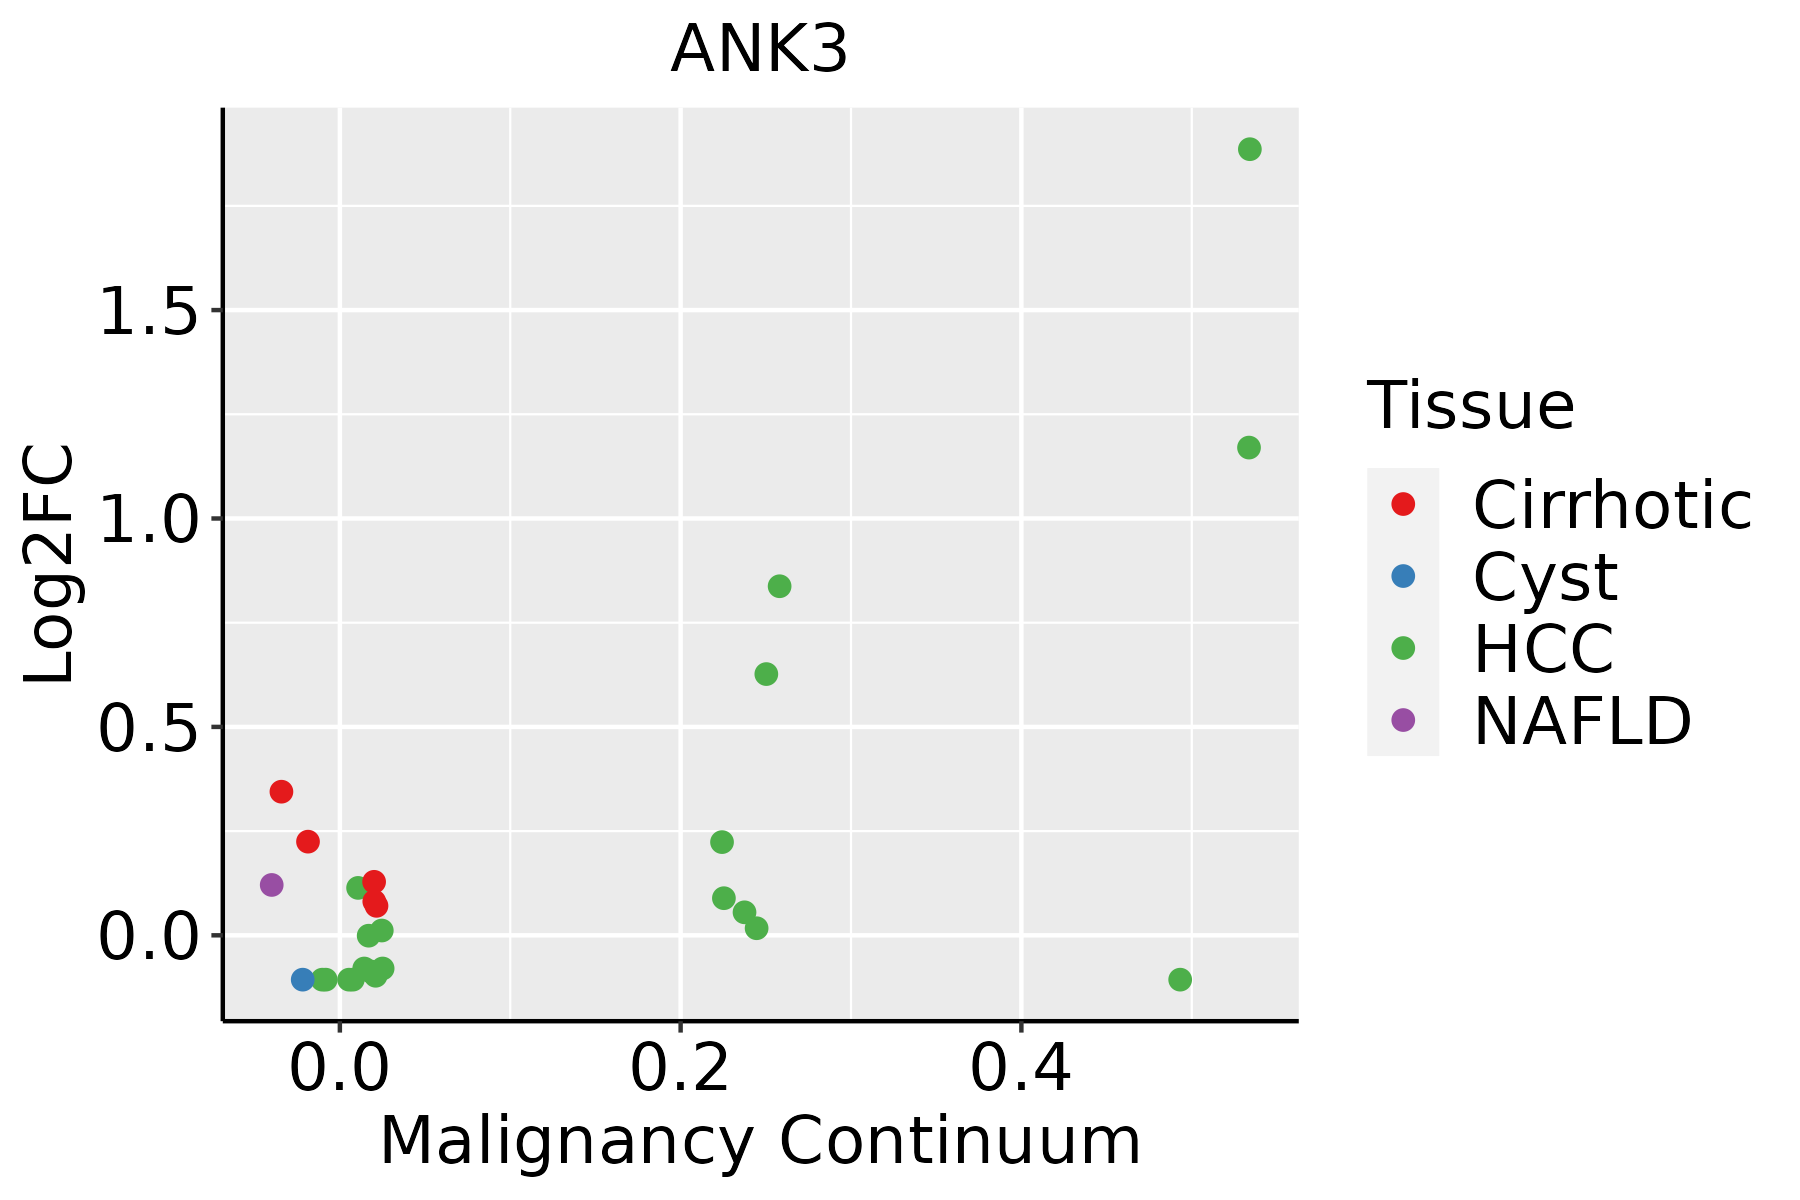 | HCC: Hepatocellular carcinoma |
| NAFLD: Non-alcoholic fatty liver disease | ||
| Lung |  | AAH: Atypical adenomatous hyperplasia |
| AIS: Adenocarcinoma in situ | ||
| IAC: Invasive lung adenocarcinoma | ||
| MIA: Minimally invasive adenocarcinoma | ||
| Oral Cavity |  | EOLP: Erosive Oral lichen planus |
| LP: leukoplakia | ||
| NEOLP: Non-erosive oral lichen planus | ||
| OSCC: Oral squamous cell carcinoma | ||
| Prostate | 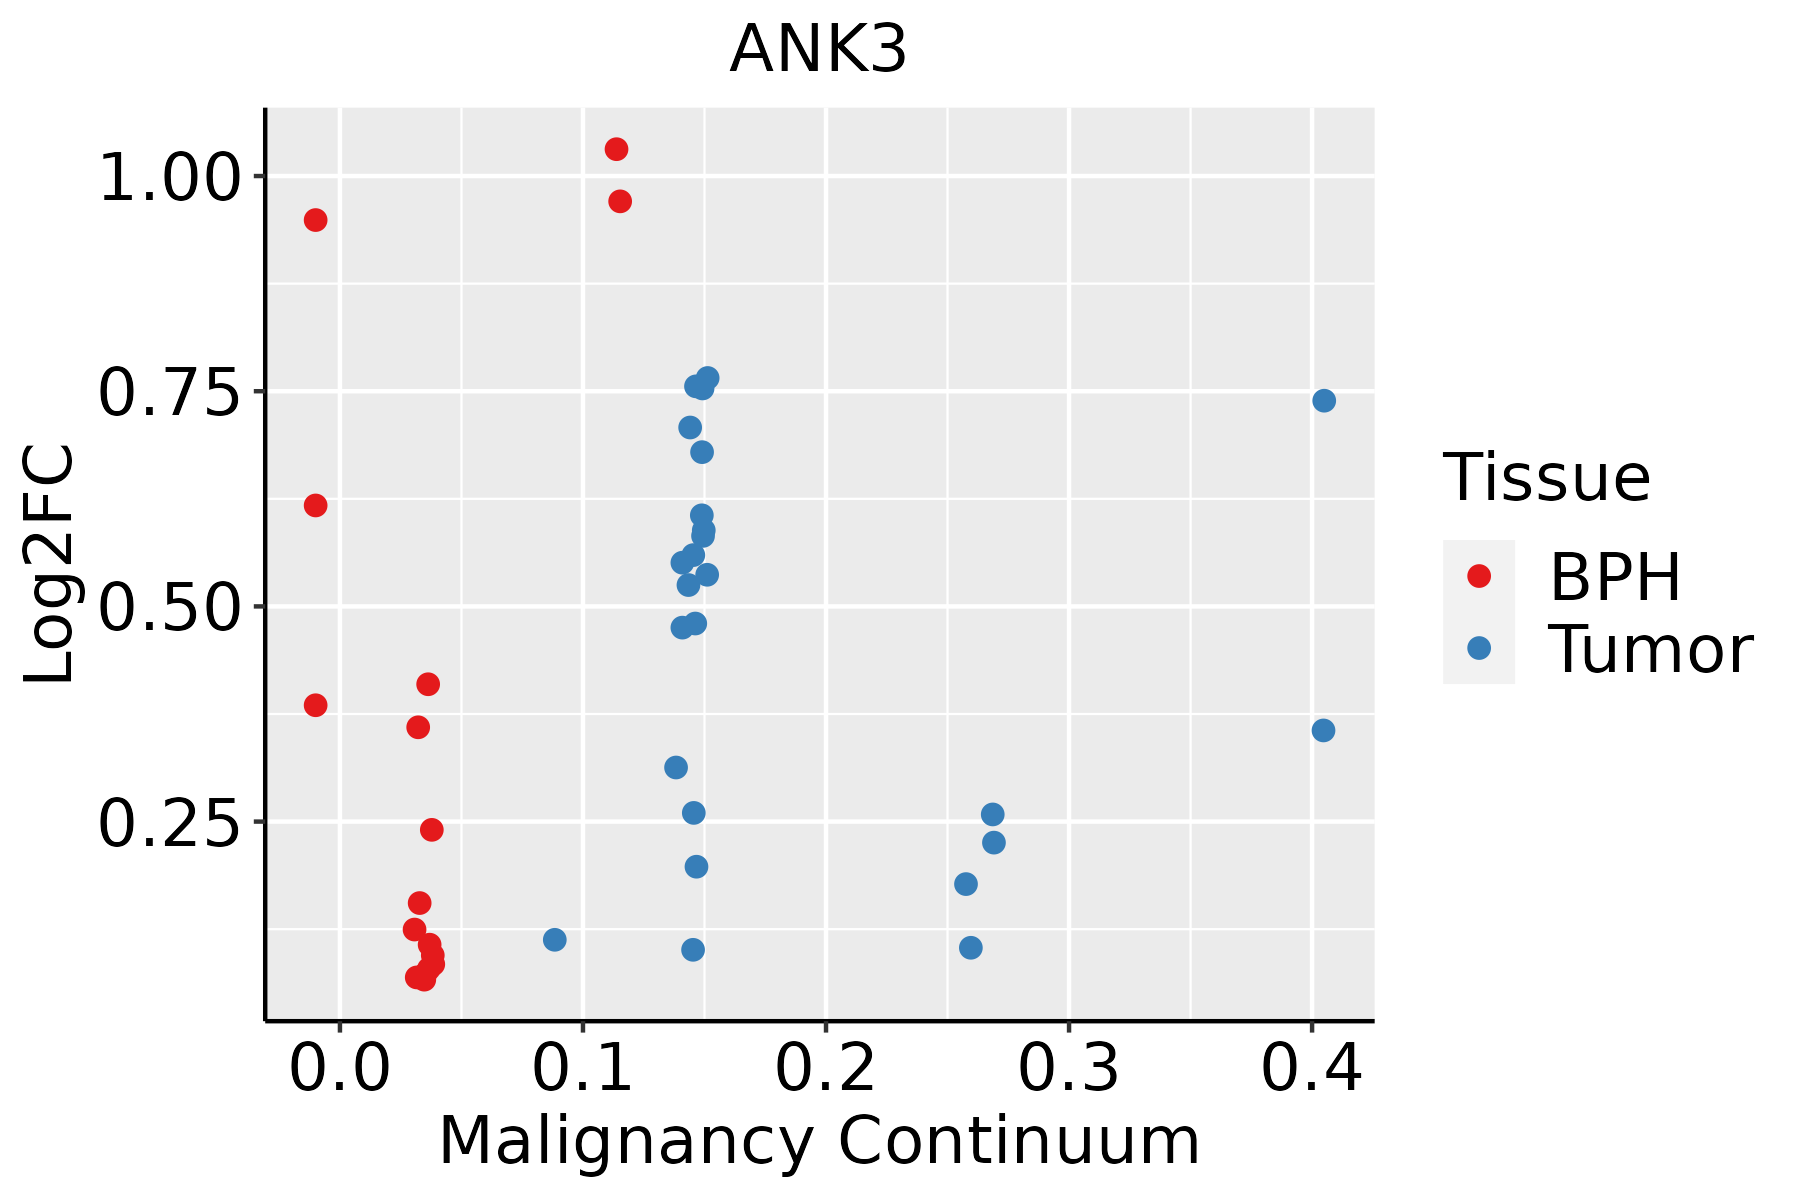 | BPH: Benign Prostatic Hyperplasia |
| Skin | 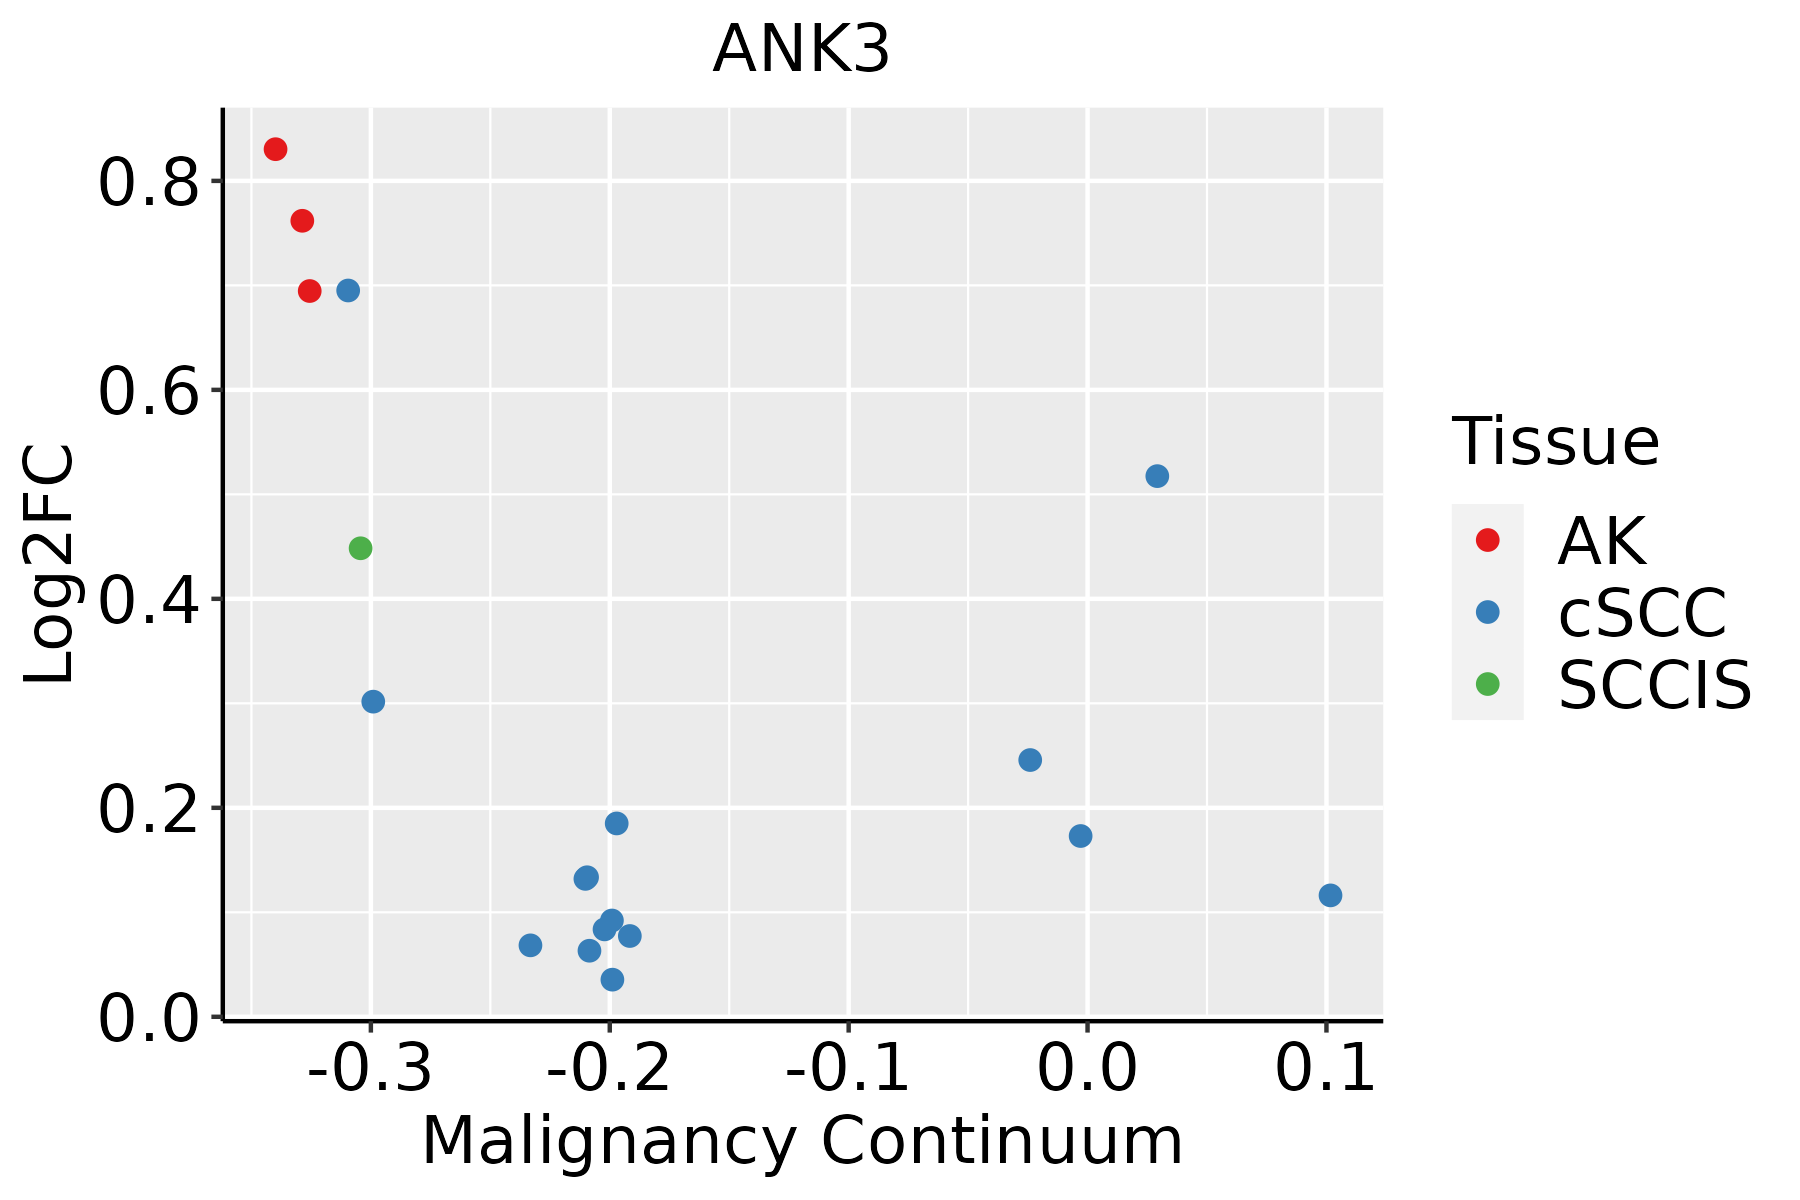 | AK: Actinic keratosis |
| cSCC: Cutaneous squamous cell carcinoma | ||
| SCCIS:squamous cell carcinoma in situ | ||
| Thyroid | 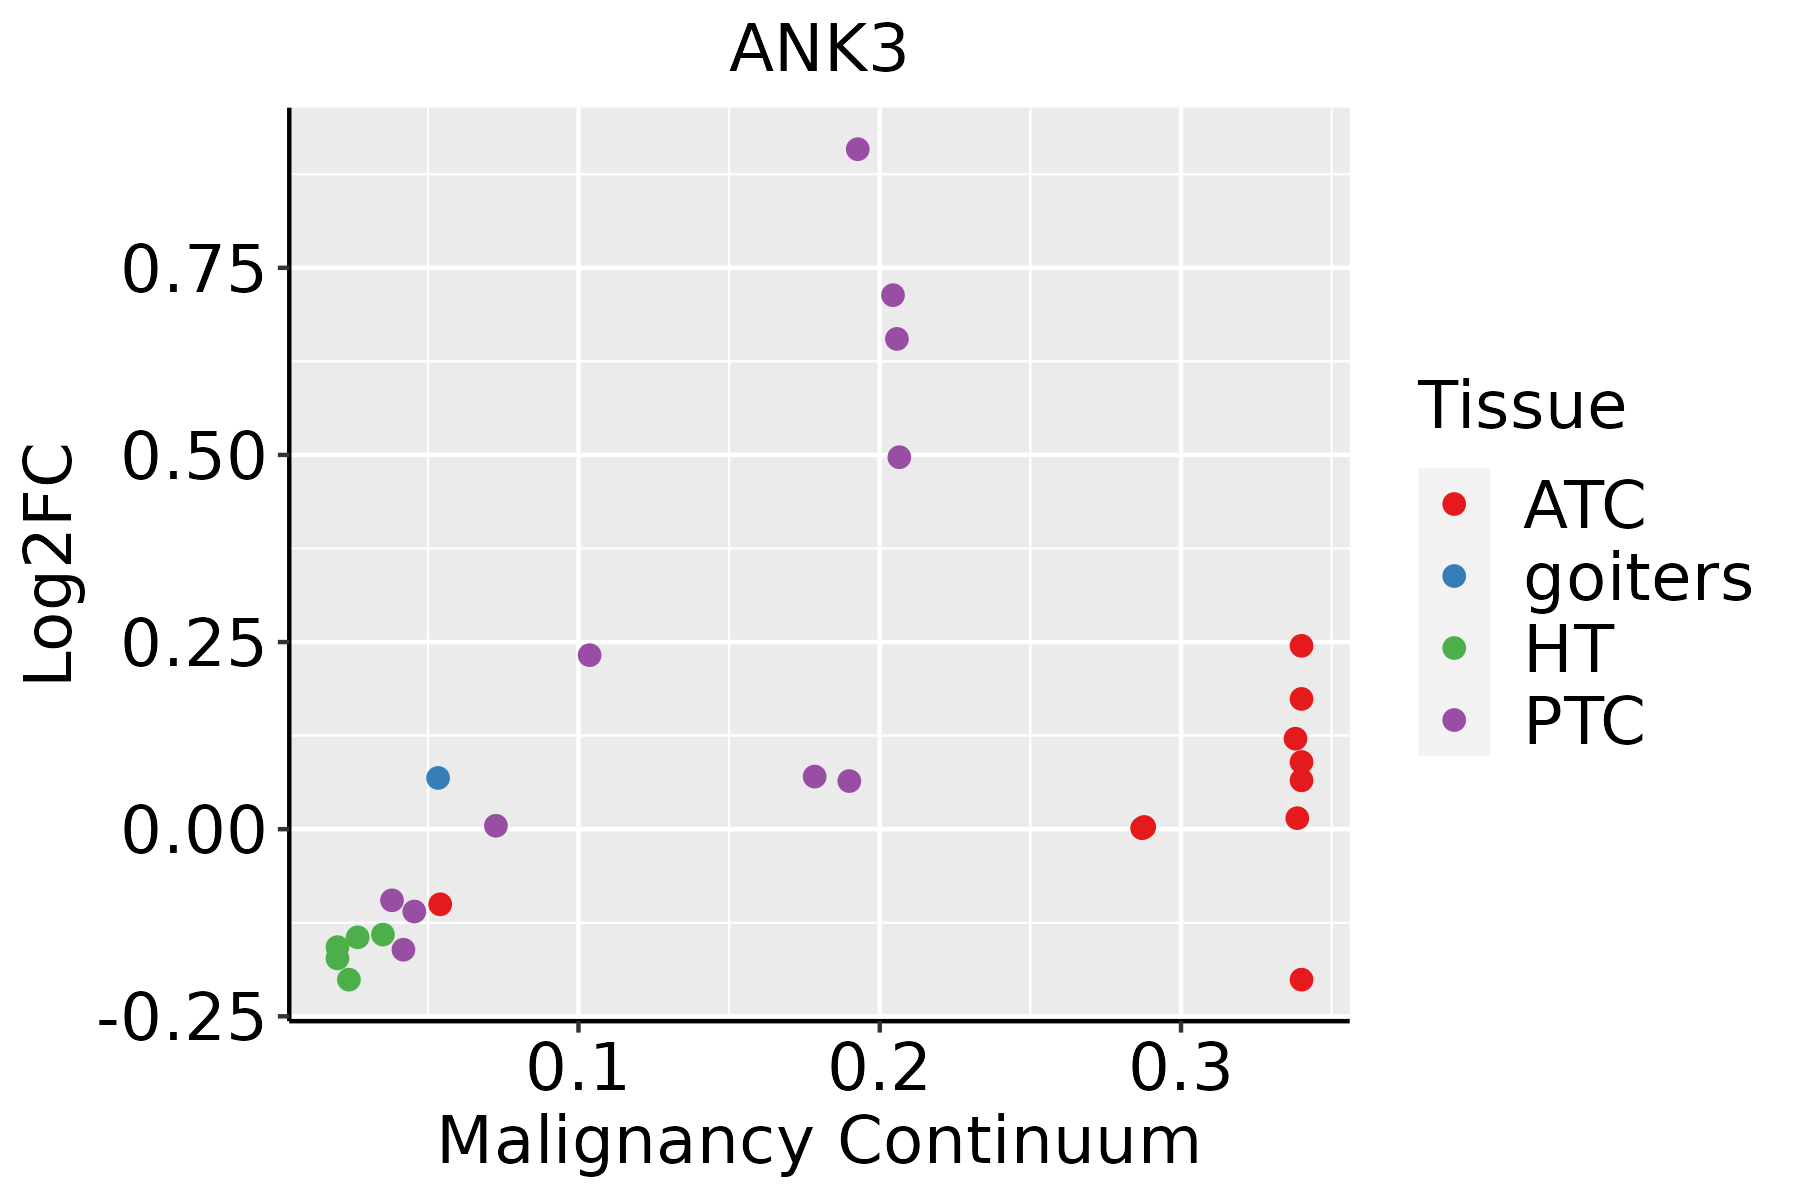 | ATC: Anaplastic thyroid cancer |
| HT: Hashimoto's thyroiditis | ||
| PTC: Papillary thyroid cancer |
| ∗log2FC in expression of this searched gene in stem-like cells from each diseased tissue sample relative to stem-like cells in normal samples in each tissue plotted against the malignancy continuum. Samples are colored based on if they are from different disease stage. |
Top |
Malignant transformation related pathway analysis |
| Find out the enriched GO biological processes and KEGG pathways involved in transition from healthy to precancer to cancer |
| Tissue | Disease Stage | Enriched GO biological Processes |
| Colorectum | AD |  |
| Colorectum | SER |  |
| Colorectum | MSS |  |
| Colorectum | MSI-H |  |
| Colorectum | FAP |  |
| ∗Top 15 enriched GO BP terms are showed in the bar plot of each disease state in each tissue. Each row represents a significant GO biological process which is colored according to the -log10(p.adjust). |
| Page: 1 2 3 4 5 6 7 8 9 |
| GO ID | Tissue | Disease Stage | Description | Gene Ratio | Bg Ratio | pvalue | p.adjust | Count |
| GO:00068938 | Oral cavity | OSCC | Golgi to plasma membrane transport | 41/7305 | 60/18723 | 3.98e-06 | 4.66e-05 | 41 |
| GO:00430018 | Oral cavity | OSCC | Golgi to plasma membrane protein transport | 30/7305 | 40/18723 | 4.03e-06 | 4.69e-05 | 30 |
| GO:001003820 | Oral cavity | OSCC | response to metal ion | 188/7305 | 373/18723 | 4.34e-06 | 5.00e-05 | 188 |
| GO:00988769 | Oral cavity | OSCC | vesicle-mediated transport to the plasma membrane | 79/7305 | 136/18723 | 4.93e-06 | 5.58e-05 | 79 |
| GO:19035337 | Oral cavity | OSCC | regulation of protein targeting | 51/7305 | 81/18723 | 1.08e-05 | 1.13e-04 | 51 |
| GO:00616405 | Oral cavity | OSCC | cytoskeleton-dependent cytokinesis | 60/7305 | 100/18723 | 1.69e-05 | 1.67e-04 | 60 |
| GO:002240718 | Oral cavity | OSCC | regulation of cell-cell adhesion | 218/7305 | 448/18723 | 1.71e-05 | 1.68e-04 | 218 |
| GO:00066123 | Oral cavity | OSCC | protein targeting to membrane | 75/7305 | 131/18723 | 1.72e-05 | 1.69e-04 | 75 |
| GO:003410919 | Oral cavity | OSCC | homotypic cell-cell adhesion | 55/7305 | 90/18723 | 1.78e-05 | 1.73e-04 | 55 |
| GO:000925919 | Oral cavity | OSCC | ribonucleotide metabolic process | 189/7305 | 385/18723 | 3.18e-05 | 2.87e-04 | 189 |
| GO:00619518 | Oral cavity | OSCC | establishment of protein localization to plasma membrane | 39/7305 | 60/18723 | 4.07e-05 | 3.53e-04 | 39 |
| GO:007252120 | Oral cavity | OSCC | purine-containing compound metabolic process | 199/7305 | 416/18723 | 1.34e-04 | 9.53e-04 | 199 |
| GO:000915020 | Oral cavity | OSCC | purine ribonucleotide metabolic process | 178/7305 | 368/18723 | 1.45e-04 | 1.02e-03 | 178 |
| GO:00440917 | Oral cavity | OSCC | membrane biogenesis | 35/7305 | 55/18723 | 1.88e-04 | 1.27e-03 | 35 |
| GO:00717098 | Oral cavity | OSCC | membrane assembly | 32/7305 | 50/18723 | 3.02e-04 | 1.89e-03 | 32 |
| GO:000616320 | Oral cavity | OSCC | purine nucleotide metabolic process | 188/7305 | 396/18723 | 3.31e-04 | 2.04e-03 | 188 |
| GO:00338663 | Oral cavity | OSCC | nucleoside bisphosphate biosynthetic process | 36/7305 | 60/18723 | 7.94e-04 | 4.27e-03 | 36 |
| GO:00340303 | Oral cavity | OSCC | ribonucleoside bisphosphate biosynthetic process | 36/7305 | 60/18723 | 7.94e-04 | 4.27e-03 | 36 |
| GO:00340333 | Oral cavity | OSCC | purine nucleoside bisphosphate biosynthetic process | 36/7305 | 60/18723 | 7.94e-04 | 4.27e-03 | 36 |
| GO:19012938 | Oral cavity | OSCC | nucleoside phosphate biosynthetic process | 125/7305 | 256/18723 | 8.32e-04 | 4.41e-03 | 125 |
| Page: 1 2 3 4 5 6 7 8 9 10 11 12 13 14 15 16 17 18 19 20 21 22 23 24 25 26 27 28 29 30 31 32 33 34 35 36 37 38 39 40 41 42 43 44 45 46 47 48 49 50 51 52 |
| Pathway ID | Tissue | Disease Stage | Description | Gene Ratio | Bg Ratio | pvalue | p.adjust | qvalue | Count |
| hsa0520516 | Cervix | CC | Proteoglycans in cancer | 60/1267 | 205/8465 | 9.13e-08 | 1.18e-06 | 7.00e-07 | 60 |
| hsa0520517 | Cervix | CC | Proteoglycans in cancer | 60/1267 | 205/8465 | 9.13e-08 | 1.18e-06 | 7.00e-07 | 60 |
| hsa05205 | Colorectum | AD | Proteoglycans in cancer | 70/2092 | 205/8465 | 1.37e-03 | 8.46e-03 | 5.39e-03 | 70 |
| hsa052051 | Colorectum | AD | Proteoglycans in cancer | 70/2092 | 205/8465 | 1.37e-03 | 8.46e-03 | 5.39e-03 | 70 |
| hsa052052 | Colorectum | SER | Proteoglycans in cancer | 58/1580 | 205/8465 | 4.37e-04 | 3.82e-03 | 2.77e-03 | 58 |
| hsa052053 | Colorectum | SER | Proteoglycans in cancer | 58/1580 | 205/8465 | 4.37e-04 | 3.82e-03 | 2.77e-03 | 58 |
| hsa052054 | Colorectum | MSS | Proteoglycans in cancer | 65/1875 | 205/8465 | 8.66e-04 | 5.38e-03 | 3.29e-03 | 65 |
| hsa052055 | Colorectum | MSS | Proteoglycans in cancer | 65/1875 | 205/8465 | 8.66e-04 | 5.38e-03 | 3.29e-03 | 65 |
| hsa052056 | Colorectum | FAP | Proteoglycans in cancer | 57/1404 | 205/8465 | 3.05e-05 | 3.29e-04 | 2.00e-04 | 57 |
| hsa052057 | Colorectum | FAP | Proteoglycans in cancer | 57/1404 | 205/8465 | 3.05e-05 | 3.29e-04 | 2.00e-04 | 57 |
| hsa0520518 | Endometrium | AEH | Proteoglycans in cancer | 53/1197 | 205/8465 | 5.43e-06 | 6.53e-05 | 4.78e-05 | 53 |
| hsa0520519 | Endometrium | AEH | Proteoglycans in cancer | 53/1197 | 205/8465 | 5.43e-06 | 6.53e-05 | 4.78e-05 | 53 |
| hsa0520524 | Endometrium | EEC | Proteoglycans in cancer | 52/1237 | 205/8465 | 3.01e-05 | 3.19e-04 | 2.38e-04 | 52 |
| hsa0520534 | Endometrium | EEC | Proteoglycans in cancer | 52/1237 | 205/8465 | 3.01e-05 | 3.19e-04 | 2.38e-04 | 52 |
| hsa0520529 | Esophagus | ESCC | Proteoglycans in cancer | 138/4205 | 205/8465 | 1.79e-07 | 1.40e-06 | 7.15e-07 | 138 |
| hsa0520537 | Esophagus | ESCC | Proteoglycans in cancer | 138/4205 | 205/8465 | 1.79e-07 | 1.40e-06 | 7.15e-07 | 138 |
| hsa0520510 | Liver | Cirrhotic | Proteoglycans in cancer | 85/2530 | 205/8465 | 2.37e-04 | 1.58e-03 | 9.75e-04 | 85 |
| hsa0520511 | Liver | Cirrhotic | Proteoglycans in cancer | 85/2530 | 205/8465 | 2.37e-04 | 1.58e-03 | 9.75e-04 | 85 |
| hsa0520521 | Liver | HCC | Proteoglycans in cancer | 121/4020 | 205/8465 | 5.22e-04 | 2.18e-03 | 1.21e-03 | 121 |
| hsa0520531 | Liver | HCC | Proteoglycans in cancer | 121/4020 | 205/8465 | 5.22e-04 | 2.18e-03 | 1.21e-03 | 121 |
| Page: 1 2 |
Top |
Cell-cell communication analysis |
| Identification of potential cell-cell interactions between two cell types and their ligand-receptor pairs for different disease states |
| Ligand | Receptor | LRpair | Pathway | Tissue | Disease Stage |
| Page: 1 |
Top |
Single-cell gene regulatory network inference analysis |
| Find out the significant the regulons (TFs) and the target genes of each regulon across cell types for different disease states |
| TF | Cell Type | Tissue | Disease Stage | Target Gene | RSS | Regulon Activity |
| ∗The dot plots of a searched regulon are shown for all cell subpopulations in each disease state of each tissue based on the regulon specific score inferred using pySCENIC and by calculating the average expression. |
| Page: 1 |
Top |
Somatic mutation of malignant transformation related genes |
| Annotation of somatic variants for genes involved in malignant transformation |
| Hugo Symbol | Variant Class | Variant Classification | dbSNP RS | HGVSc | HGVSp | HGVSp Short | SWISSPROT | BIOTYPE | SIFT | PolyPhen | Tumor Sample Barcode | Tissue | Histology | Sex | Age | Stage | Therapy Types | Drugs | Outcome |
| ANK3 | SNV | Missense_Mutation | rs777939067 | c.5788N>G | p.Gln1930Glu | p.Q1930E | Q12955 | protein_coding | tolerated_low_confidence(0.1) | benign(0.015) | TCGA-A1-A0SD-01 | Breast | breast invasive carcinoma | Female | <65 | I/II | Unknown | Unknown | SD |
| ANK3 | SNV | Missense_Mutation | c.1214N>G | p.His405Arg | p.H405R | Q12955 | protein_coding | deleterious(0) | probably_damaging(0.998) | TCGA-A1-A0SH-01 | Breast | breast invasive carcinoma | Female | <65 | I/II | Chemotherapy | tc | SD | |
| ANK3 | SNV | Missense_Mutation | novel | c.10281G>T | p.Leu3427Phe | p.L3427F | Q12955 | protein_coding | deleterious_low_confidence(0) | probably_damaging(0.996) | TCGA-A8-A076-01 | Breast | breast invasive carcinoma | Female | >=65 | I/II | Hormone Therapy | anastrozole | SD |
| ANK3 | SNV | Missense_Mutation | novel | c.2210N>C | p.Gly737Ala | p.G737A | Q12955 | protein_coding | tolerated(1) | benign(0.04) | TCGA-A8-A095-01 | Breast | breast invasive carcinoma | Female | <65 | I/II | Chemotherapy | 5-fluorouracil | CR |
| ANK3 | SNV | Missense_Mutation | c.7786N>T | p.Arg2596Cys | p.R2596C | Q12955 | protein_coding | deleterious_low_confidence(0) | probably_damaging(0.996) | TCGA-AN-A046-01 | Breast | breast invasive carcinoma | Female | >=65 | I/II | Unknown | Unknown | SD | |
| ANK3 | SNV | Missense_Mutation | c.7543N>A | p.Leu2515Ile | p.L2515I | Q12955 | protein_coding | deleterious_low_confidence(0.03) | benign(0.086) | TCGA-AN-A046-01 | Breast | breast invasive carcinoma | Female | >=65 | I/II | Unknown | Unknown | SD | |
| ANK3 | SNV | Missense_Mutation | novel | c.4964N>A | p.Ser1655Tyr | p.S1655Y | Q12955 | protein_coding | deleterious_low_confidence(0) | possibly_damaging(0.603) | TCGA-AN-A046-01 | Breast | breast invasive carcinoma | Female | >=65 | I/II | Unknown | Unknown | SD |
| ANK3 | SNV | Missense_Mutation | novel | c.3794N>A | p.Pro1265His | p.P1265H | Q12955 | protein_coding | deleterious(0) | possibly_damaging(0.879) | TCGA-AN-A046-01 | Breast | breast invasive carcinoma | Female | >=65 | I/II | Unknown | Unknown | SD |
| ANK3 | SNV | Missense_Mutation | rs775705277 | c.2756N>T | p.Ser919Leu | p.S919L | Q12955 | protein_coding | deleterious(0.01) | probably_damaging(0.992) | TCGA-AN-A046-01 | Breast | breast invasive carcinoma | Female | >=65 | I/II | Unknown | Unknown | SD |
| ANK3 | SNV | Missense_Mutation | novel | c.11339A>C | p.Asp3780Ala | p.D3780A | Q12955 | protein_coding | deleterious_low_confidence(0) | benign(0.006) | TCGA-AO-A128-01 | Breast | breast invasive carcinoma | Female | <65 | I/II | Chemotherapy | doxorubicin | SD |
| Page: 1 2 3 4 5 6 7 8 9 10 11 12 13 14 15 16 17 18 19 20 21 22 23 24 25 26 27 28 29 30 31 32 33 34 35 36 37 38 39 40 41 42 43 44 45 46 47 48 49 |
Top |
Related drugs of malignant transformation related genes |
| Identification of chemicals and drugs interact with genes involved in malignant transfromation |
| (DGIdb 4.0) |
| Entrez ID | Symbol | Category | Interaction Types | Drug Claim Name | Drug Name | PMIDs |
| Page: 1 |

Copyright 2023-Present -The University of Texas Health Science Center at Houston |