
|
|||||
|
 | |
| |
| |
| |
| |
| |
|
Gene: AK3 |
Gene summary for AK3 |
| Gene information | Species | Human | Gene symbol | AK3 | Gene ID | 50808 |
| Gene name | adenylate kinase 3 | |
| Gene Alias | AK3L1 | |
| Cytomap | 9p24.1 | |
| Gene Type | protein-coding | GO ID | GO:0006139 | UniProtAcc | Q7Z4Y4 |
Top |
Malignant transformation analysis |
| Identification of the aberrant gene expression in precancerous and cancerous lesions by comparing the gene expression of stem-like cells in diseased tissues with normal stem cells |
| Entrez ID | Symbol | Replicates | Species | Organ | Tissue | Adj P-value | Log2FC | Malignancy |
| 50808 | AK3 | HTA11_3410_2000001011 | Human | Colorectum | AD | 1.56e-10 | -4.96e-01 | 0.0155 |
| 50808 | AK3 | HTA11_347_2000001011 | Human | Colorectum | AD | 1.84e-12 | 6.58e-01 | -0.1954 |
| 50808 | AK3 | HTA11_99999965104_69814 | Human | Colorectum | MSS | 8.62e-11 | 9.83e-01 | 0.281 |
| 50808 | AK3 | A001-C-207 | Human | Colorectum | FAP | 9.64e-03 | -1.41e-01 | 0.1278 |
| 50808 | AK3 | A015-C-203 | Human | Colorectum | FAP | 5.10e-30 | 1.10e-03 | -0.1294 |
| 50808 | AK3 | A015-C-204 | Human | Colorectum | FAP | 1.59e-04 | -2.18e-01 | -0.0228 |
| 50808 | AK3 | A014-C-040 | Human | Colorectum | FAP | 7.34e-05 | -4.12e-01 | -0.1184 |
| 50808 | AK3 | A002-C-201 | Human | Colorectum | FAP | 6.66e-10 | -1.98e-01 | 0.0324 |
| 50808 | AK3 | A002-C-203 | Human | Colorectum | FAP | 3.24e-03 | -5.46e-02 | 0.2786 |
| 50808 | AK3 | A001-C-119 | Human | Colorectum | FAP | 2.55e-04 | -1.54e-01 | -0.1557 |
| 50808 | AK3 | A001-C-108 | Human | Colorectum | FAP | 1.02e-15 | -1.60e-01 | -0.0272 |
| 50808 | AK3 | A002-C-205 | Human | Colorectum | FAP | 1.20e-22 | -2.14e-01 | -0.1236 |
| 50808 | AK3 | A015-C-005 | Human | Colorectum | FAP | 2.74e-02 | -2.10e-01 | -0.0336 |
| 50808 | AK3 | A015-C-006 | Human | Colorectum | FAP | 4.14e-16 | -2.43e-01 | -0.0994 |
| 50808 | AK3 | A015-C-106 | Human | Colorectum | FAP | 8.21e-12 | -1.32e-03 | -0.0511 |
| 50808 | AK3 | A002-C-114 | Human | Colorectum | FAP | 3.65e-18 | -2.23e-01 | -0.1561 |
| 50808 | AK3 | A015-C-104 | Human | Colorectum | FAP | 6.02e-33 | -3.61e-03 | -0.1899 |
| 50808 | AK3 | A015-C-202 | Human | Colorectum | FAP | 2.06e-03 | 3.31e-01 | -0.0849 |
| 50808 | AK3 | A001-C-014 | Human | Colorectum | FAP | 1.12e-14 | -2.71e-01 | 0.0135 |
| 50808 | AK3 | A002-C-016 | Human | Colorectum | FAP | 2.89e-21 | -2.19e-01 | 0.0521 |
| Page: 1 2 3 4 5 6 7 8 |
| Tissue | Expression Dynamics | Abbreviation |
| Colorectum (GSE201348) |  | FAP: Familial adenomatous polyposis |
| CRC: Colorectal cancer | ||
| Colorectum (HTA11) |  | AD: Adenomas |
| SER: Sessile serrated lesions | ||
| MSI-H: Microsatellite-high colorectal cancer | ||
| MSS: Microsatellite stable colorectal cancer | ||
| Esophagus |  | ESCC: Esophageal squamous cell carcinoma |
| HGIN: High-grade intraepithelial neoplasias | ||
| LGIN: Low-grade intraepithelial neoplasias | ||
| Liver | 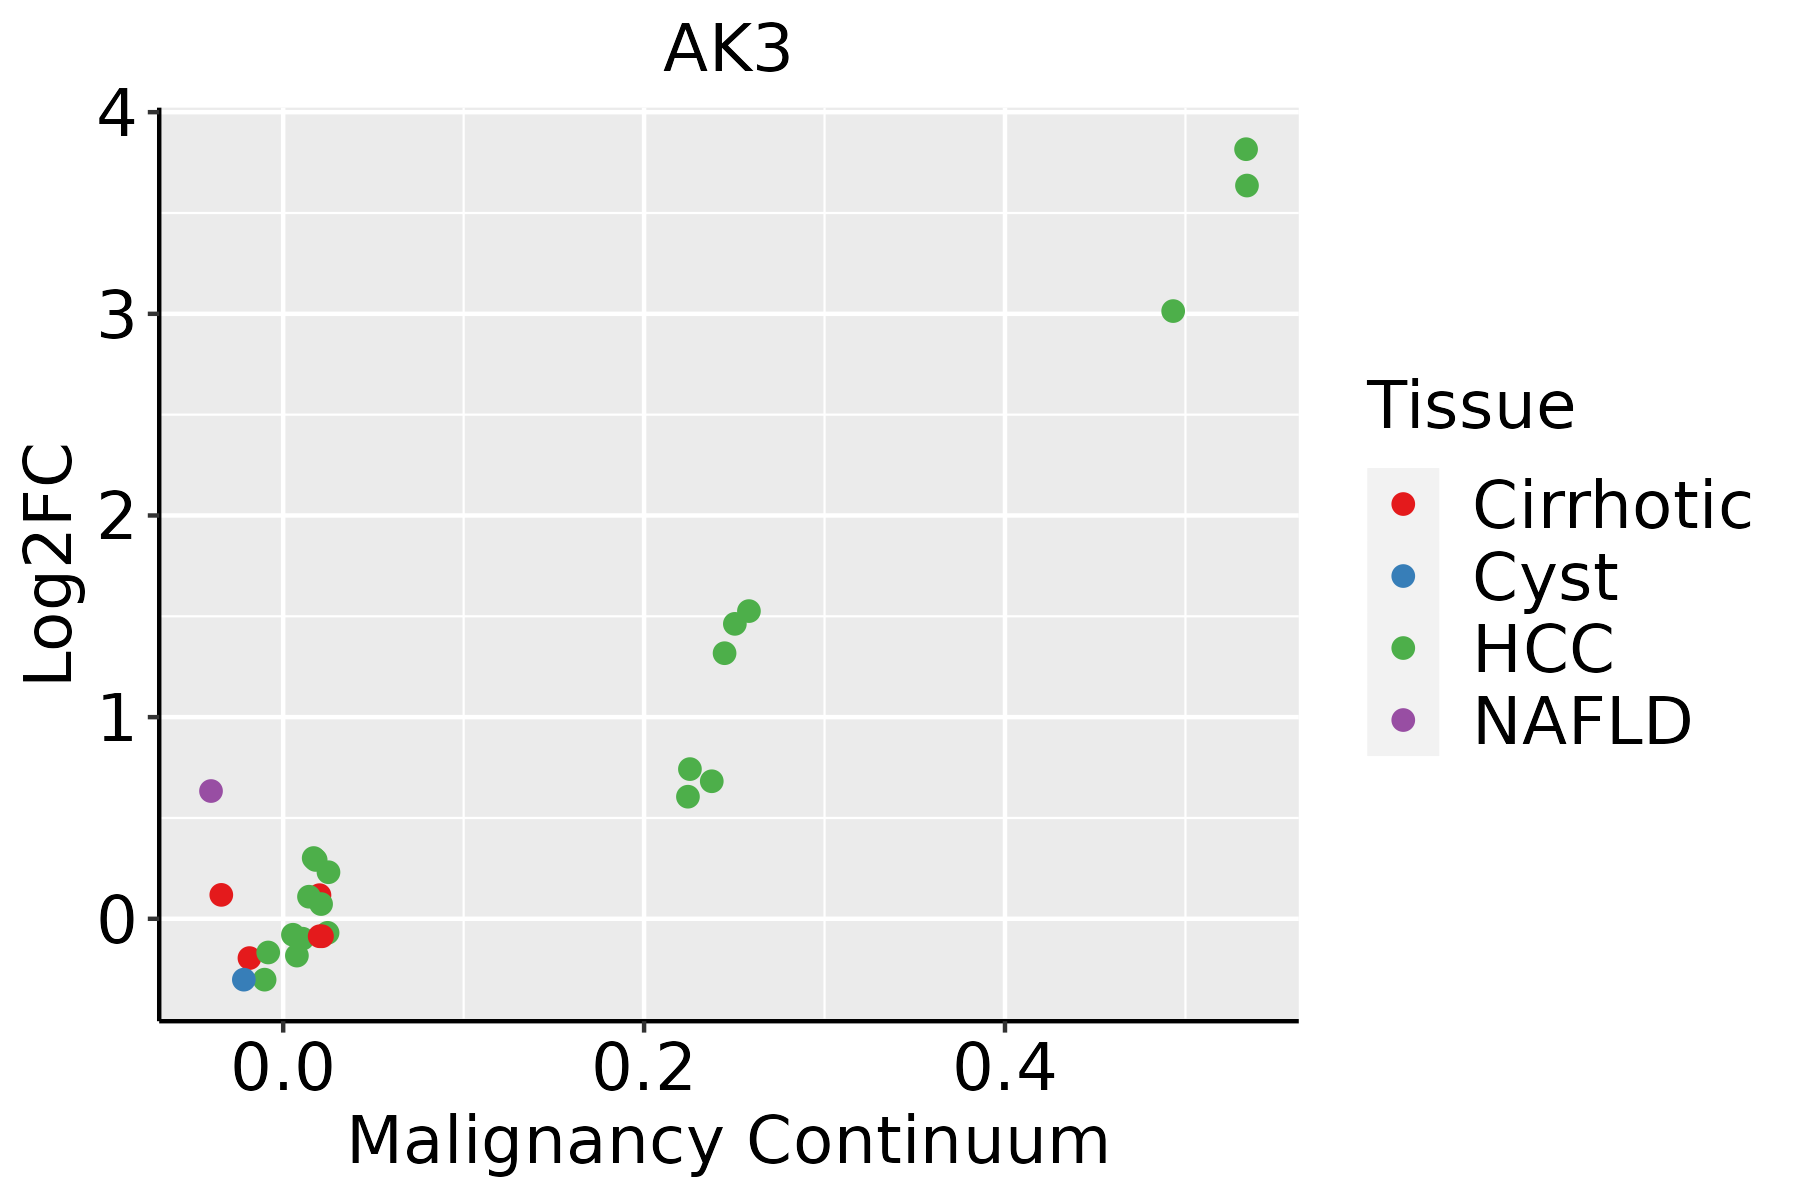 | HCC: Hepatocellular carcinoma |
| NAFLD: Non-alcoholic fatty liver disease | ||
| Oral Cavity |  | EOLP: Erosive Oral lichen planus |
| LP: leukoplakia | ||
| NEOLP: Non-erosive oral lichen planus | ||
| OSCC: Oral squamous cell carcinoma | ||
| Prostate | 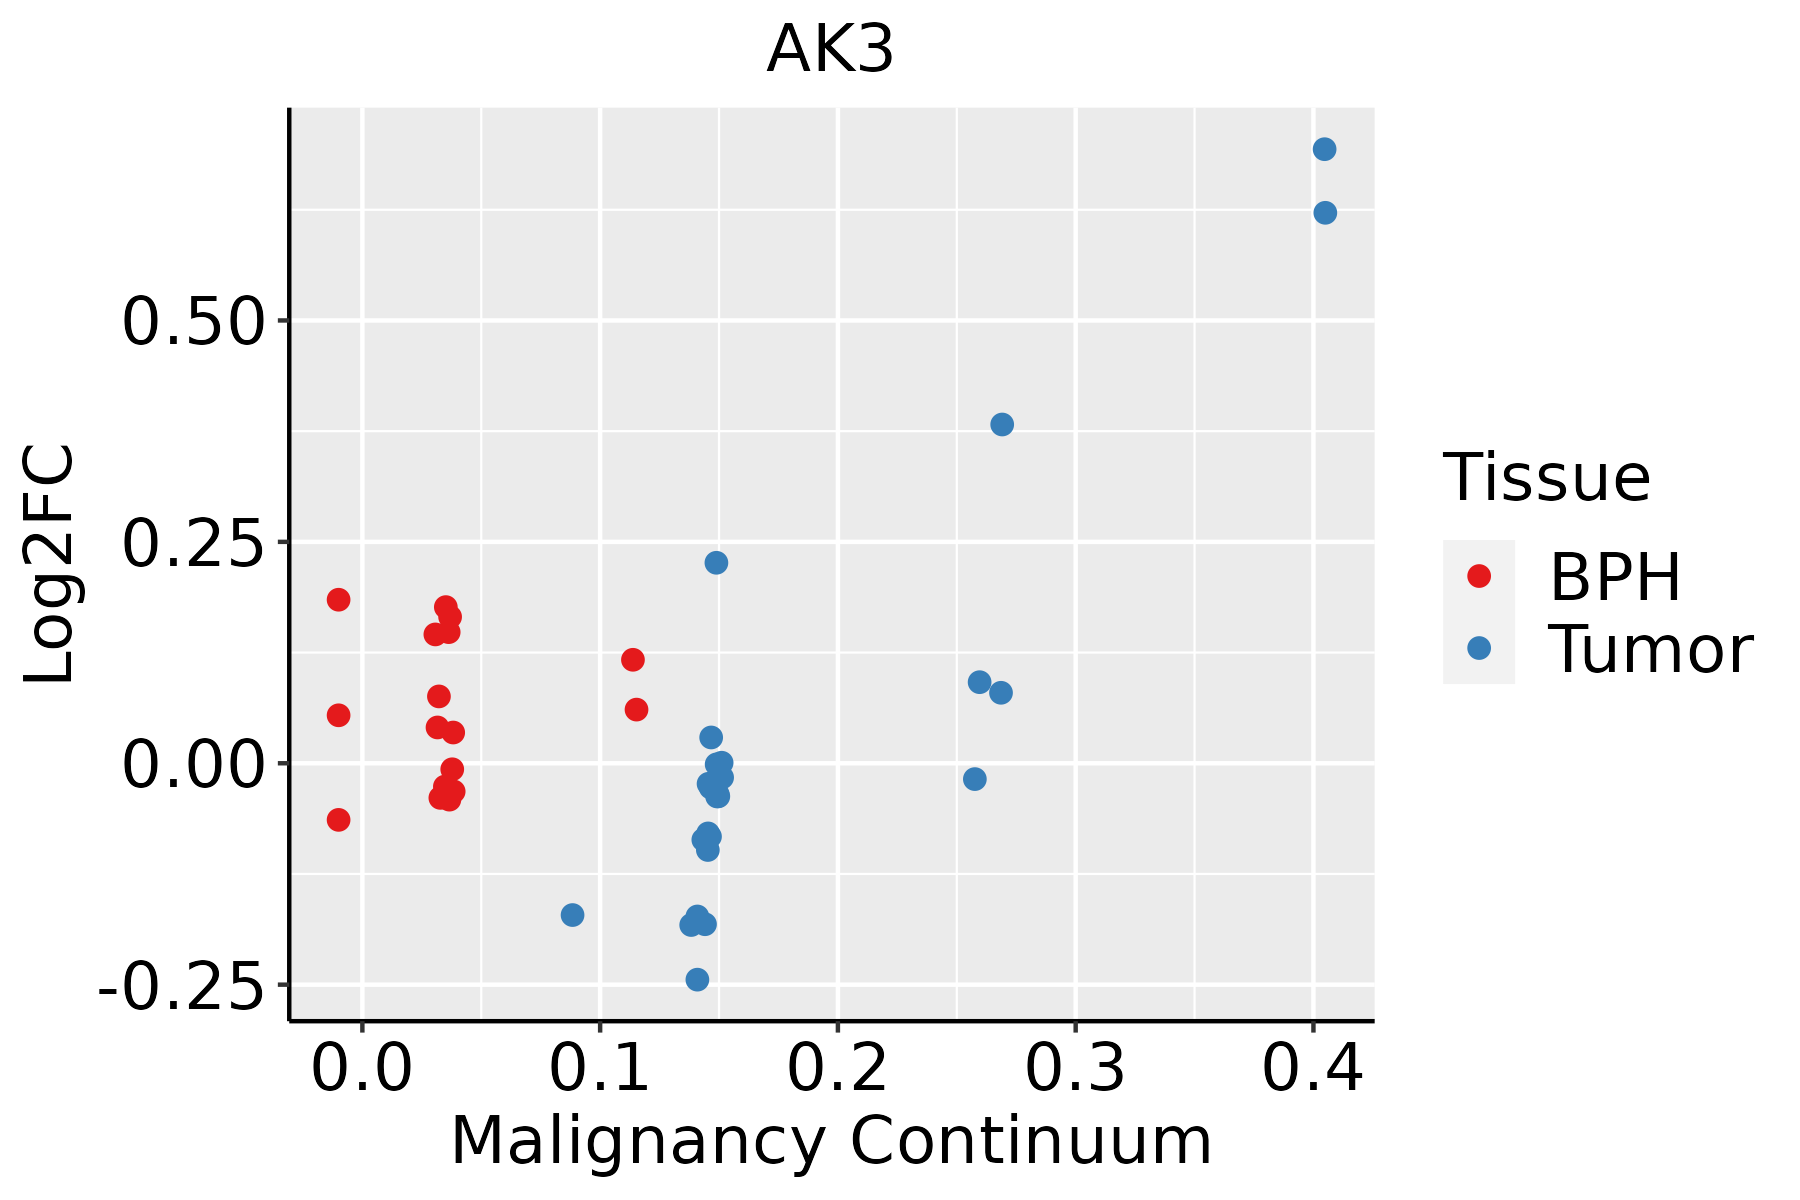 | BPH: Benign Prostatic Hyperplasia |
| Skin | 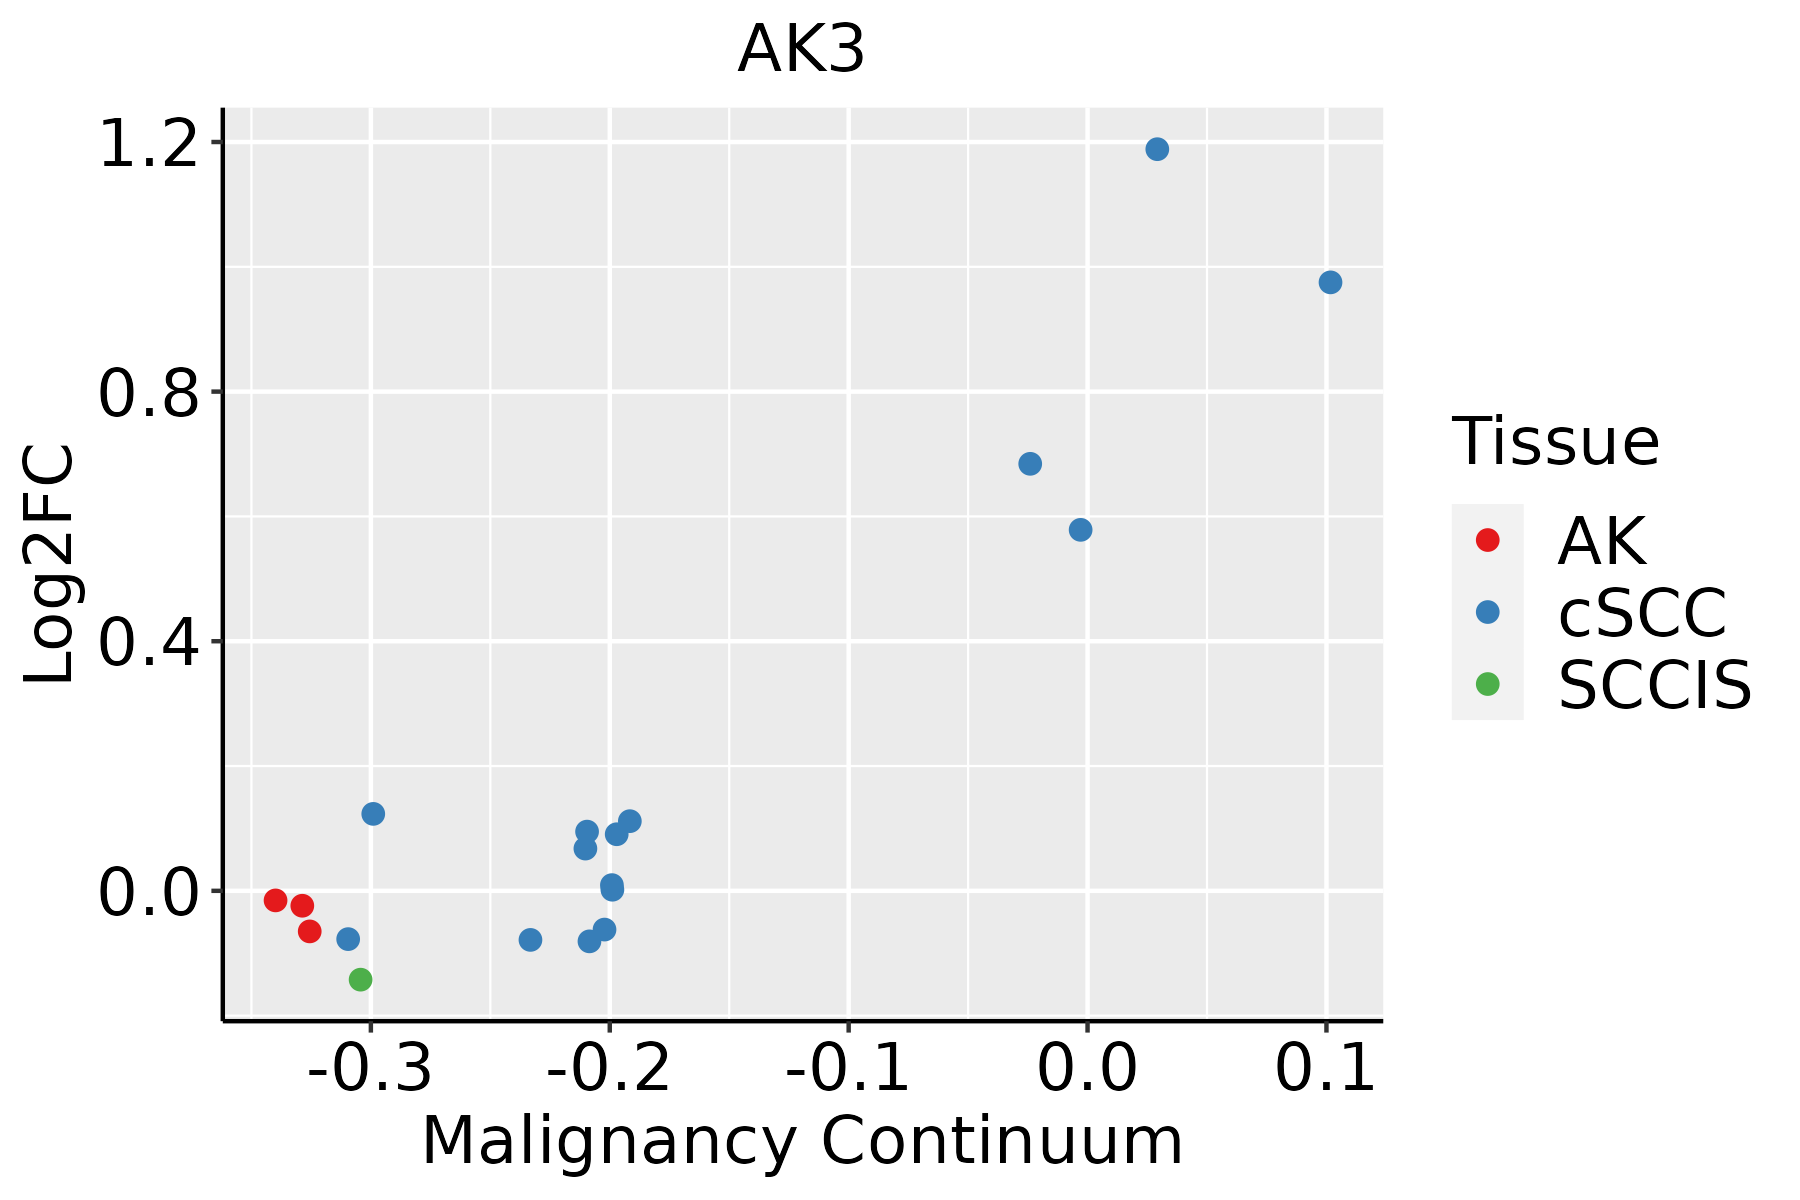 | AK: Actinic keratosis |
| cSCC: Cutaneous squamous cell carcinoma | ||
| SCCIS:squamous cell carcinoma in situ | ||
| Thyroid | 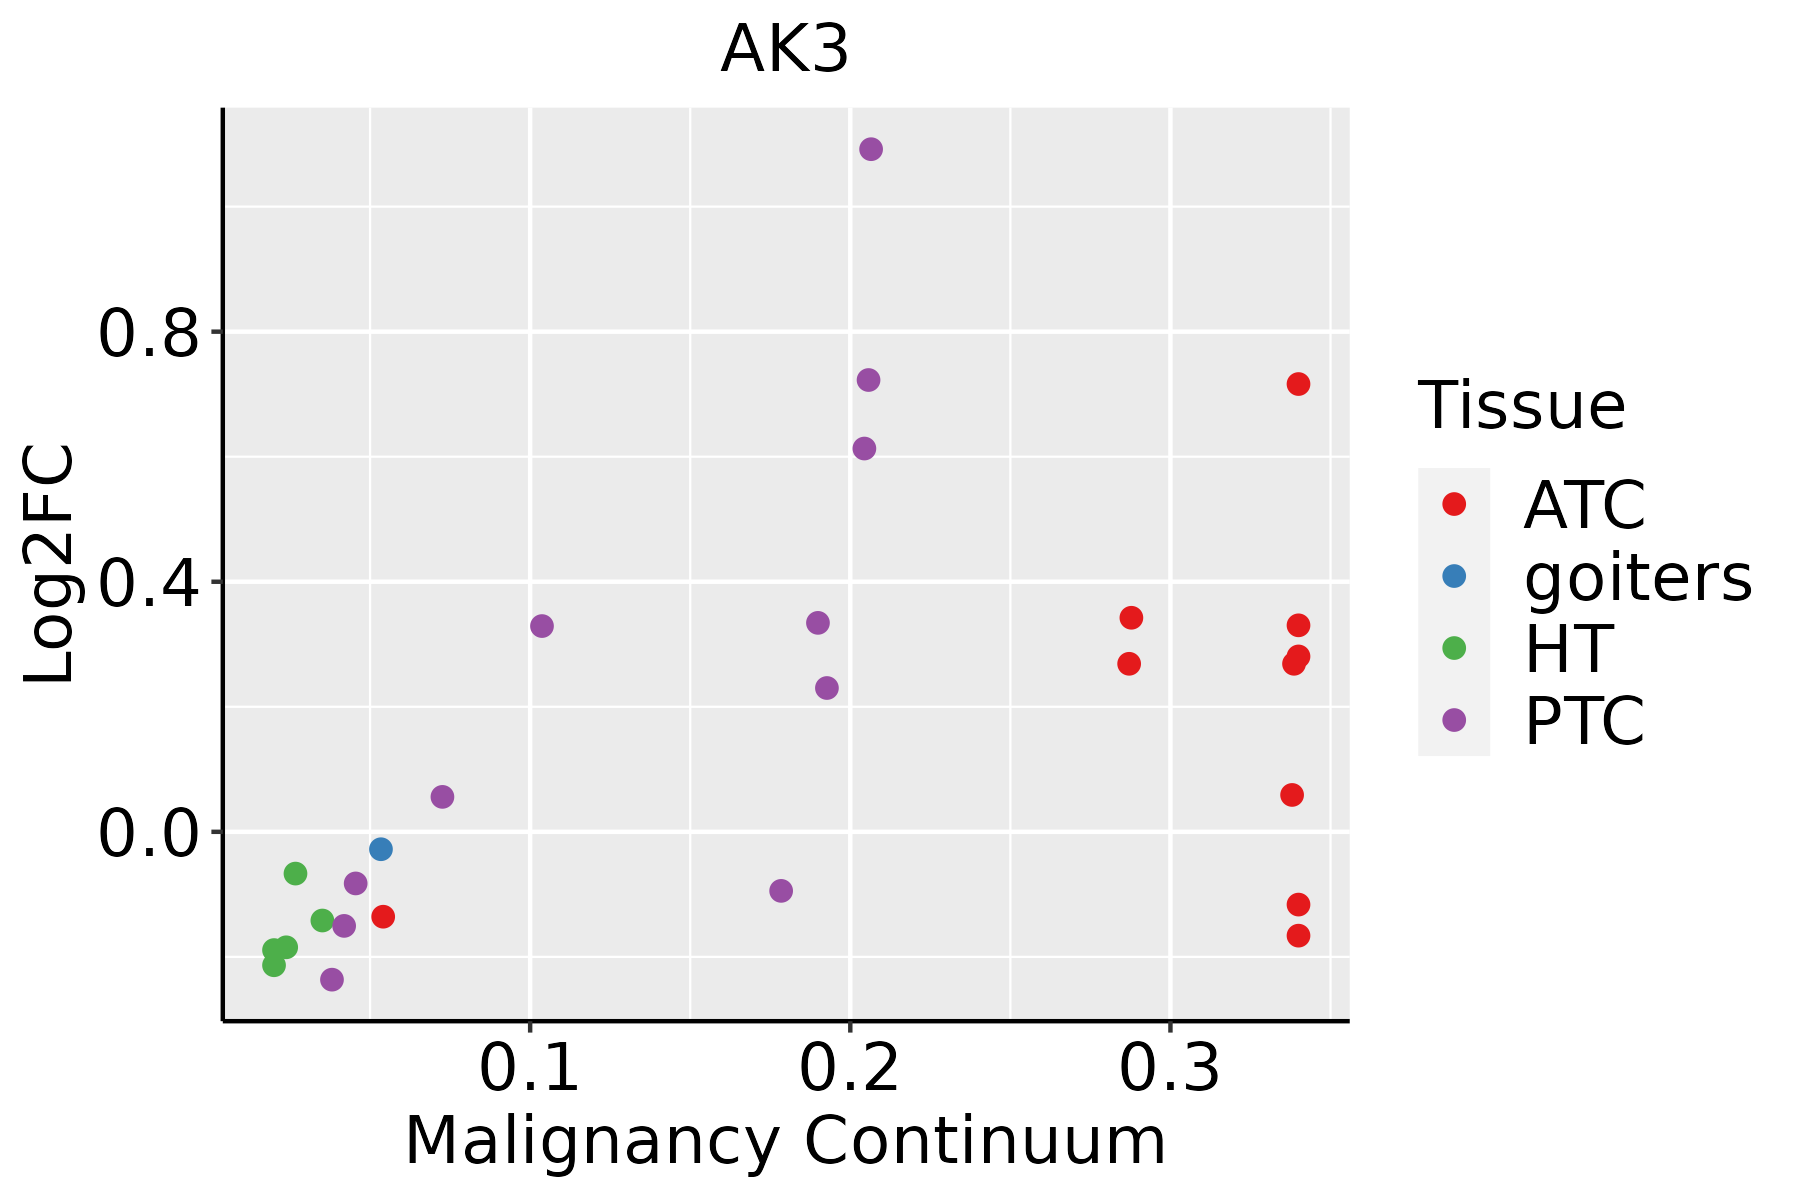 | ATC: Anaplastic thyroid cancer |
| HT: Hashimoto's thyroiditis | ||
| PTC: Papillary thyroid cancer |
| ∗log2FC in expression of this searched gene in stem-like cells from each diseased tissue sample relative to stem-like cells in normal samples in each tissue plotted against the malignancy continuum. Samples are colored based on if they are from different disease stage. |
Top |
Malignant transformation related pathway analysis |
| Find out the enriched GO biological processes and KEGG pathways involved in transition from healthy to precancer to cancer |
| Tissue | Disease Stage | Enriched GO biological Processes |
| Colorectum | AD |  |
| Colorectum | SER |  |
| Colorectum | MSS |  |
| Colorectum | MSI-H |  |
| Colorectum | FAP |  |
| ∗Top 15 enriched GO BP terms are showed in the bar plot of each disease state in each tissue. Each row represents a significant GO biological process which is colored according to the -log10(p.adjust). |
| Page: 1 2 3 4 5 6 7 8 9 |
| GO ID | Tissue | Disease Stage | Description | Gene Ratio | Bg Ratio | pvalue | p.adjust | Count |
| GO:001072018 | Thyroid | PTC | positive regulation of cell development | 138/5968 | 298/18723 | 1.13e-07 | 2.22e-06 | 138 |
| GO:0010770111 | Thyroid | PTC | positive regulation of cell morphogenesis involved in differentiation | 48/5968 | 79/18723 | 1.15e-07 | 2.26e-06 | 48 |
| GO:000920526 | Thyroid | PTC | purine ribonucleoside triphosphate metabolic process | 49/5968 | 82/18723 | 1.78e-07 | 3.33e-06 | 49 |
| GO:007252127 | Thyroid | PTC | purine-containing compound metabolic process | 182/5968 | 416/18723 | 1.92e-07 | 3.51e-06 | 182 |
| GO:000914127 | Thyroid | PTC | nucleoside triphosphate metabolic process | 62/5968 | 112/18723 | 2.26e-07 | 4.00e-06 | 62 |
| GO:000925927 | Thyroid | PTC | ribonucleotide metabolic process | 170/5968 | 385/18723 | 2.32e-07 | 4.08e-06 | 170 |
| GO:001635819 | Thyroid | PTC | dendrite development | 115/5968 | 243/18723 | 3.16e-07 | 5.35e-06 | 115 |
| GO:006156419 | Thyroid | PTC | axon development | 199/5968 | 467/18723 | 5.27e-07 | 8.53e-06 | 199 |
| GO:0043523110 | Thyroid | PTC | regulation of neuron apoptotic process | 102/5968 | 212/18723 | 5.45e-07 | 8.76e-06 | 102 |
| GO:000919920 | Thyroid | PTC | ribonucleoside triphosphate metabolic process | 50/5968 | 89/18723 | 1.81e-06 | 2.50e-05 | 50 |
| GO:000616327 | Thyroid | PTC | purine nucleotide metabolic process | 170/5968 | 396/18723 | 2.02e-06 | 2.75e-05 | 170 |
| GO:000740918 | Thyroid | PTC | axonogenesis | 178/5968 | 418/18723 | 2.17e-06 | 2.91e-05 | 178 |
| GO:005076914 | Thyroid | PTC | positive regulation of neurogenesis | 105/5968 | 225/18723 | 2.28e-06 | 3.05e-05 | 105 |
| GO:000918526 | Thyroid | PTC | ribonucleoside diphosphate metabolic process | 57/5968 | 106/18723 | 2.40e-06 | 3.17e-05 | 57 |
| GO:0001667112 | Thyroid | PTC | ameboidal-type cell migration | 198/5968 | 475/18723 | 3.36e-06 | 4.34e-05 | 198 |
| GO:00609988 | Thyroid | PTC | regulation of dendritic spine development | 37/5968 | 61/18723 | 3.41e-06 | 4.40e-05 | 37 |
| GO:010602715 | Thyroid | PTC | neuron projection organization | 51/5968 | 93/18723 | 3.76e-06 | 4.75e-05 | 51 |
| GO:000913225 | Thyroid | PTC | nucleoside diphosphate metabolic process | 64/5968 | 124/18723 | 3.80e-06 | 4.78e-05 | 64 |
| GO:009706110 | Thyroid | PTC | dendritic spine organization | 47/5968 | 84/18723 | 4.27e-06 | 5.28e-05 | 47 |
| GO:000913526 | Thyroid | PTC | purine nucleoside diphosphate metabolic process | 55/5968 | 103/18723 | 4.75e-06 | 5.79e-05 | 55 |
| Page: 1 2 3 4 5 6 7 8 9 10 11 12 13 14 15 16 17 18 19 20 21 22 23 24 25 26 27 28 29 30 31 32 33 34 35 36 37 38 39 40 41 42 43 44 |
| Pathway ID | Tissue | Disease Stage | Description | Gene Ratio | Bg Ratio | pvalue | p.adjust | qvalue | Count |
| hsa012325 | Esophagus | ESCC | Nucleotide metabolism | 59/4205 | 85/8465 | 1.67e-04 | 6.58e-04 | 3.37e-04 | 59 |
| hsa012405 | Esophagus | ESCC | Biosynthesis of cofactors | 97/4205 | 153/8465 | 3.88e-04 | 1.35e-03 | 6.94e-04 | 97 |
| hsa0123212 | Esophagus | ESCC | Nucleotide metabolism | 59/4205 | 85/8465 | 1.67e-04 | 6.58e-04 | 3.37e-04 | 59 |
| hsa0124012 | Esophagus | ESCC | Biosynthesis of cofactors | 97/4205 | 153/8465 | 3.88e-04 | 1.35e-03 | 6.94e-04 | 97 |
| hsa01240 | Liver | Cirrhotic | Biosynthesis of cofactors | 66/2530 | 153/8465 | 3.11e-04 | 1.99e-03 | 1.23e-03 | 66 |
| hsa01232 | Liver | Cirrhotic | Nucleotide metabolism | 39/2530 | 85/8465 | 1.27e-03 | 6.73e-03 | 4.15e-03 | 39 |
| hsa012401 | Liver | Cirrhotic | Biosynthesis of cofactors | 66/2530 | 153/8465 | 3.11e-04 | 1.99e-03 | 1.23e-03 | 66 |
| hsa012321 | Liver | Cirrhotic | Nucleotide metabolism | 39/2530 | 85/8465 | 1.27e-03 | 6.73e-03 | 4.15e-03 | 39 |
| hsa012402 | Liver | HCC | Biosynthesis of cofactors | 103/4020 | 153/8465 | 4.67e-07 | 5.05e-06 | 2.81e-06 | 103 |
| hsa012322 | Liver | HCC | Nucleotide metabolism | 59/4020 | 85/8465 | 3.30e-05 | 1.88e-04 | 1.04e-04 | 59 |
| hsa012403 | Liver | HCC | Biosynthesis of cofactors | 103/4020 | 153/8465 | 4.67e-07 | 5.05e-06 | 2.81e-06 | 103 |
| hsa012323 | Liver | HCC | Nucleotide metabolism | 59/4020 | 85/8465 | 3.30e-05 | 1.88e-04 | 1.04e-04 | 59 |
| hsa012324 | Oral cavity | OSCC | Nucleotide metabolism | 54/3704 | 85/8465 | 1.78e-04 | 5.95e-04 | 3.03e-04 | 54 |
| hsa012404 | Oral cavity | OSCC | Biosynthesis of cofactors | 88/3704 | 153/8465 | 3.84e-04 | 1.20e-03 | 6.12e-04 | 88 |
| hsa0123211 | Oral cavity | OSCC | Nucleotide metabolism | 54/3704 | 85/8465 | 1.78e-04 | 5.95e-04 | 3.03e-04 | 54 |
| hsa0124011 | Oral cavity | OSCC | Biosynthesis of cofactors | 88/3704 | 153/8465 | 3.84e-04 | 1.20e-03 | 6.12e-04 | 88 |
| hsa0123221 | Oral cavity | LP | Nucleotide metabolism | 42/2418 | 85/8465 | 3.62e-05 | 2.36e-04 | 1.52e-04 | 42 |
| hsa0124021 | Oral cavity | LP | Biosynthesis of cofactors | 57/2418 | 153/8465 | 1.17e-02 | 3.91e-02 | 2.52e-02 | 57 |
| hsa0123231 | Oral cavity | LP | Nucleotide metabolism | 42/2418 | 85/8465 | 3.62e-05 | 2.36e-04 | 1.52e-04 | 42 |
| hsa0124031 | Oral cavity | LP | Biosynthesis of cofactors | 57/2418 | 153/8465 | 1.17e-02 | 3.91e-02 | 2.52e-02 | 57 |
| Page: 1 |
Top |
Cell-cell communication analysis |
| Identification of potential cell-cell interactions between two cell types and their ligand-receptor pairs for different disease states |
| Ligand | Receptor | LRpair | Pathway | Tissue | Disease Stage |
| Page: 1 |
Top |
Single-cell gene regulatory network inference analysis |
| Find out the significant the regulons (TFs) and the target genes of each regulon across cell types for different disease states |
| TF | Cell Type | Tissue | Disease Stage | Target Gene | RSS | Regulon Activity |
| ∗The dot plots of a searched regulon are shown for all cell subpopulations in each disease state of each tissue based on the regulon specific score inferred using pySCENIC and by calculating the average expression. |
| Page: 1 |
Top |
Somatic mutation of malignant transformation related genes |
| Annotation of somatic variants for genes involved in malignant transformation |
| Hugo Symbol | Variant Class | Variant Classification | dbSNP RS | HGVSc | HGVSp | HGVSp Short | SWISSPROT | BIOTYPE | SIFT | PolyPhen | Tumor Sample Barcode | Tissue | Histology | Sex | Age | Stage | Therapy Types | Drugs | Outcome |
| AK3 | SNV | Missense_Mutation | novel | c.593G>A | p.Gly198Glu | p.G198E | Q9UIJ7 | protein_coding | deleterious(0) | probably_damaging(0.986) | TCGA-AR-A2LE-01 | Breast | breast invasive carcinoma | Female | >=65 | I/II | Hormone Therapy | tamoxiphen | PD |
| AK3 | SNV | Missense_Mutation | rs773321603 | c.53N>G | p.Ser18Trp | p.S18W | Q9UIJ7 | protein_coding | deleterious(0) | probably_damaging(1) | TCGA-EK-A2R8-01 | Cervix | cervical & endocervical cancer | Female | <65 | I/II | Unknown | Unknown | SD |
| AK3 | SNV | Missense_Mutation | c.456N>G | p.Asp152Glu | p.D152E | Q9UIJ7 | protein_coding | deleterious(0) | probably_damaging(0.913) | TCGA-AA-3695-01 | Colorectum | colon adenocarcinoma | Female | <65 | III/IV | Unknown | Unknown | SD | |
| AK3 | SNV | Missense_Mutation | novel | c.359T>G | p.Val120Gly | p.V120G | Q9UIJ7 | protein_coding | deleterious(0) | possibly_damaging(0.878) | TCGA-AA-A010-01 | Colorectum | colon adenocarcinoma | Female | <65 | I/II | Chemotherapy | folinic | CR |
| AK3 | SNV | Missense_Mutation | c.88C>G | p.His30Asp | p.H30D | Q9UIJ7 | protein_coding | tolerated(0.78) | benign(0) | TCGA-D5-6535-01 | Colorectum | colon adenocarcinoma | Female | >=65 | III/IV | Unknown | Unknown | SD | |
| AK3 | deletion | Frame_Shift_Del | c.7delN | p.Ala3ArgfsTer9 | p.A3Rfs*9 | Q9UIJ7 | protein_coding | TCGA-A6-6780-01 | Colorectum | colon adenocarcinoma | Male | >=65 | I/II | Unknown | Unknown | SD | |||
| AK3 | deletion | Frame_Shift_Del | c.7delG | p.Ala3ArgfsTer9 | p.A3Rfs*9 | Q9UIJ7 | protein_coding | TCGA-CM-4743-01 | Colorectum | colon adenocarcinoma | Male | >=65 | I/II | Chemotherapy | capecitabine | SD | |||
| AK3 | SNV | Missense_Mutation | novel | c.115N>A | p.Gly39Arg | p.G39R | Q9UIJ7 | protein_coding | deleterious(0) | probably_damaging(0.991) | TCGA-A5-A1OF-01 | Endometrium | uterine corpus endometrioid carcinoma | Female | <65 | I/II | Unknown | Unknown | SD |
| AK3 | SNV | Missense_Mutation | rs750035551 | c.370N>T | p.Arg124Cys | p.R124C | Q9UIJ7 | protein_coding | deleterious(0) | probably_damaging(1) | TCGA-AJ-A3BH-01 | Endometrium | uterine corpus endometrioid carcinoma | Female | Unknown | I/II | Unknown | Unknown | SD |
| AK3 | SNV | Missense_Mutation | novel | c.436N>C | p.Lys146Gln | p.K146Q | Q9UIJ7 | protein_coding | tolerated(0.27) | benign(0.106) | TCGA-AJ-A3OL-01 | Endometrium | uterine corpus endometrioid carcinoma | Female | <65 | III/IV | Chemotherapy | carboplatin | PD |
| Page: 1 2 |
Top |
Related drugs of malignant transformation related genes |
| Identification of chemicals and drugs interact with genes involved in malignant transfromation |
| (DGIdb 4.0) |
| Entrez ID | Symbol | Category | Interaction Types | Drug Claim Name | Drug Name | PMIDs |
| Page: 1 |

Copyright 2023-Present -The University of Texas Health Science Center at Houston |