
|
|||||
|
 | |
| |
| |
| |
| |
| |
|
Gene: TNRC6A |
Gene summary for TNRC6A |
| Gene information | Species | Human | Gene symbol | TNRC6A | Gene ID | 27327 |
| Gene name | trinucleotide repeat containing adaptor 6A | |
| Gene Alias | CAGH26 | |
| Cytomap | 16p12.1 | |
| Gene Type | protein-coding | GO ID | GO:0000288 | UniProtAcc | Q8NDV7 |
Top |
Malignant transformation analysis |
| Identification of the aberrant gene expression in precancerous and cancerous lesions by comparing the gene expression of stem-like cells in diseased tissues with normal stem cells |
| Entrez ID | Symbol | Replicates | Species | Organ | Tissue | Adj P-value | Log2FC | Malignancy |
| 27327 | TNRC6A | CCI_1 | Human | Cervix | CC | 1.71e-04 | 7.48e-01 | 0.528 |
| 27327 | TNRC6A | CCI_2 | Human | Cervix | CC | 3.83e-10 | 1.20e+00 | 0.5249 |
| 27327 | TNRC6A | CCI_3 | Human | Cervix | CC | 2.73e-11 | 1.08e+00 | 0.516 |
| 27327 | TNRC6A | HTA11_3410_2000001011 | Human | Colorectum | AD | 2.03e-24 | -6.42e-01 | 0.0155 |
| 27327 | TNRC6A | HTA11_2487_2000001011 | Human | Colorectum | SER | 6.16e-10 | -5.43e-01 | -0.1808 |
| 27327 | TNRC6A | HTA11_2951_2000001011 | Human | Colorectum | AD | 4.88e-02 | -5.76e-01 | 0.0216 |
| 27327 | TNRC6A | HTA11_1938_2000001011 | Human | Colorectum | AD | 2.16e-04 | -4.24e-01 | -0.0811 |
| 27327 | TNRC6A | HTA11_3361_2000001011 | Human | Colorectum | AD | 1.26e-12 | -7.61e-01 | -0.1207 |
| 27327 | TNRC6A | HTA11_83_2000001011 | Human | Colorectum | SER | 1.66e-02 | -3.95e-01 | -0.1526 |
| 27327 | TNRC6A | HTA11_696_2000001011 | Human | Colorectum | AD | 2.68e-05 | -3.64e-01 | -0.1464 |
| 27327 | TNRC6A | HTA11_866_2000001011 | Human | Colorectum | AD | 1.91e-02 | -3.43e-01 | -0.1001 |
| 27327 | TNRC6A | HTA11_5212_2000001011 | Human | Colorectum | AD | 3.09e-04 | -5.94e-01 | -0.2061 |
| 27327 | TNRC6A | HTA11_5216_2000001011 | Human | Colorectum | SER | 1.94e-04 | -5.76e-01 | -0.1462 |
| 27327 | TNRC6A | HTA11_546_2000001011 | Human | Colorectum | AD | 3.89e-03 | -4.30e-01 | -0.0842 |
| 27327 | TNRC6A | HTA11_7862_2000001011 | Human | Colorectum | AD | 1.34e-04 | -5.34e-01 | -0.0179 |
| 27327 | TNRC6A | HTA11_866_3004761011 | Human | Colorectum | AD | 5.58e-12 | -4.26e-01 | 0.096 |
| 27327 | TNRC6A | HTA11_8622_2000001021 | Human | Colorectum | SER | 9.68e-08 | -7.83e-01 | 0.0528 |
| 27327 | TNRC6A | HTA11_7696_3000711011 | Human | Colorectum | AD | 9.22e-06 | -3.36e-01 | 0.0674 |
| 27327 | TNRC6A | HTA11_99999971662_82457 | Human | Colorectum | MSS | 1.91e-02 | -3.04e-01 | 0.3859 |
| 27327 | TNRC6A | HTA11_99999973899_84307 | Human | Colorectum | MSS | 1.84e-03 | -5.39e-01 | 0.2585 |
| Page: 1 2 3 4 5 6 7 8 9 10 11 |
| Tissue | Expression Dynamics | Abbreviation |
| Cervix |  | CC: Cervix cancer |
| HSIL_HPV: HPV-infected high-grade squamous intraepithelial lesions | ||
| N_HPV: HPV-infected normal cervix | ||
| Colorectum (GSE201348) |  | FAP: Familial adenomatous polyposis |
| CRC: Colorectal cancer | ||
| Colorectum (HTA11) |  | AD: Adenomas |
| SER: Sessile serrated lesions | ||
| MSI-H: Microsatellite-high colorectal cancer | ||
| MSS: Microsatellite stable colorectal cancer | ||
| Esophagus | 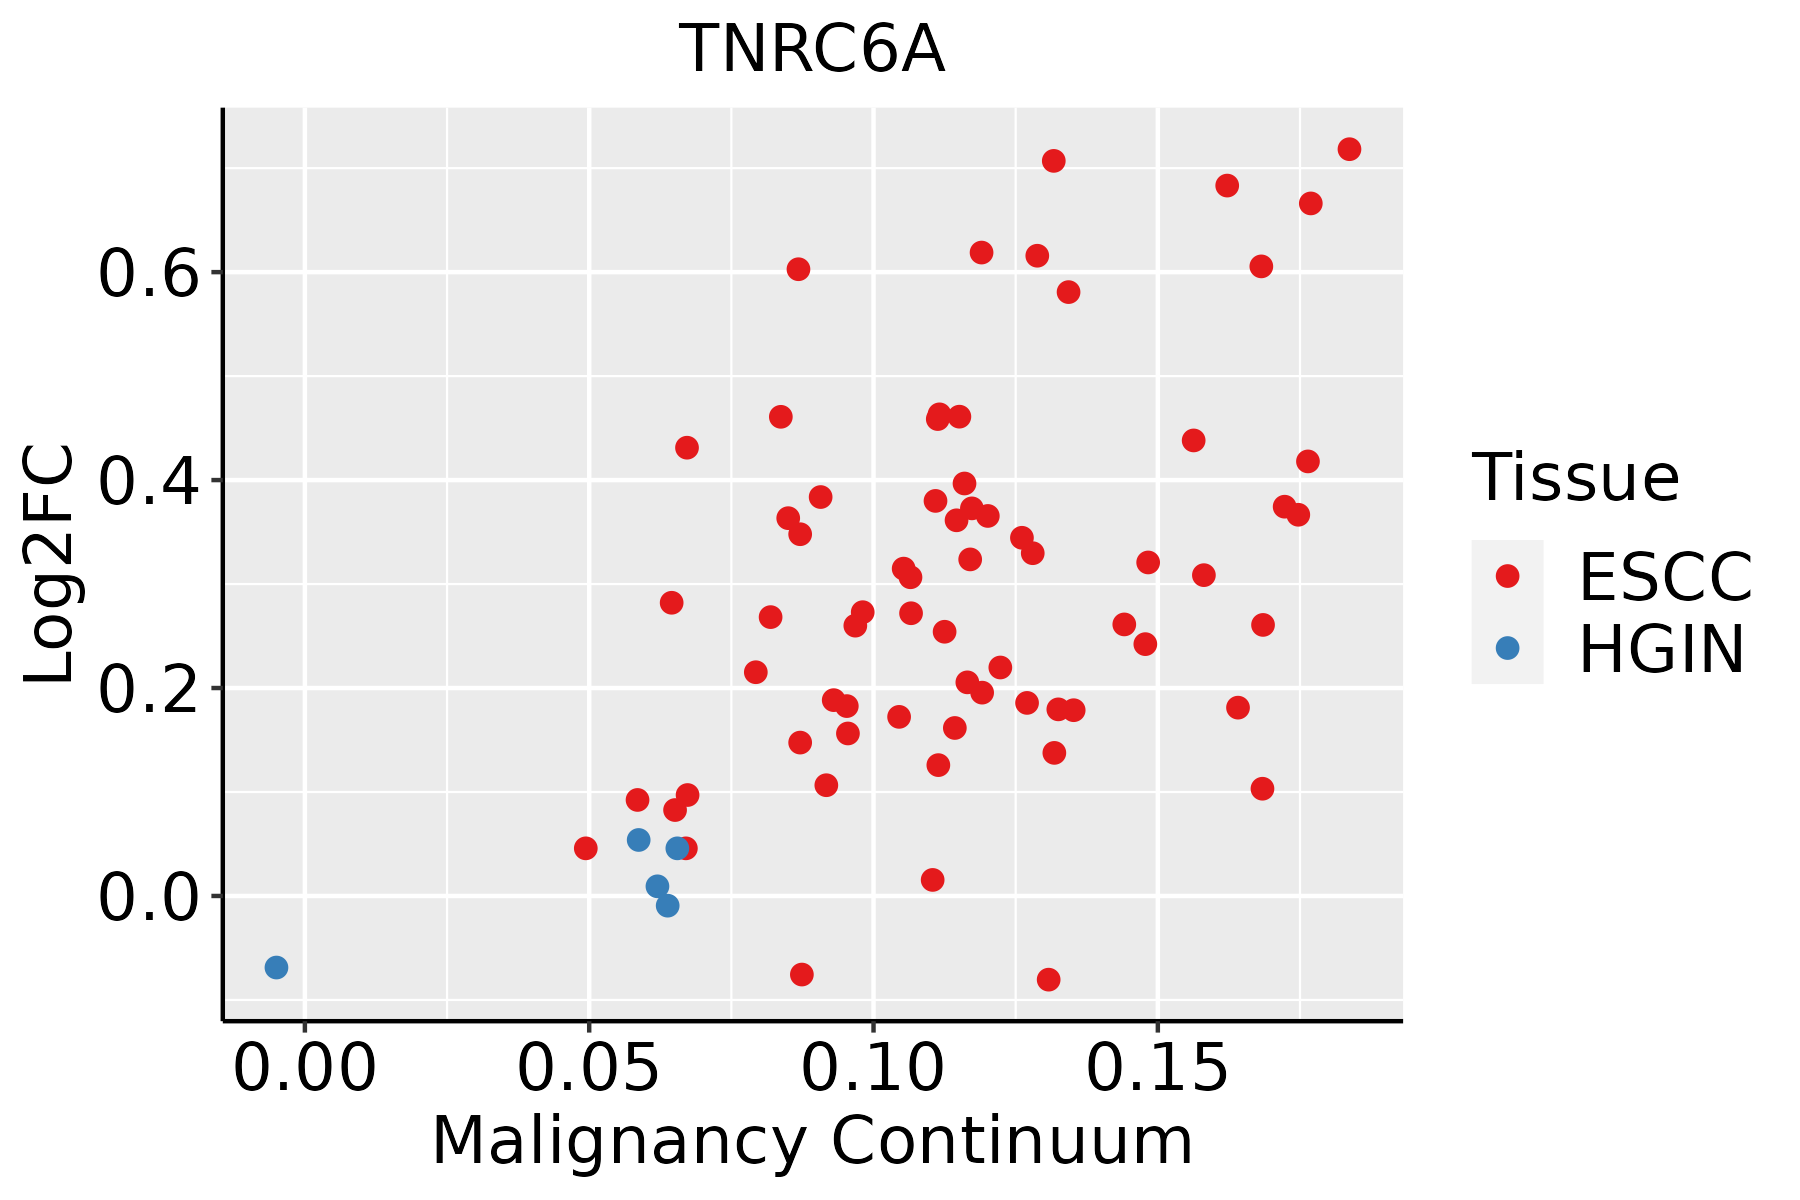 | ESCC: Esophageal squamous cell carcinoma |
| HGIN: High-grade intraepithelial neoplasias | ||
| LGIN: Low-grade intraepithelial neoplasias | ||
| Liver | 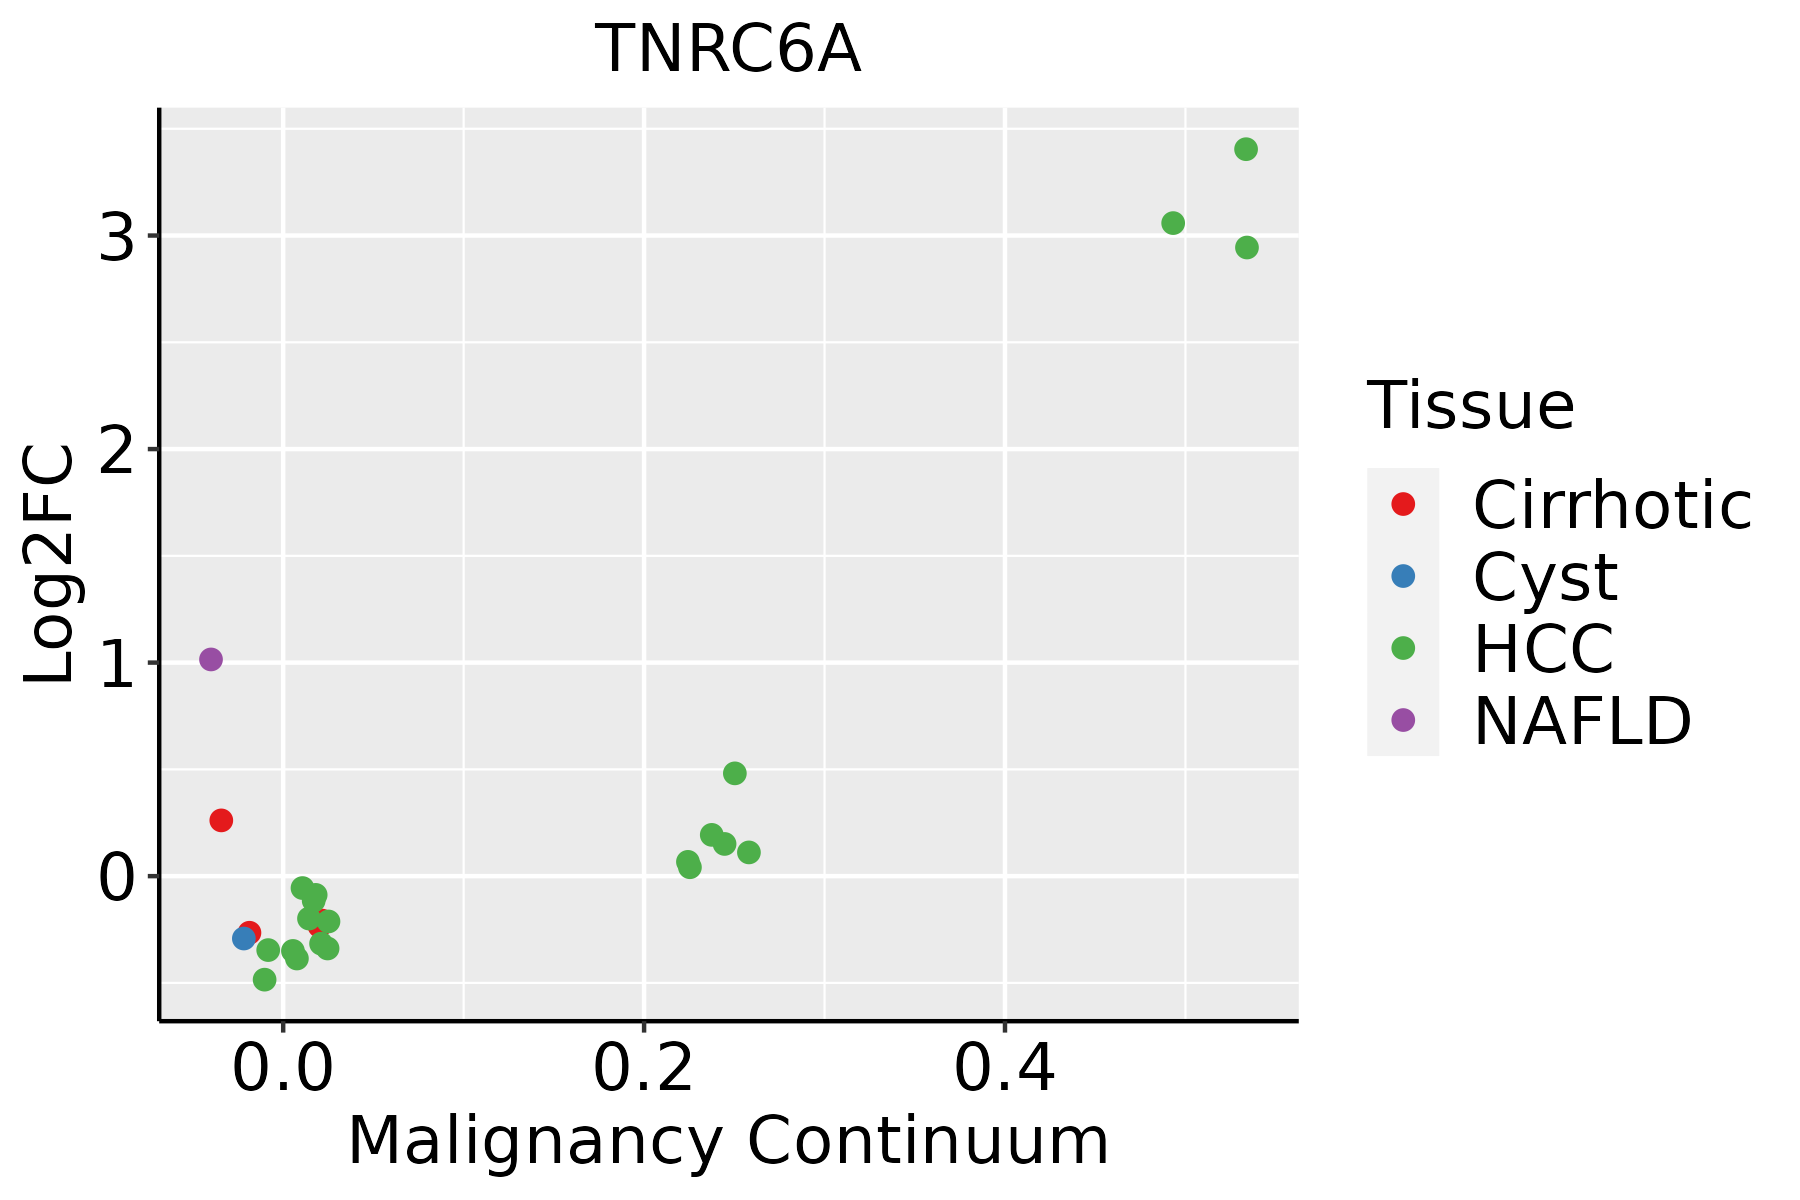 | HCC: Hepatocellular carcinoma |
| NAFLD: Non-alcoholic fatty liver disease | ||
| Lung | 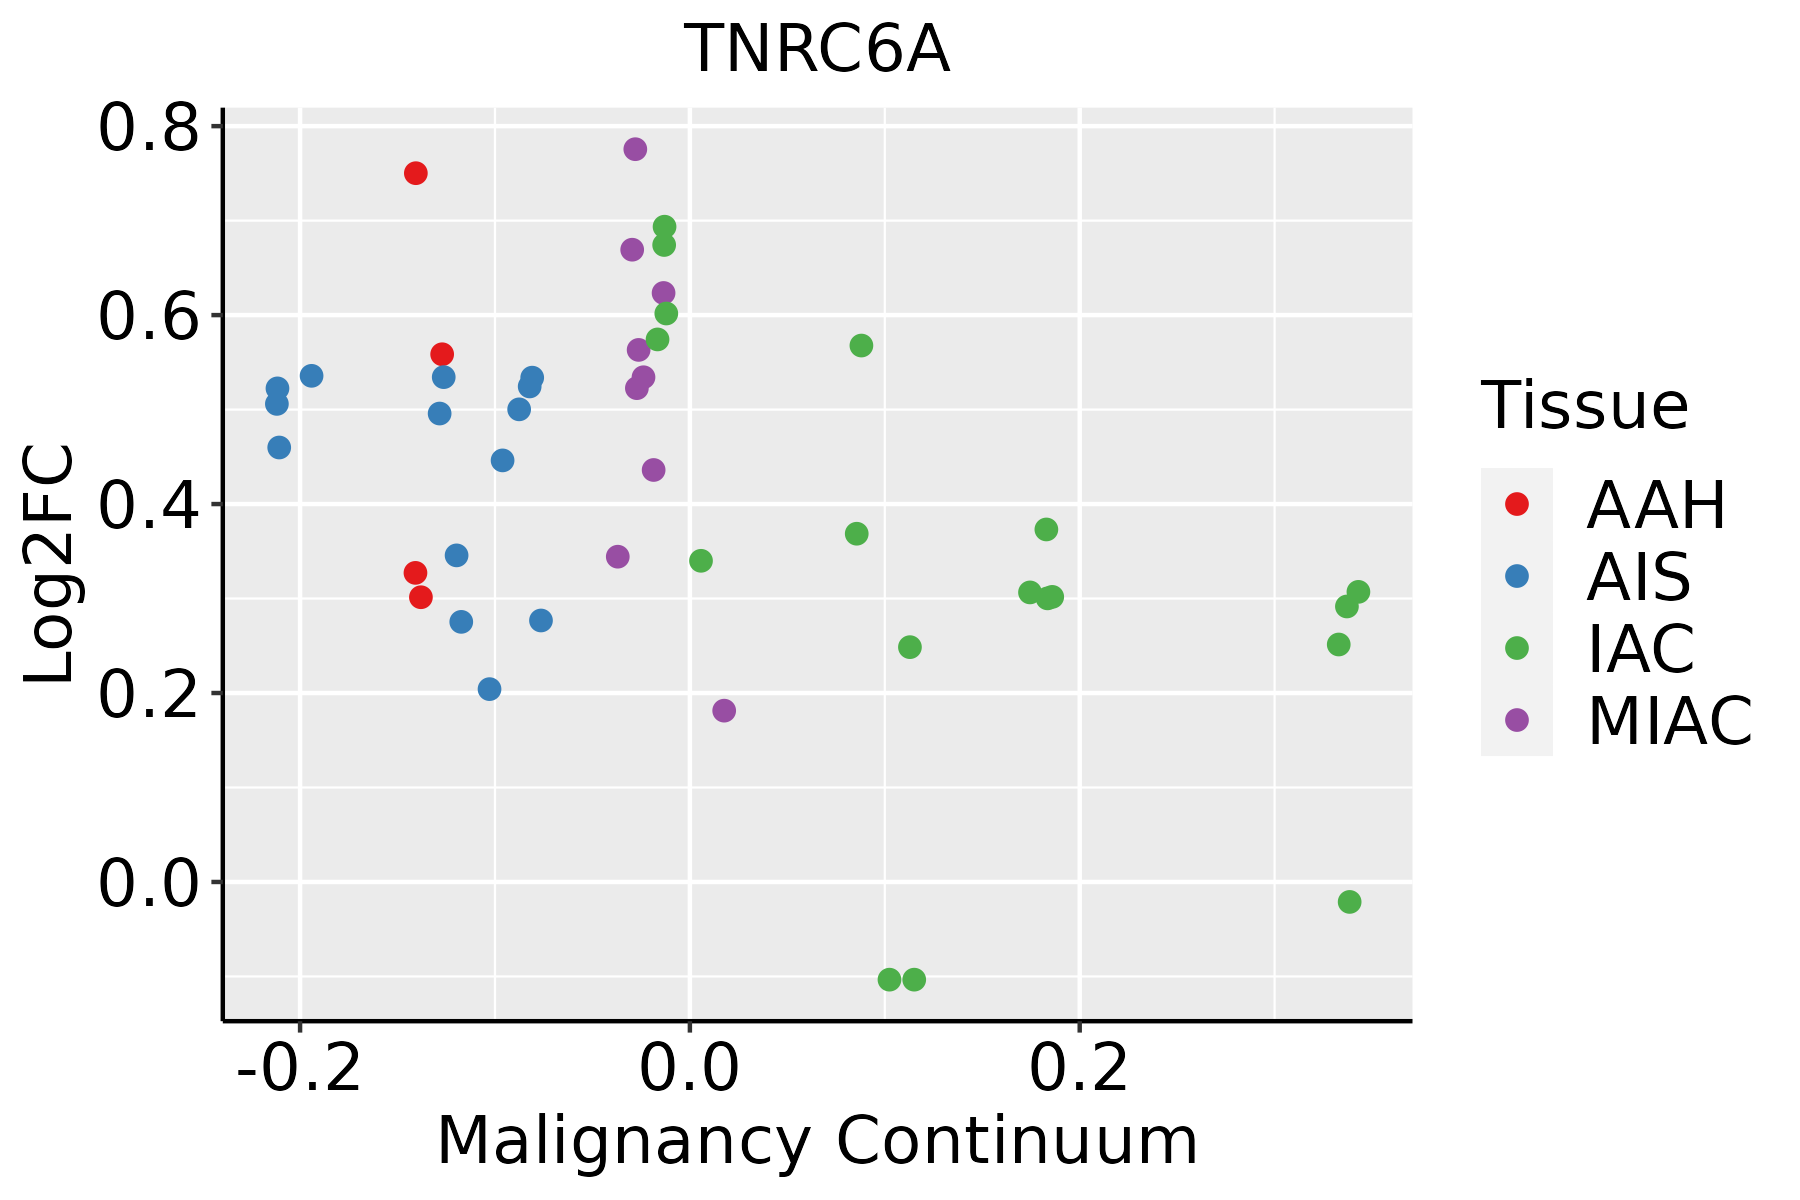 | AAH: Atypical adenomatous hyperplasia |
| AIS: Adenocarcinoma in situ | ||
| IAC: Invasive lung adenocarcinoma | ||
| MIA: Minimally invasive adenocarcinoma | ||
| Oral Cavity | 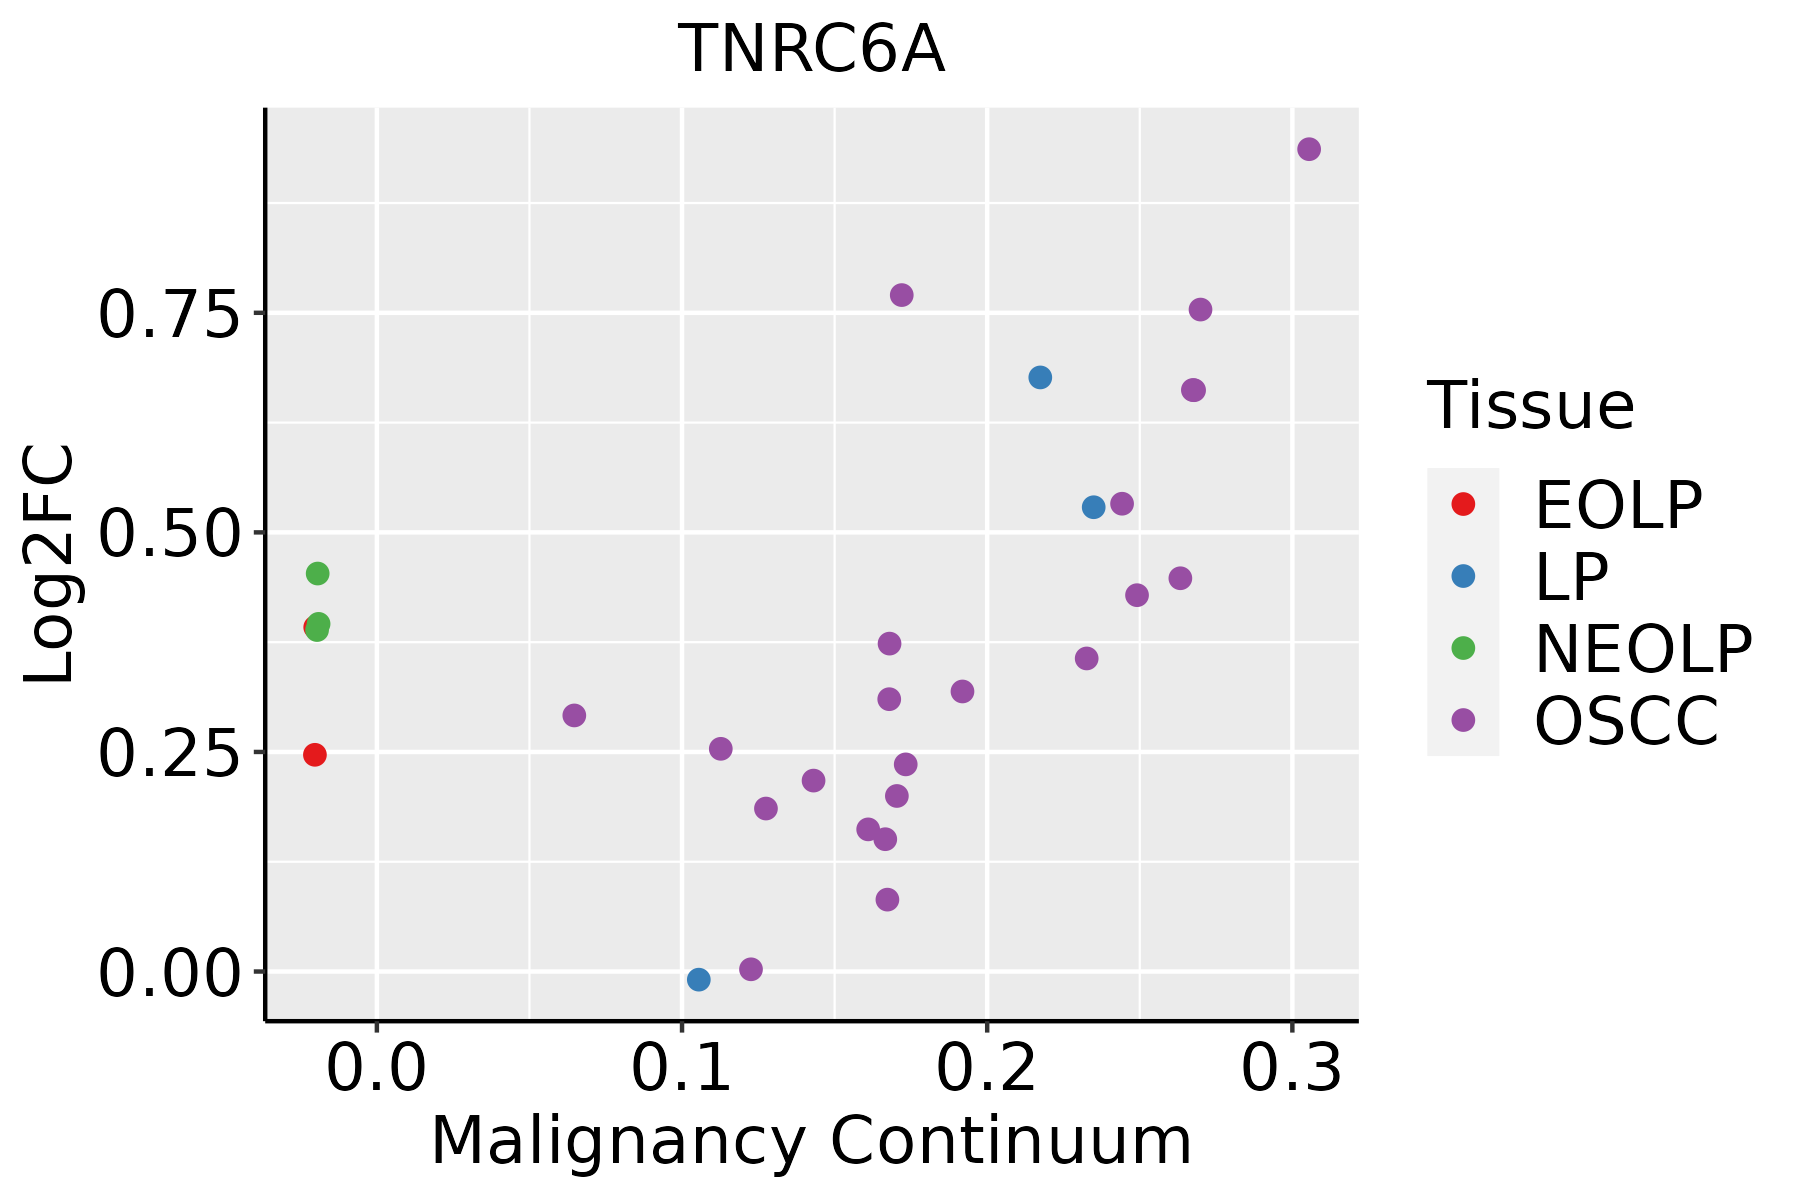 | EOLP: Erosive Oral lichen planus |
| LP: leukoplakia | ||
| NEOLP: Non-erosive oral lichen planus | ||
| OSCC: Oral squamous cell carcinoma | ||
| Prostate | 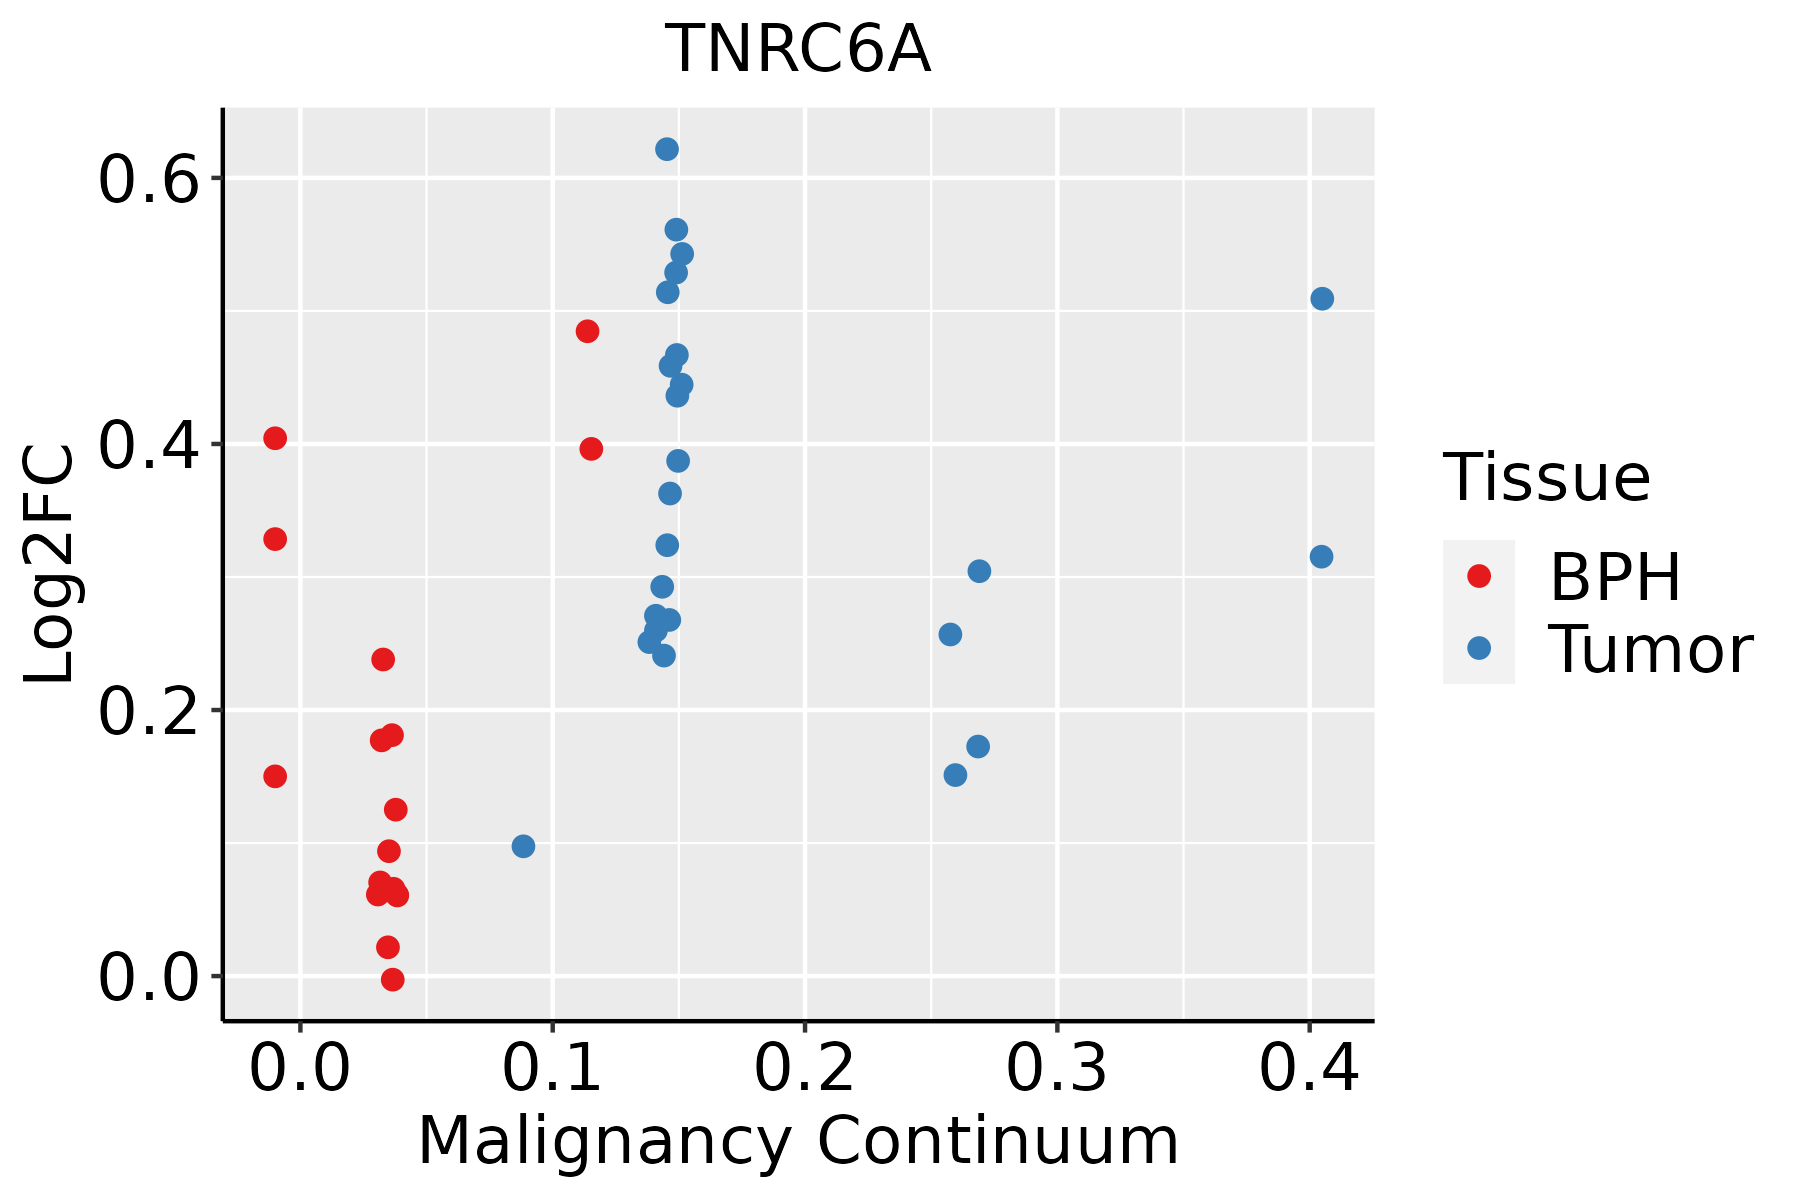 | BPH: Benign Prostatic Hyperplasia |
| Skin | 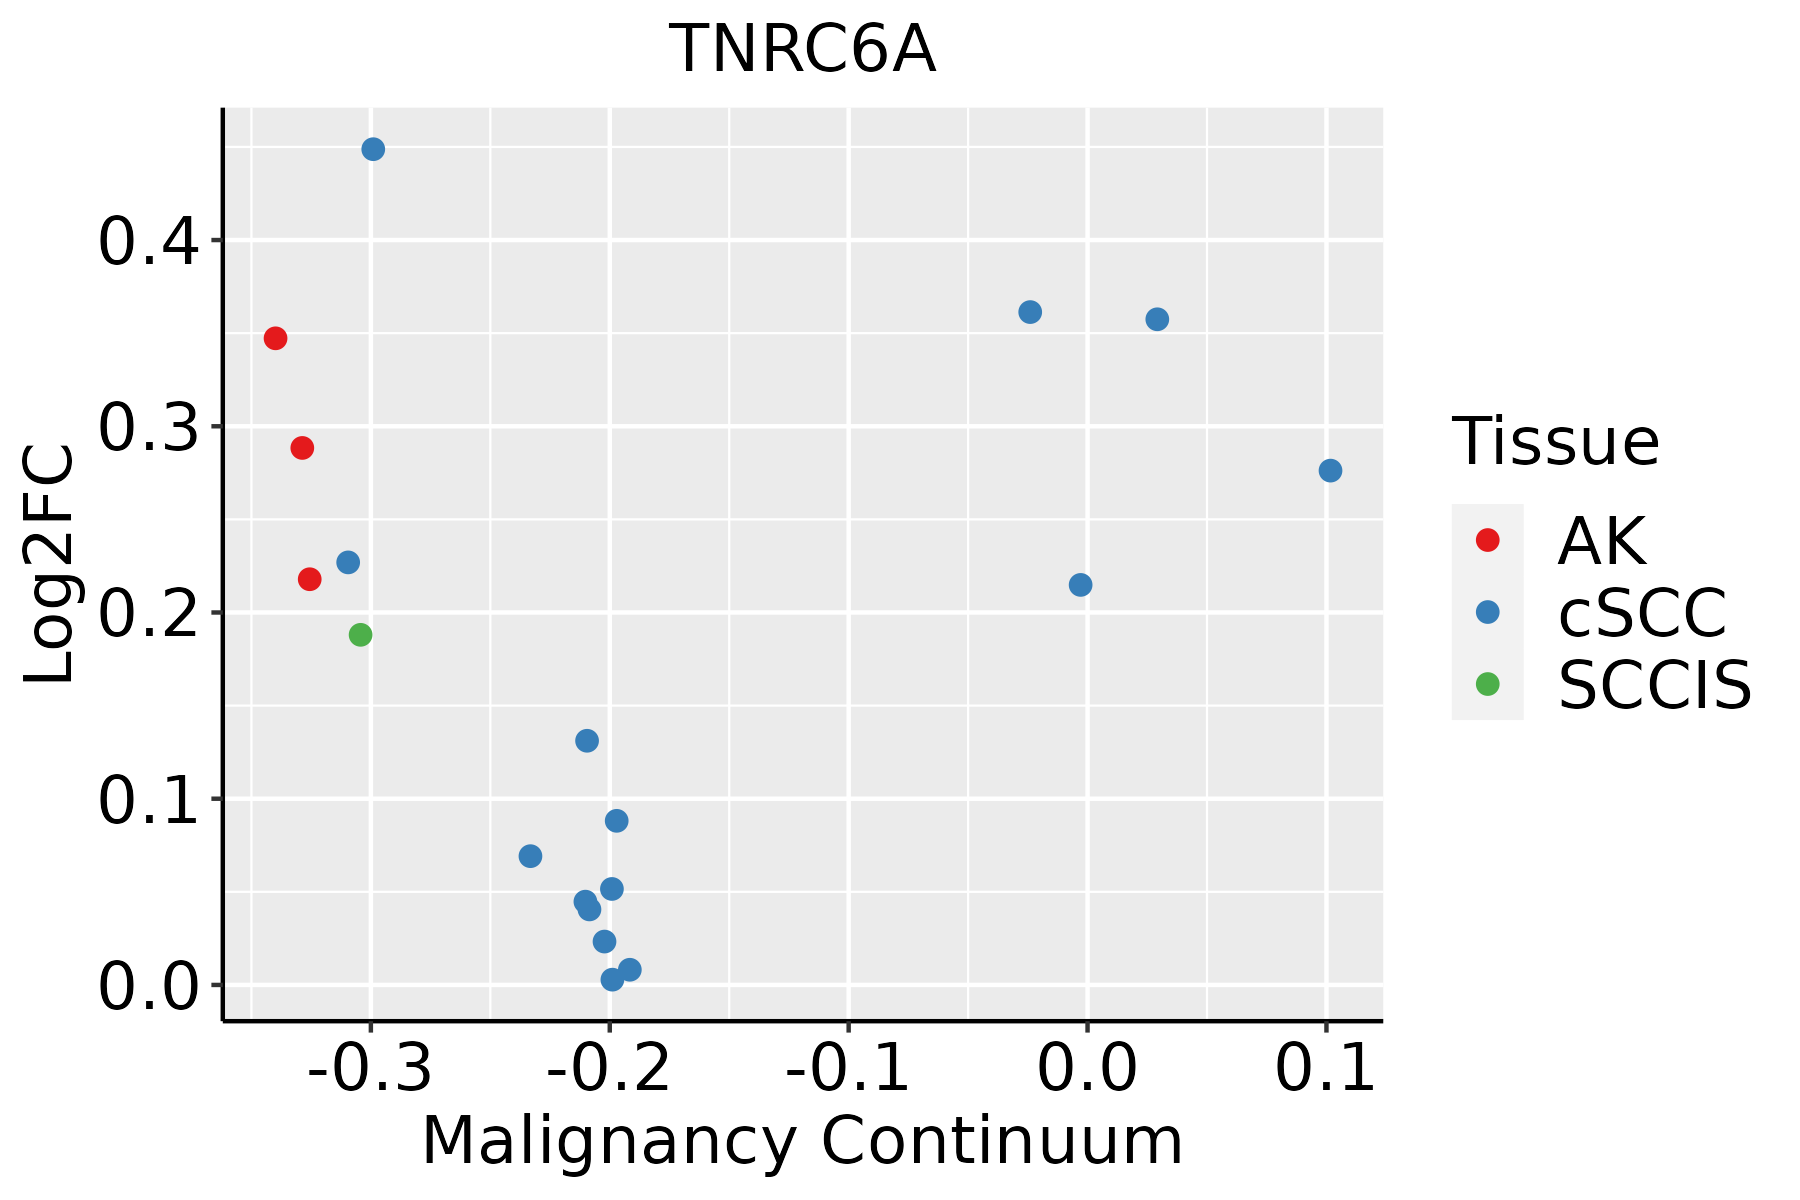 | AK: Actinic keratosis |
| cSCC: Cutaneous squamous cell carcinoma | ||
| SCCIS:squamous cell carcinoma in situ | ||
| Thyroid | 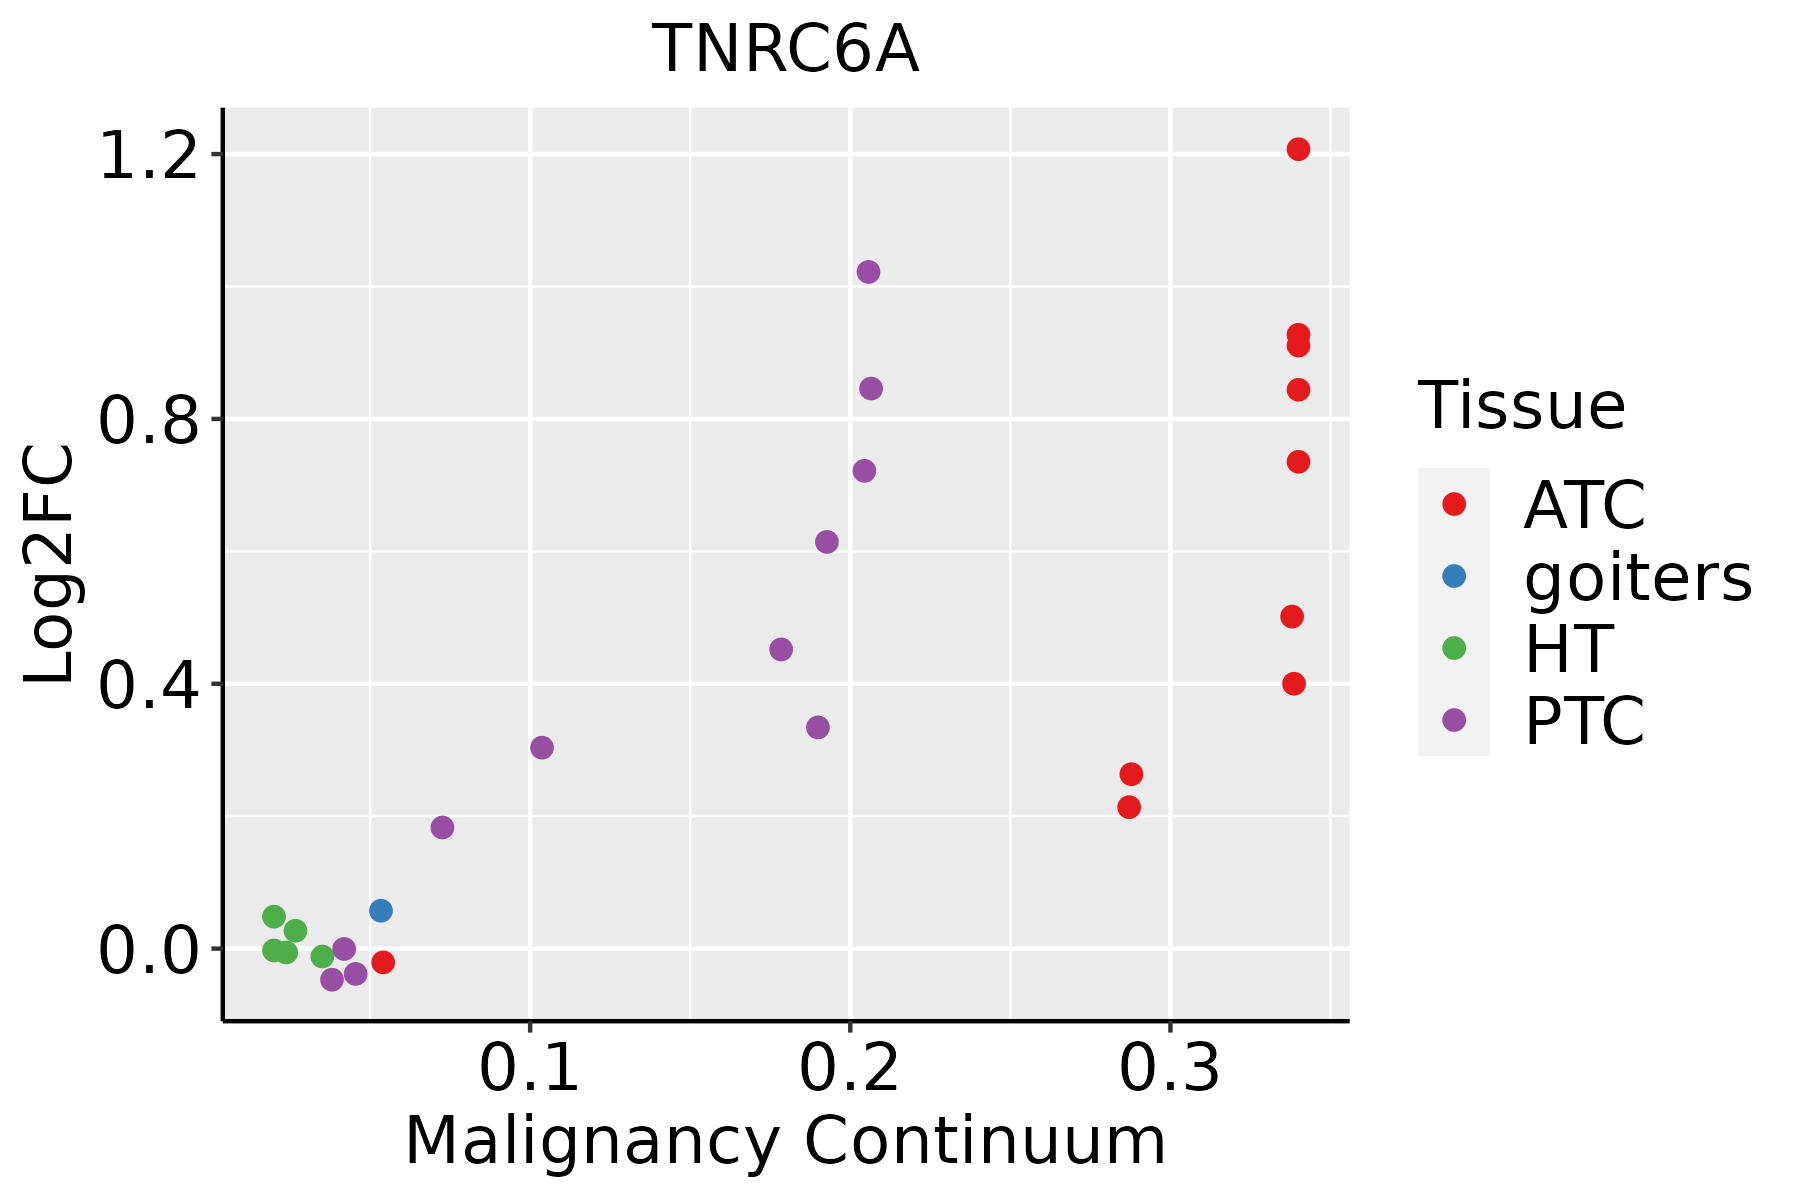 | ATC: Anaplastic thyroid cancer |
| HT: Hashimoto's thyroiditis | ||
| PTC: Papillary thyroid cancer |
| ∗log2FC in expression of this searched gene in stem-like cells from each diseased tissue sample relative to stem-like cells in normal samples in each tissue plotted against the malignancy continuum. Samples are colored based on if they are from different disease stage. |
Top |
Malignant transformation related pathway analysis |
| Find out the enriched GO biological processes and KEGG pathways involved in transition from healthy to precancer to cancer |
| Tissue | Disease Stage | Enriched GO biological Processes |
| Colorectum | AD |  |
| Colorectum | SER |  |
| Colorectum | MSS |  |
| Colorectum | MSI-H |  |
| Colorectum | FAP |  |
| ∗Top 15 enriched GO BP terms are showed in the bar plot of each disease state in each tissue. Each row represents a significant GO biological process which is colored according to the -log10(p.adjust). |
| Page: 1 2 3 4 5 6 7 8 9 |
| GO ID | Tissue | Disease Stage | Description | Gene Ratio | Bg Ratio | pvalue | p.adjust | Count |
| GO:004348725 | Thyroid | ATC | regulation of RNA stability | 97/6293 | 170/18723 | 2.68e-10 | 7.70e-09 | 97 |
| GO:006101325 | Thyroid | ATC | regulation of mRNA catabolic process | 95/6293 | 166/18723 | 3.27e-10 | 9.16e-09 | 95 |
| GO:004348826 | Thyroid | ATC | regulation of mRNA stability | 90/6293 | 158/18723 | 1.31e-09 | 3.30e-08 | 90 |
| GO:003166927 | Thyroid | ATC | cellular response to nutrient levels | 112/6293 | 215/18723 | 1.57e-08 | 3.20e-07 | 112 |
| GO:003166827 | Thyroid | ATC | cellular response to extracellular stimulus | 125/6293 | 246/18723 | 1.65e-08 | 3.31e-07 | 125 |
| GO:004259424 | Thyroid | ATC | response to starvation | 103/6293 | 197/18723 | 4.59e-08 | 8.31e-07 | 103 |
| GO:000926724 | Thyroid | ATC | cellular response to starvation | 85/6293 | 156/18723 | 6.14e-08 | 1.09e-06 | 85 |
| GO:0061157110 | Thyroid | ATC | mRNA destabilization | 52/6293 | 84/18723 | 1.01e-07 | 1.70e-06 | 52 |
| GO:0061014110 | Thyroid | ATC | positive regulation of mRNA catabolic process | 53/6293 | 87/18723 | 1.63e-07 | 2.61e-06 | 53 |
| GO:0031667210 | Thyroid | ATC | response to nutrient levels | 212/6293 | 474/18723 | 2.37e-07 | 3.70e-06 | 212 |
| GO:0050779110 | Thyroid | ATC | RNA destabilization | 53/6293 | 88/18723 | 2.75e-07 | 4.20e-06 | 53 |
| GO:0000288110 | Thyroid | ATC | nuclear-transcribed mRNA catabolic process, deadenylation-dependent decay | 36/6293 | 56/18723 | 2.57e-06 | 3.00e-05 | 36 |
| GO:003424923 | Thyroid | ATC | negative regulation of cellular amide metabolic process | 121/6293 | 273/18723 | 1.36e-04 | 9.57e-04 | 121 |
| GO:006021119 | Thyroid | ATC | regulation of nuclear-transcribed mRNA poly(A) tail shortening | 12/6293 | 15/18723 | 3.10e-04 | 1.94e-03 | 12 |
| GO:000028919 | Thyroid | ATC | nuclear-transcribed mRNA poly(A) tail shortening | 19/6293 | 29/18723 | 4.39e-04 | 2.62e-03 | 19 |
| GO:001714823 | Thyroid | ATC | negative regulation of translation | 107/6293 | 245/18723 | 6.17e-04 | 3.51e-03 | 107 |
| GO:0060213111 | Thyroid | ATC | positive regulation of nuclear-transcribed mRNA poly(A) tail shortening | 10/6293 | 13/18723 | 1.77e-03 | 8.71e-03 | 10 |
| Page: 1 2 3 4 5 6 7 8 9 10 11 12 13 14 15 16 17 18 19 20 21 22 23 24 25 26 27 28 29 30 31 32 33 |
| Pathway ID | Tissue | Disease Stage | Description | Gene Ratio | Bg Ratio | pvalue | p.adjust | qvalue | Count |
| Page: 1 |
Top |
Cell-cell communication analysis |
| Identification of potential cell-cell interactions between two cell types and their ligand-receptor pairs for different disease states |
| Ligand | Receptor | LRpair | Pathway | Tissue | Disease Stage |
| Page: 1 |
Top |
Single-cell gene regulatory network inference analysis |
| Find out the significant the regulons (TFs) and the target genes of each regulon across cell types for different disease states |
| TF | Cell Type | Tissue | Disease Stage | Target Gene | RSS | Regulon Activity |
| ∗The dot plots of a searched regulon are shown for all cell subpopulations in each disease state of each tissue based on the regulon specific score inferred using pySCENIC and by calculating the average expression. |
| Page: 1 |
Top |
Somatic mutation of malignant transformation related genes |
| Annotation of somatic variants for genes involved in malignant transformation |
| Hugo Symbol | Variant Class | Variant Classification | dbSNP RS | HGVSc | HGVSp | HGVSp Short | SWISSPROT | BIOTYPE | SIFT | PolyPhen | Tumor Sample Barcode | Tissue | Histology | Sex | Age | Stage | Therapy Types | Drugs | Outcome |
| TNRC6A | SNV | Missense_Mutation | novel | c.1531N>C | p.Glu511Gln | p.E511Q | Q8NDV7 | protein_coding | tolerated(0.13) | possibly_damaging(0.837) | TCGA-A1-A0SI-01 | Breast | breast invasive carcinoma | Female | <65 | I/II | Unknown | Unknown | SD |
| TNRC6A | SNV | Missense_Mutation | novel | c.3425N>G | p.Glu1142Gly | p.E1142G | Q8NDV7 | protein_coding | tolerated(0.11) | benign(0.038) | TCGA-A8-A06R-01 | Breast | breast invasive carcinoma | Female | >=65 | I/II | Chemotherapy | 5-fluorouracil | CR |
| TNRC6A | SNV | Missense_Mutation | novel | c.847N>A | p.Leu283Ile | p.L283I | Q8NDV7 | protein_coding | tolerated(0.55) | benign(0.003) | TCGA-A8-A097-01 | Breast | breast invasive carcinoma | Female | >=65 | I/II | Hormone Therapy | tamoxiphen | SD |
| TNRC6A | SNV | Missense_Mutation | c.3223N>C | p.Asp1075His | p.D1075H | Q8NDV7 | protein_coding | deleterious(0) | probably_damaging(1) | TCGA-AC-A23H-01 | Breast | breast invasive carcinoma | Female | >=65 | I/II | Unknown | Unknown | PD | |
| TNRC6A | SNV | Missense_Mutation | c.2810C>T | p.Ser937Leu | p.S937L | Q8NDV7 | protein_coding | deleterious(0.03) | benign(0.101) | TCGA-AN-A046-01 | Breast | breast invasive carcinoma | Female | >=65 | I/II | Unknown | Unknown | SD | |
| TNRC6A | SNV | Missense_Mutation | c.5274N>T | p.Trp1758Cys | p.W1758C | Q8NDV7 | protein_coding | deleterious(0) | probably_damaging(0.997) | TCGA-AN-A0AK-01 | Breast | breast invasive carcinoma | Female | >=65 | I/II | Unknown | Unknown | SD | |
| TNRC6A | SNV | Missense_Mutation | c.1854N>A | p.Asn618Lys | p.N618K | Q8NDV7 | protein_coding | deleterious(0.01) | benign(0.036) | TCGA-AR-A1AH-01 | Breast | breast invasive carcinoma | Female | <65 | I/II | Unspecific | PD | ||
| TNRC6A | SNV | Missense_Mutation | c.5350N>A | p.Val1784Ile | p.V1784I | Q8NDV7 | protein_coding | deleterious(0) | probably_damaging(0.978) | TCGA-AR-A1AL-01 | Breast | breast invasive carcinoma | Female | <65 | III/IV | Hormone Therapy | anastrozole | SD | |
| TNRC6A | SNV | Missense_Mutation | c.5299N>T | p.Pro1767Ser | p.P1767S | Q8NDV7 | protein_coding | tolerated(0.15) | benign(0.158) | TCGA-B6-A0RG-01 | Breast | breast invasive carcinoma | Female | <65 | I/II | Unknown | Unknown | SD | |
| TNRC6A | SNV | Missense_Mutation | c.994G>A | p.Glu332Lys | p.E332K | Q8NDV7 | protein_coding | tolerated(0.14) | benign(0.018) | TCGA-GM-A2DH-01 | Breast | breast invasive carcinoma | Female | <65 | I/II | Chemotherapy | taxol | CR |
| Page: 1 2 3 4 5 6 7 8 9 10 11 12 13 14 15 16 17 18 19 20 21 22 23 |
Top |
Related drugs of malignant transformation related genes |
| Identification of chemicals and drugs interact with genes involved in malignant transfromation |
| (DGIdb 4.0) |
| Entrez ID | Symbol | Category | Interaction Types | Drug Claim Name | Drug Name | PMIDs |
| 27327 | TNRC6A | NA | ethanol | ALCOHOL | 32451486 |
| Page: 1 |

Copyright 2023-Present -The University of Texas Health Science Center at Houston |