
|
|||||
|
 | |
| |
| |
| |
| |
| |
|
Gene: SLC9A1 |
Gene summary for SLC9A1 |
| Gene information | Species | Human | Gene symbol | SLC9A1 | Gene ID | 6548 |
| Gene name | solute carrier family 9 member A1 | |
| Gene Alias | APNH | |
| Cytomap | 1p36.11 | |
| Gene Type | protein-coding | GO ID | GO:0001508 | UniProtAcc | B2RAH2 |
Top |
Malignant transformation analysis |
| Identification of the aberrant gene expression in precancerous and cancerous lesions by comparing the gene expression of stem-like cells in diseased tissues with normal stem cells |
| Entrez ID | Symbol | Replicates | Species | Organ | Tissue | Adj P-value | Log2FC | Malignancy |
| 6548 | SLC9A1 | HTA11_2487_2000001011 | Human | Colorectum | SER | 7.88e-13 | 6.35e-01 | -0.1808 |
| 6548 | SLC9A1 | HTA11_1938_2000001011 | Human | Colorectum | AD | 2.72e-07 | 3.64e-01 | -0.0811 |
| 6548 | SLC9A1 | HTA11_347_2000001011 | Human | Colorectum | AD | 2.06e-18 | 6.47e-01 | -0.1954 |
| 6548 | SLC9A1 | HTA11_411_2000001011 | Human | Colorectum | SER | 9.31e-03 | 8.29e-01 | -0.2602 |
| 6548 | SLC9A1 | HTA11_2112_2000001011 | Human | Colorectum | SER | 1.23e-02 | 7.25e-01 | -0.2196 |
| 6548 | SLC9A1 | HTA11_3361_2000001011 | Human | Colorectum | AD | 4.80e-06 | 5.56e-01 | -0.1207 |
| 6548 | SLC9A1 | HTA11_83_2000001011 | Human | Colorectum | SER | 6.12e-05 | 5.17e-01 | -0.1526 |
| 6548 | SLC9A1 | HTA11_696_2000001011 | Human | Colorectum | AD | 3.44e-14 | 7.66e-01 | -0.1464 |
| 6548 | SLC9A1 | HTA11_866_2000001011 | Human | Colorectum | AD | 9.65e-03 | 2.88e-01 | -0.1001 |
| 6548 | SLC9A1 | HTA11_1391_2000001011 | Human | Colorectum | AD | 7.84e-07 | 5.16e-01 | -0.059 |
| 6548 | SLC9A1 | HTA11_5212_2000001011 | Human | Colorectum | AD | 1.93e-04 | 6.05e-01 | -0.2061 |
| 6548 | SLC9A1 | A015-C-203 | Human | Colorectum | FAP | 4.96e-03 | -1.14e-01 | -0.1294 |
| 6548 | SLC9A1 | A002-C-205 | Human | Colorectum | FAP | 1.88e-03 | -2.02e-01 | -0.1236 |
| 6548 | SLC9A1 | A015-C-104 | Human | Colorectum | FAP | 4.47e-08 | -2.17e-01 | -0.1899 |
| 6548 | SLC9A1 | A001-C-014 | Human | Colorectum | FAP | 1.98e-02 | -1.40e-01 | 0.0135 |
| 6548 | SLC9A1 | CRC-1-8810 | Human | Colorectum | CRC | 3.16e-03 | -1.69e-01 | 0.6257 |
| 6548 | SLC9A1 | LZE7T | Human | Esophagus | ESCC | 1.80e-03 | 1.43e-01 | 0.0667 |
| 6548 | SLC9A1 | LZE20T | Human | Esophagus | ESCC | 2.44e-07 | 1.54e-01 | 0.0662 |
| 6548 | SLC9A1 | LZE24T | Human | Esophagus | ESCC | 2.29e-10 | 2.39e-01 | 0.0596 |
| 6548 | SLC9A1 | P1T-E | Human | Esophagus | ESCC | 2.69e-04 | 3.52e-01 | 0.0875 |
| Page: 1 2 3 4 5 |
| Tissue | Expression Dynamics | Abbreviation |
| Colorectum (GSE201348) |  | FAP: Familial adenomatous polyposis |
| CRC: Colorectal cancer | ||
| Colorectum (HTA11) |  | AD: Adenomas |
| SER: Sessile serrated lesions | ||
| MSI-H: Microsatellite-high colorectal cancer | ||
| MSS: Microsatellite stable colorectal cancer | ||
| Esophagus | 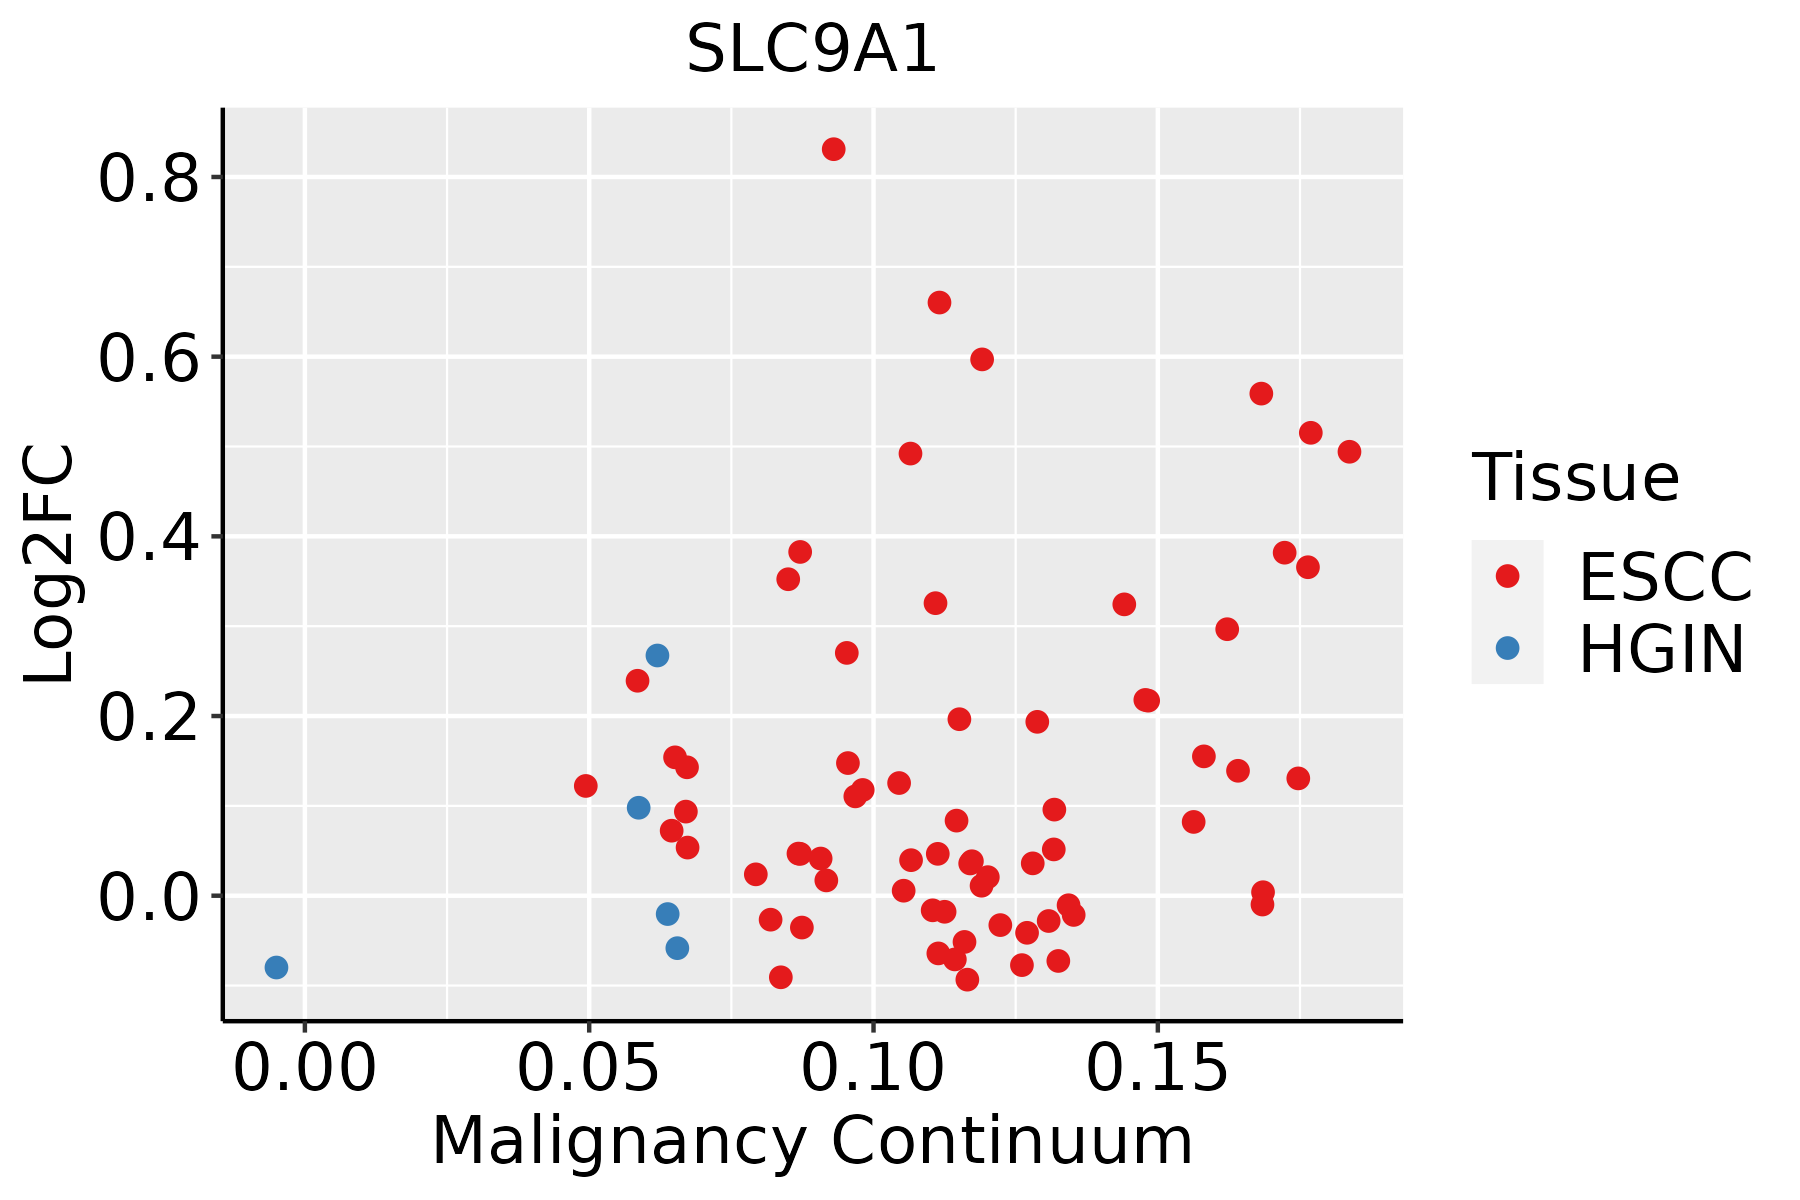 | ESCC: Esophageal squamous cell carcinoma |
| HGIN: High-grade intraepithelial neoplasias | ||
| LGIN: Low-grade intraepithelial neoplasias | ||
| GC | 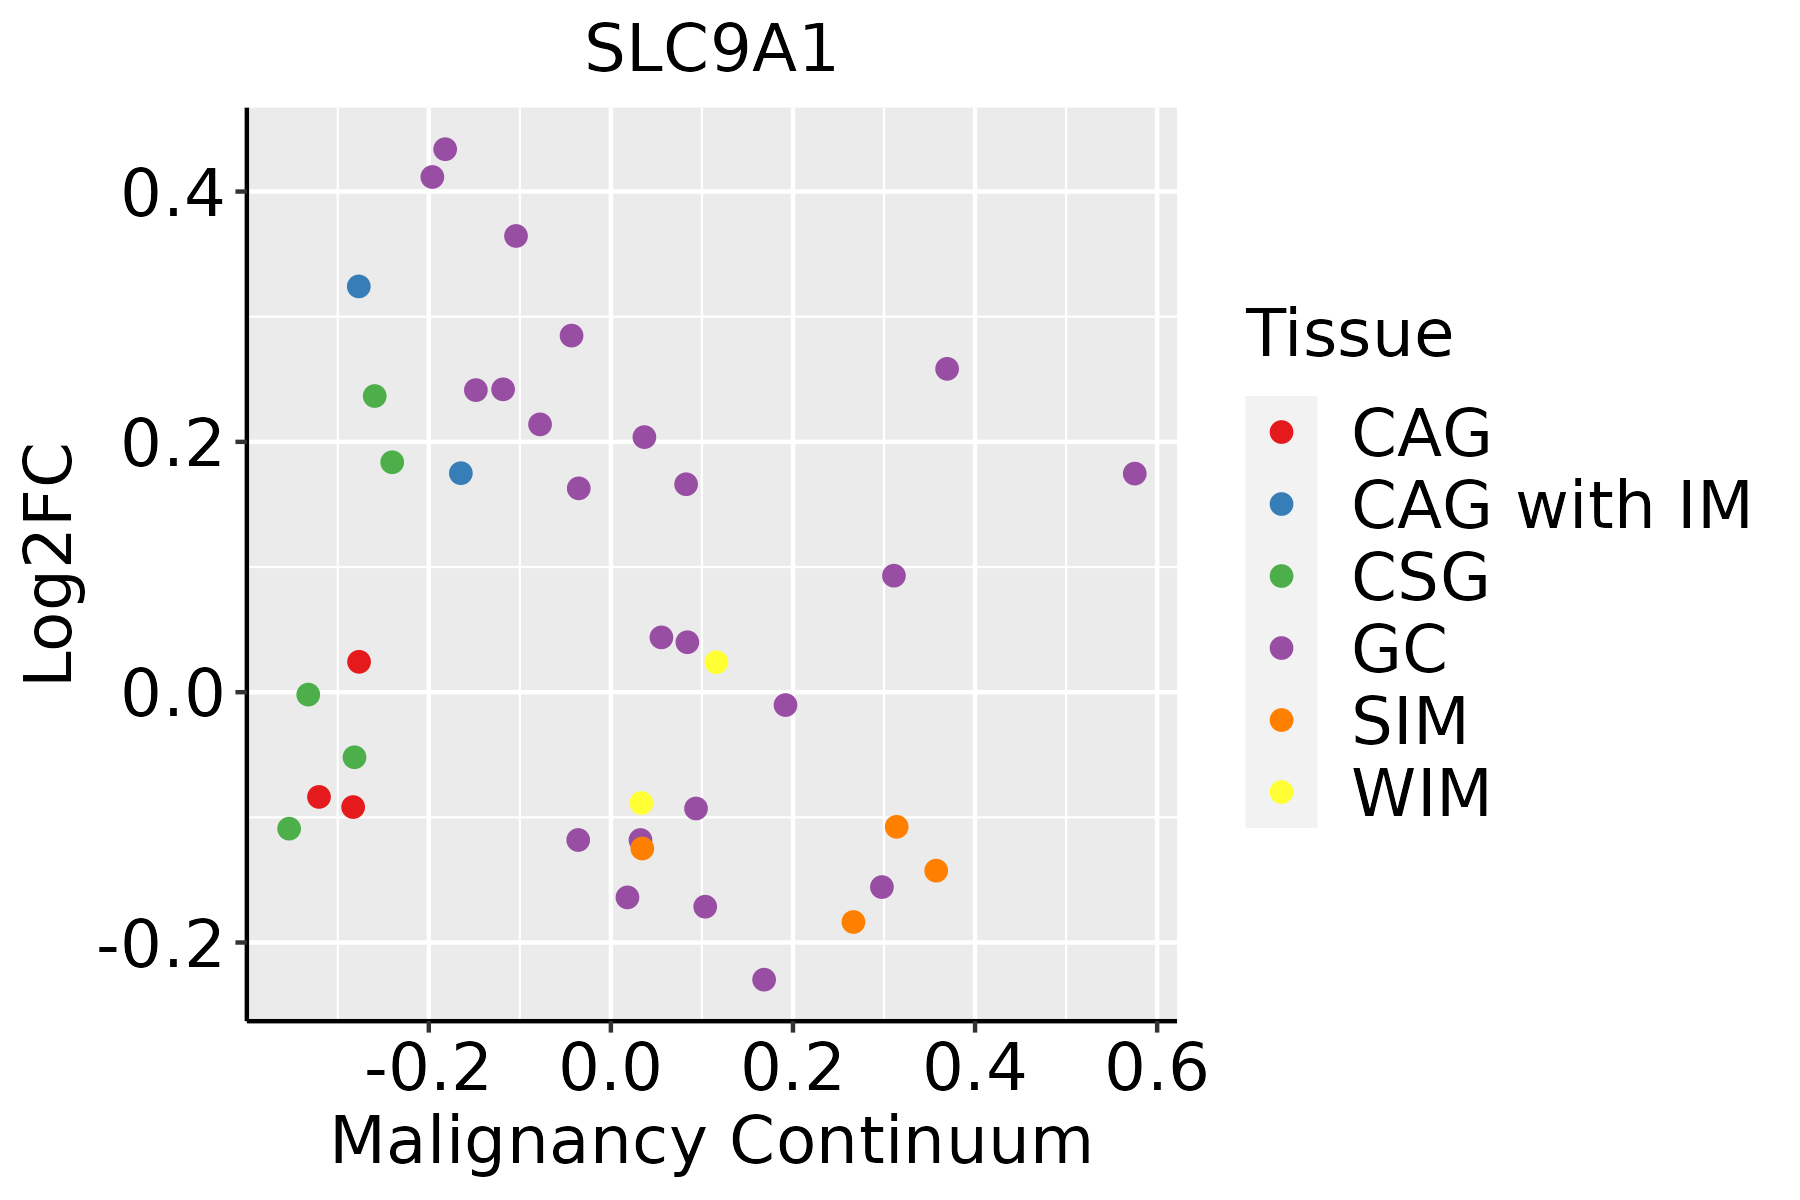 | CAG: Chronic atrophic gastritis |
| CAG with IM: Chronic atrophic gastritis with intestinal metaplasia | ||
| CSG: Chronic superficial gastritis | ||
| GC: Gastric cancer | ||
| SIM: Severe intestinal metaplasia | ||
| WIM: Wild intestinal metaplasia | ||
| Lung | 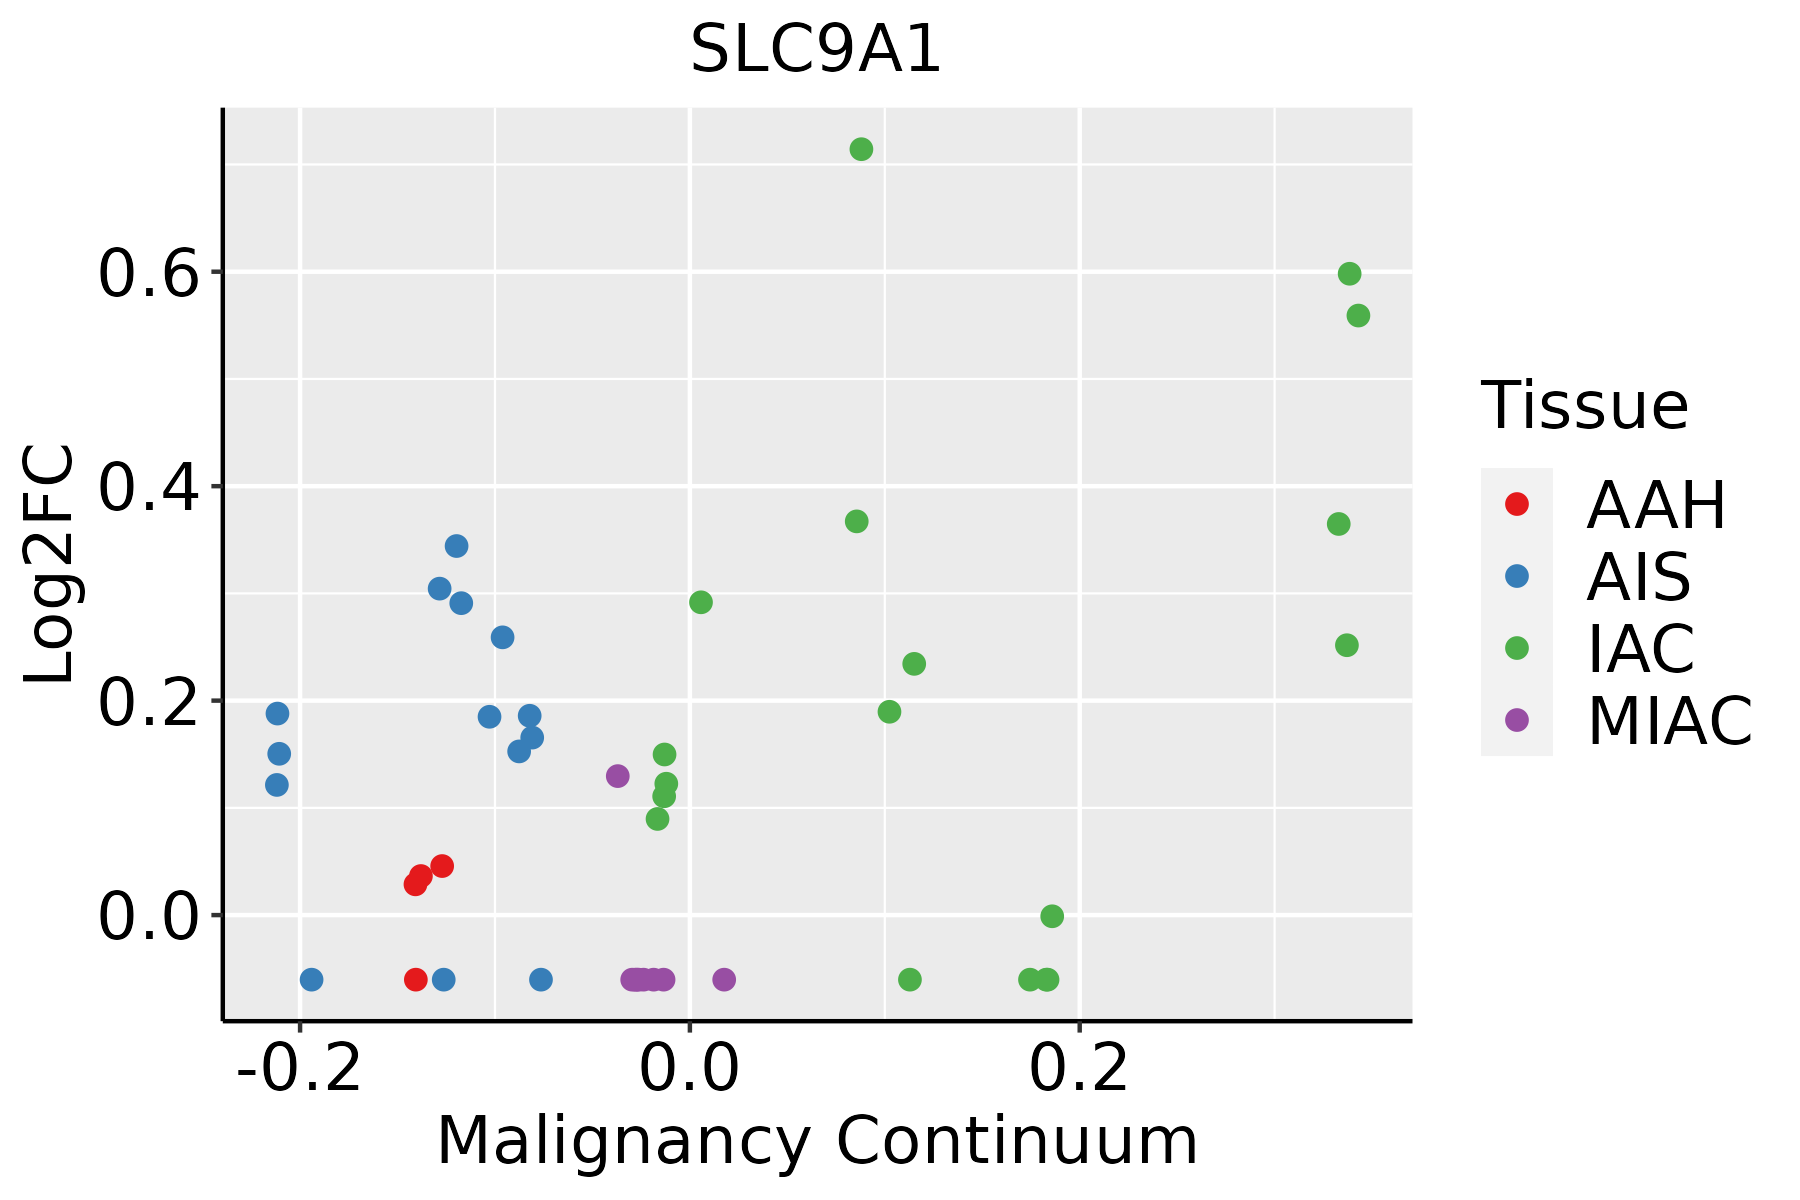 | AAH: Atypical adenomatous hyperplasia |
| AIS: Adenocarcinoma in situ | ||
| IAC: Invasive lung adenocarcinoma | ||
| MIA: Minimally invasive adenocarcinoma | ||
| Oral Cavity | 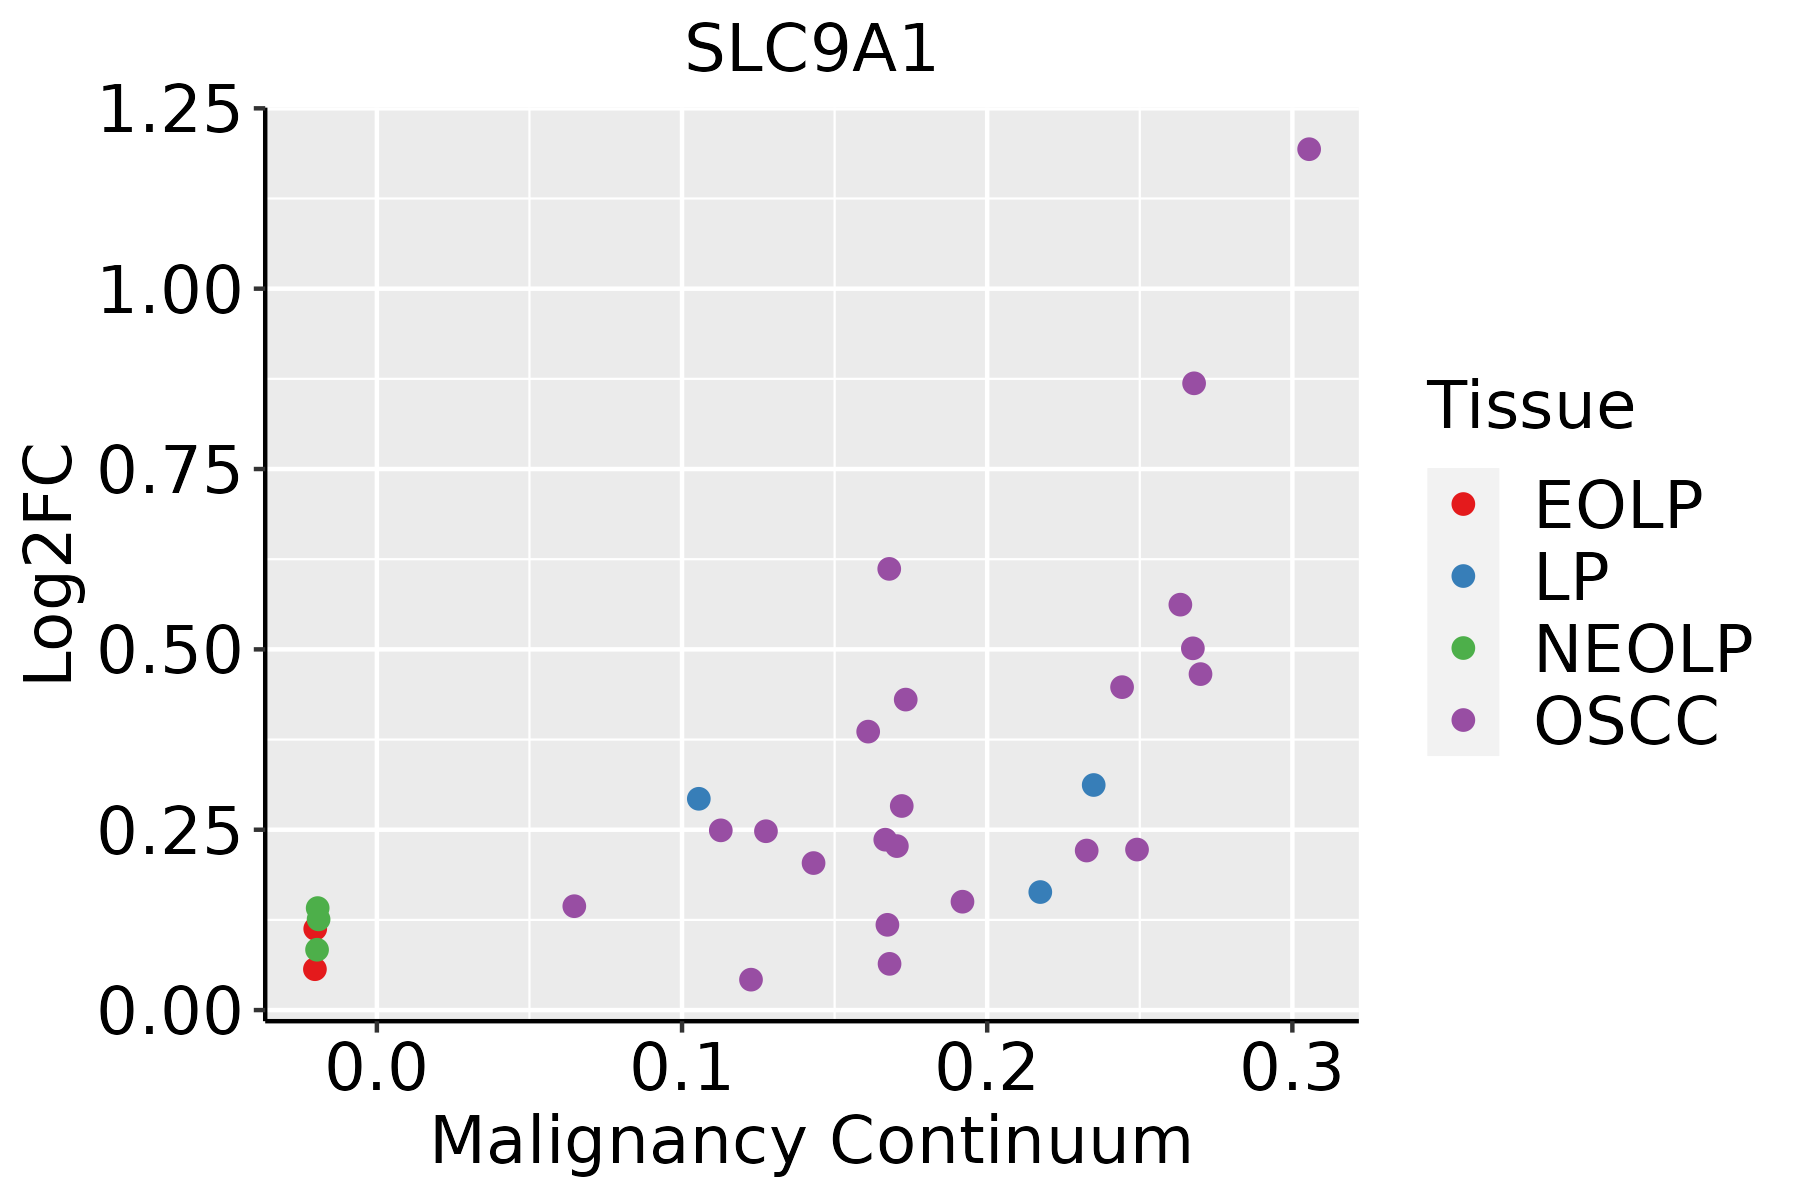 | EOLP: Erosive Oral lichen planus |
| LP: leukoplakia | ||
| NEOLP: Non-erosive oral lichen planus | ||
| OSCC: Oral squamous cell carcinoma |
| ∗log2FC in expression of this searched gene in stem-like cells from each diseased tissue sample relative to stem-like cells in normal samples in each tissue plotted against the malignancy continuum. Samples are colored based on if they are from different disease stage. |
Top |
Malignant transformation related pathway analysis |
| Find out the enriched GO biological processes and KEGG pathways involved in transition from healthy to precancer to cancer |
| Tissue | Disease Stage | Enriched GO biological Processes |
| Colorectum | AD |  |
| Colorectum | SER |  |
| Colorectum | MSS |  |
| Colorectum | MSI-H |  |
| Colorectum | FAP |  |
| ∗Top 15 enriched GO BP terms are showed in the bar plot of each disease state in each tissue. Each row represents a significant GO biological process which is colored according to the -log10(p.adjust). |
| Page: 1 2 3 4 5 6 7 8 9 |
| GO ID | Tissue | Disease Stage | Description | Gene Ratio | Bg Ratio | pvalue | p.adjust | Count |
| GO:009010911 | Stomach | CSG | regulation of cell-substrate junction assembly | 10/1034 | 66/18723 | 3.18e-03 | 2.92e-02 | 10 |
| GO:007048221 | Stomach | CSG | response to oxygen levels | 32/1034 | 347/18723 | 3.20e-03 | 2.92e-02 | 32 |
| GO:009025711 | Stomach | CSG | regulation of muscle system process | 25/1034 | 252/18723 | 3.39e-03 | 3.06e-02 | 25 |
| GO:000166621 | Stomach | CSG | response to hypoxia | 29/1034 | 307/18723 | 3.46e-03 | 3.12e-02 | 29 |
| GO:003432921 | Stomach | CSG | cell junction assembly | 37/1034 | 420/18723 | 3.50e-03 | 3.15e-02 | 37 |
| GO:00109592 | Stomach | CSG | regulation of metal ion transport | 36/1034 | 406/18723 | 3.54e-03 | 3.18e-02 | 36 |
| GO:00069373 | Stomach | CSG | regulation of muscle contraction | 18/1034 | 169/18723 | 5.77e-03 | 4.59e-02 | 18 |
| GO:00712361 | Stomach | CSG | cellular response to antibiotic | 4/1034 | 14/18723 | 5.93e-03 | 4.66e-02 | 4 |
| GO:00069421 | Stomach | CSG | regulation of striated muscle contraction | 12/1034 | 95/18723 | 6.01e-03 | 4.70e-02 | 12 |
| Page: 1 2 3 4 5 6 7 8 9 10 11 12 13 14 15 16 17 18 19 20 21 22 23 24 25 26 27 28 29 30 31 32 33 |
| Pathway ID | Tissue | Disease Stage | Description | Gene Ratio | Bg Ratio | pvalue | p.adjust | qvalue | Count |
| hsa04919 | Colorectum | AD | Thyroid hormone signaling pathway | 51/2092 | 121/8465 | 1.71e-05 | 1.73e-04 | 1.10e-04 | 51 |
| hsa05205 | Colorectum | AD | Proteoglycans in cancer | 70/2092 | 205/8465 | 1.37e-03 | 8.46e-03 | 5.39e-03 | 70 |
| hsa04810 | Colorectum | AD | Regulation of actin cytoskeleton | 75/2092 | 229/8465 | 3.36e-03 | 1.76e-02 | 1.12e-02 | 75 |
| hsa04971 | Colorectum | AD | Gastric acid secretion | 29/2092 | 76/8465 | 6.25e-03 | 2.68e-02 | 1.71e-02 | 29 |
| hsa04260 | Colorectum | AD | Cardiac muscle contraction | 32/2092 | 87/8465 | 7.92e-03 | 3.13e-02 | 2.00e-02 | 32 |
| hsa04972 | Colorectum | AD | Pancreatic secretion | 36/2092 | 102/8465 | 1.06e-02 | 3.98e-02 | 2.54e-02 | 36 |
| hsa049191 | Colorectum | AD | Thyroid hormone signaling pathway | 51/2092 | 121/8465 | 1.71e-05 | 1.73e-04 | 1.10e-04 | 51 |
| hsa052051 | Colorectum | AD | Proteoglycans in cancer | 70/2092 | 205/8465 | 1.37e-03 | 8.46e-03 | 5.39e-03 | 70 |
| hsa048101 | Colorectum | AD | Regulation of actin cytoskeleton | 75/2092 | 229/8465 | 3.36e-03 | 1.76e-02 | 1.12e-02 | 75 |
| hsa049711 | Colorectum | AD | Gastric acid secretion | 29/2092 | 76/8465 | 6.25e-03 | 2.68e-02 | 1.71e-02 | 29 |
| hsa042601 | Colorectum | AD | Cardiac muscle contraction | 32/2092 | 87/8465 | 7.92e-03 | 3.13e-02 | 2.00e-02 | 32 |
| hsa049721 | Colorectum | AD | Pancreatic secretion | 36/2092 | 102/8465 | 1.06e-02 | 3.98e-02 | 2.54e-02 | 36 |
| hsa049192 | Colorectum | SER | Thyroid hormone signaling pathway | 40/1580 | 121/8465 | 1.02e-04 | 1.06e-03 | 7.67e-04 | 40 |
| hsa042602 | Colorectum | SER | Cardiac muscle contraction | 31/1580 | 87/8465 | 1.30e-04 | 1.30e-03 | 9.47e-04 | 31 |
| hsa049712 | Colorectum | SER | Gastric acid secretion | 27/1580 | 76/8465 | 3.65e-04 | 3.27e-03 | 2.38e-03 | 27 |
| hsa052052 | Colorectum | SER | Proteoglycans in cancer | 58/1580 | 205/8465 | 4.37e-04 | 3.82e-03 | 2.77e-03 | 58 |
| hsa048102 | Colorectum | SER | Regulation of actin cytoskeleton | 60/1580 | 229/8465 | 2.74e-03 | 2.02e-02 | 1.47e-02 | 60 |
| hsa049722 | Colorectum | SER | Pancreatic secretion | 30/1580 | 102/8465 | 5.41e-03 | 3.28e-02 | 2.38e-02 | 30 |
| hsa049193 | Colorectum | SER | Thyroid hormone signaling pathway | 40/1580 | 121/8465 | 1.02e-04 | 1.06e-03 | 7.67e-04 | 40 |
| hsa042603 | Colorectum | SER | Cardiac muscle contraction | 31/1580 | 87/8465 | 1.30e-04 | 1.30e-03 | 9.47e-04 | 31 |
| Page: 1 2 3 4 5 |
Top |
Cell-cell communication analysis |
| Identification of potential cell-cell interactions between two cell types and their ligand-receptor pairs for different disease states |
| Ligand | Receptor | LRpair | Pathway | Tissue | Disease Stage |
| Page: 1 |
Top |
Single-cell gene regulatory network inference analysis |
| Find out the significant the regulons (TFs) and the target genes of each regulon across cell types for different disease states |
| TF | Cell Type | Tissue | Disease Stage | Target Gene | RSS | Regulon Activity |
| ∗The dot plots of a searched regulon are shown for all cell subpopulations in each disease state of each tissue based on the regulon specific score inferred using pySCENIC and by calculating the average expression. |
| Page: 1 |
Top |
Somatic mutation of malignant transformation related genes |
| Annotation of somatic variants for genes involved in malignant transformation |
| Hugo Symbol | Variant Class | Variant Classification | dbSNP RS | HGVSc | HGVSp | HGVSp Short | SWISSPROT | BIOTYPE | SIFT | PolyPhen | Tumor Sample Barcode | Tissue | Histology | Sex | Age | Stage | Therapy Types | Drugs | Outcome |
| SLC9A1 | SNV | Missense_Mutation | c.17N>A | p.Gly6Asp | p.G6D | P19634 | protein_coding | deleterious_low_confidence(0) | possibly_damaging(0.672) | TCGA-BH-A0HF-01 | Breast | breast invasive carcinoma | Female | >=65 | I/II | Hormone Therapy | arimidex | SD | |
| SLC9A1 | SNV | Missense_Mutation | novel | c.1710G>T | p.Glu570Asp | p.E570D | P19634 | protein_coding | deleterious(0.02) | benign(0.119) | TCGA-C8-A1HK-01 | Breast | breast invasive carcinoma | Female | <65 | I/II | Unknown | Unknown | SD |
| SLC9A1 | SNV | Missense_Mutation | c.2054N>A | p.Thr685Lys | p.T685K | P19634 | protein_coding | deleterious(0.01) | benign(0.042) | TCGA-E2-A1IK-01 | Breast | breast invasive carcinoma | Female | >=65 | I/II | Hormone Therapy | arimidex | SD | |
| SLC9A1 | insertion | In_Frame_Ins | novel | c.984_985insTTTGGGAGG | p.Val328_Ile329insPheGlyArg | p.V328_I329insFGR | P19634 | protein_coding | TCGA-AN-A0AL-01 | Breast | breast invasive carcinoma | Female | <65 | III/IV | Unknown | Unknown | SD | ||
| SLC9A1 | insertion | Frame_Shift_Ins | novel | c.983_984insGGCTCACGCCTGTAATCCCAGCA | p.Ile329AlafsTer37 | p.I329Afs*37 | P19634 | protein_coding | TCGA-AN-A0AL-01 | Breast | breast invasive carcinoma | Female | <65 | III/IV | Unknown | Unknown | SD | ||
| SLC9A1 | deletion | Frame_Shift_Del | c.431delN | p.Gly144AlafsTer2 | p.G144Afs*2 | P19634 | protein_coding | TCGA-BH-A0HA-01 | Breast | breast invasive carcinoma | Female | <65 | I/II | Unknown | Unknown | SD | |||
| SLC9A1 | SNV | Missense_Mutation | novel | c.134C>T | p.Thr45Ile | p.T45I | P19634 | protein_coding | deleterious_low_confidence(0.03) | benign(0) | TCGA-2W-A8YY-01 | Cervix | cervical & endocervical cancer | Female | <65 | I/II | Chemotherapy | cisplatin | CR |
| SLC9A1 | SNV | Missense_Mutation | rs556347900 | c.2342N>T | p.Ala781Val | p.A781V | P19634 | protein_coding | deleterious(0.03) | benign(0.03) | TCGA-BI-A0VS-01 | Cervix | cervical & endocervical cancer | Female | <65 | I/II | Unknown | Unknown | SD |
| SLC9A1 | SNV | Missense_Mutation | novel | c.294N>A | p.His98Gln | p.H98Q | P19634 | protein_coding | deleterious(0.01) | possibly_damaging(0.612) | TCGA-C5-A8YT-01 | Cervix | cervical & endocervical cancer | Female | <65 | I/II | Chemotherapy | cisplatin | PD |
| SLC9A1 | SNV | Missense_Mutation | c.487N>T | p.Leu163Phe | p.L163F | P19634 | protein_coding | deleterious(0.03) | benign(0.12) | TCGA-EX-A69M-01 | Cervix | cervical & endocervical cancer | Female | <65 | I/II | Unknown | Unknown | PD |
| Page: 1 2 3 4 5 6 7 8 9 |
Top |
Related drugs of malignant transformation related genes |
| Identification of chemicals and drugs interact with genes involved in malignant transfromation |
| (DGIdb 4.0) |
| Entrez ID | Symbol | Category | Interaction Types | Drug Claim Name | Drug Name | PMIDs |
| 6548 | SLC9A1 | TRANSPORTER, DRUGGABLE GENOME, EXCHANGER, CELL SURFACE | CARIPORIDE | CARIPORIDE | 17493937 | |
| 6548 | SLC9A1 | TRANSPORTER, DRUGGABLE GENOME, EXCHANGER, CELL SURFACE | Zoniporide hydrochloride | |||
| 6548 | SLC9A1 | TRANSPORTER, DRUGGABLE GENOME, EXCHANGER, CELL SURFACE | HOE-694 | CHEMBL62231 | 17493937 |
| Page: 1 |

Copyright 2023-Present -The University of Texas Health Science Center at Houston |