
|
|||||
|
 | |
| |
| |
| |
| |
| |
|
Gene: PTTG1 |
Gene summary for PTTG1 |
| Gene information | Species | Human | Gene symbol | PTTG1 | Gene ID | 9232 |
| Gene name | PTTG1 regulator of sister chromatid separation, securin | |
| Gene Alias | EAP1 | |
| Cytomap | 5q33.3 | |
| Gene Type | protein-coding | GO ID | GO:0000003 | UniProtAcc | O95997 |
Top |
Malignant transformation analysis |
| Identification of the aberrant gene expression in precancerous and cancerous lesions by comparing the gene expression of stem-like cells in diseased tissues with normal stem cells |
| Entrez ID | Symbol | Replicates | Species | Organ | Tissue | Adj P-value | Log2FC | Malignancy |
| 9232 | PTTG1 | GSM4909281 | Human | Breast | IDC | 4.73e-09 | 4.09e-01 | 0.21 |
| 9232 | PTTG1 | GSM4909282 | Human | Breast | IDC | 1.51e-30 | 6.71e-01 | -0.0288 |
| 9232 | PTTG1 | GSM4909285 | Human | Breast | IDC | 1.11e-16 | 4.70e-01 | 0.21 |
| 9232 | PTTG1 | GSM4909287 | Human | Breast | IDC | 3.85e-08 | 4.19e-01 | 0.2057 |
| 9232 | PTTG1 | GSM4909311 | Human | Breast | IDC | 3.11e-02 | -1.12e-01 | 0.1534 |
| 9232 | PTTG1 | GSM4909319 | Human | Breast | IDC | 1.35e-06 | 6.14e-02 | 0.1563 |
| 9232 | PTTG1 | M2 | Human | Breast | IDC | 1.92e-02 | 3.59e-01 | 0.21 |
| 9232 | PTTG1 | NCCBC5 | Human | Breast | DCIS | 5.07e-04 | 3.19e-01 | 0.2046 |
| 9232 | PTTG1 | P1 | Human | Breast | IDC | 8.01e-05 | 2.28e-01 | 0.1527 |
| 9232 | PTTG1 | P2 | Human | Breast | IDC | 8.53e-03 | 2.73e-01 | 0.21 |
| 9232 | PTTG1 | LZE2T | Human | Esophagus | ESCC | 1.01e-05 | 1.68e+00 | 0.082 |
| 9232 | PTTG1 | LZE4T | Human | Esophagus | ESCC | 2.71e-08 | 6.88e-01 | 0.0811 |
| 9232 | PTTG1 | LZE7T | Human | Esophagus | ESCC | 4.27e-02 | 4.34e-01 | 0.0667 |
| 9232 | PTTG1 | LZE20T | Human | Esophagus | ESCC | 3.28e-03 | 6.01e-01 | 0.0662 |
| 9232 | PTTG1 | LZE22D1 | Human | Esophagus | HGIN | 6.50e-05 | 1.94e-01 | 0.0595 |
| 9232 | PTTG1 | LZE6T | Human | Esophagus | ESCC | 9.30e-20 | 1.51e+00 | 0.0845 |
| 9232 | PTTG1 | P2T-E | Human | Esophagus | ESCC | 3.51e-22 | 1.48e+00 | 0.1177 |
| 9232 | PTTG1 | P4T-E | Human | Esophagus | ESCC | 2.70e-38 | 1.67e+00 | 0.1323 |
| 9232 | PTTG1 | P5T-E | Human | Esophagus | ESCC | 2.19e-62 | 2.12e+00 | 0.1327 |
| 9232 | PTTG1 | P9T-E | Human | Esophagus | ESCC | 2.15e-25 | 1.44e+00 | 0.1131 |
| Page: 1 2 3 4 5 6 7 |
| Tissue | Expression Dynamics | Abbreviation |
| Breast | 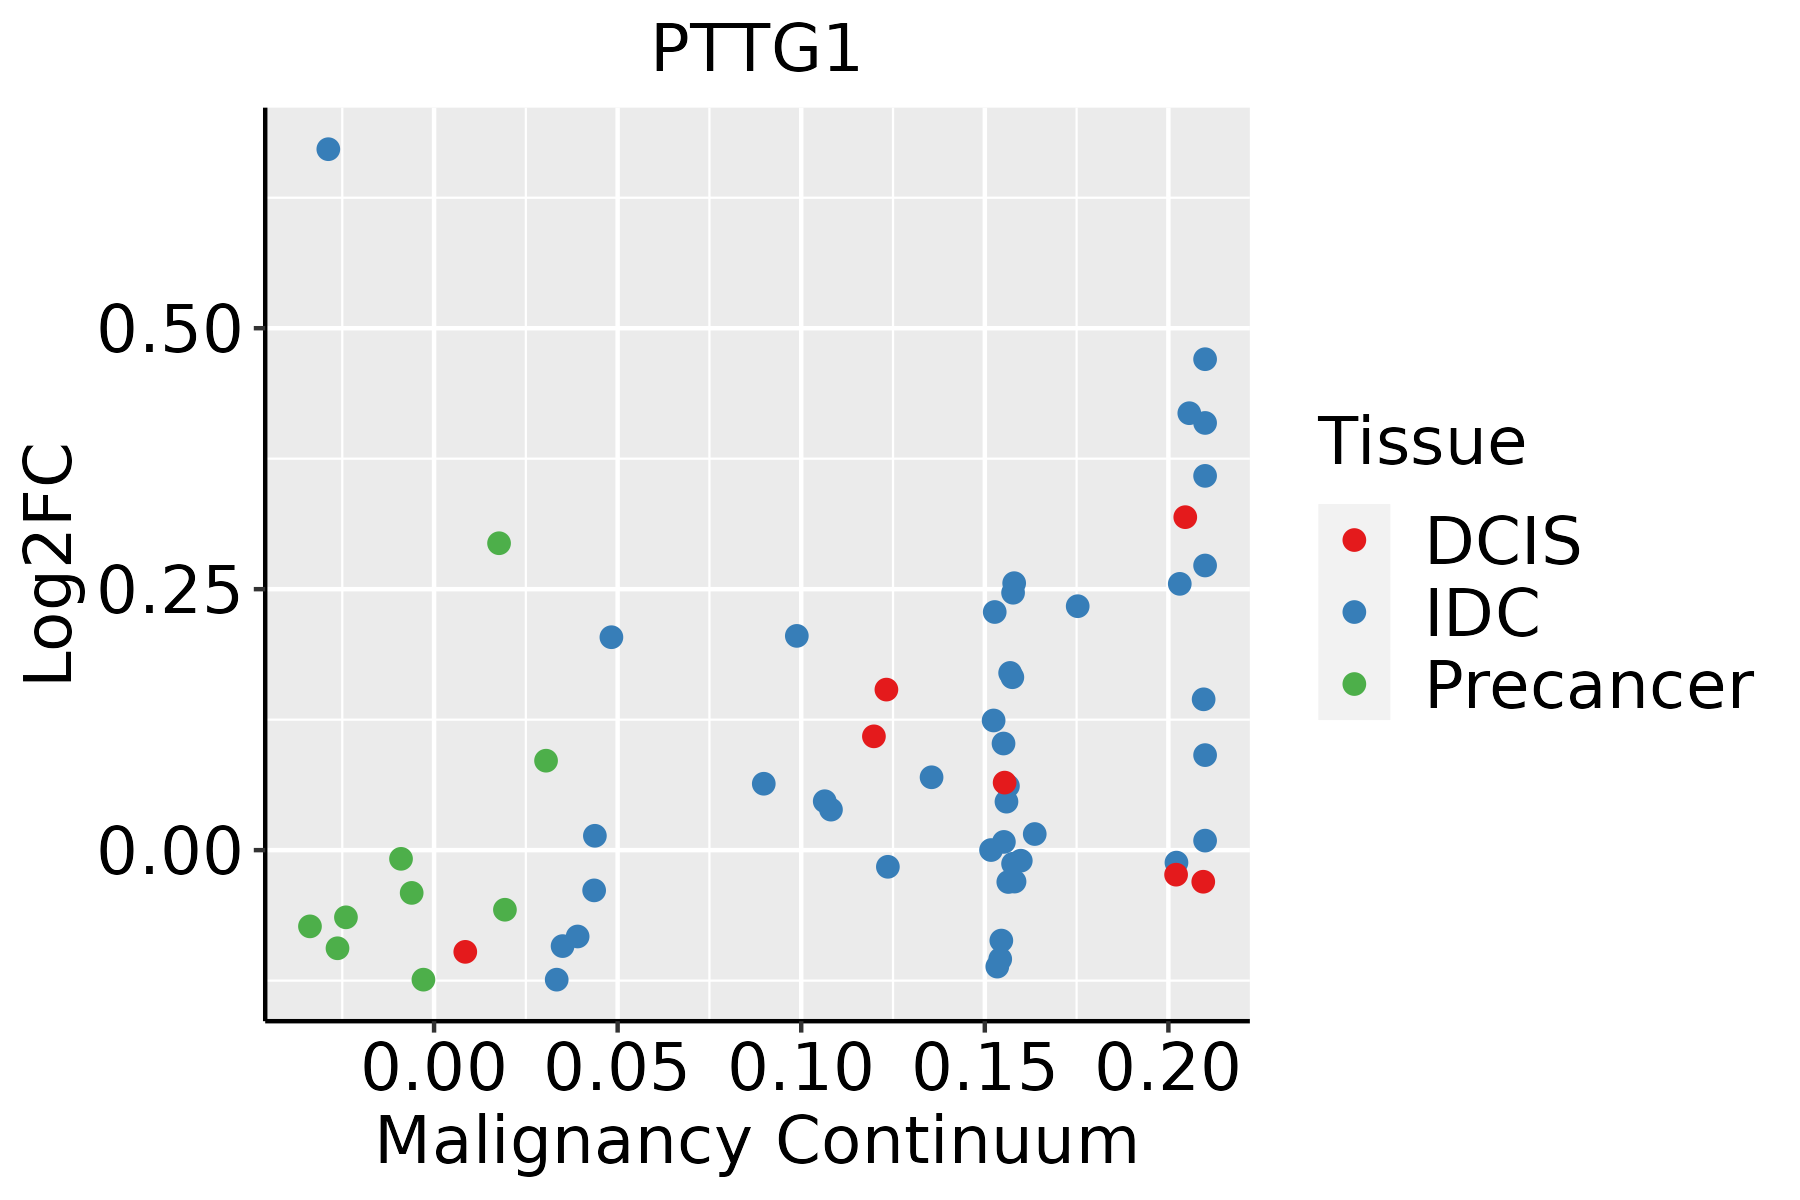 | IDC: Invasive ductal carcinoma |
| DCIS: Ductal carcinoma in situ | ||
| Precancer(BRCA1-mut): Precancerous lesion from BRCA1 mutation carriers | ||
| Esophagus | 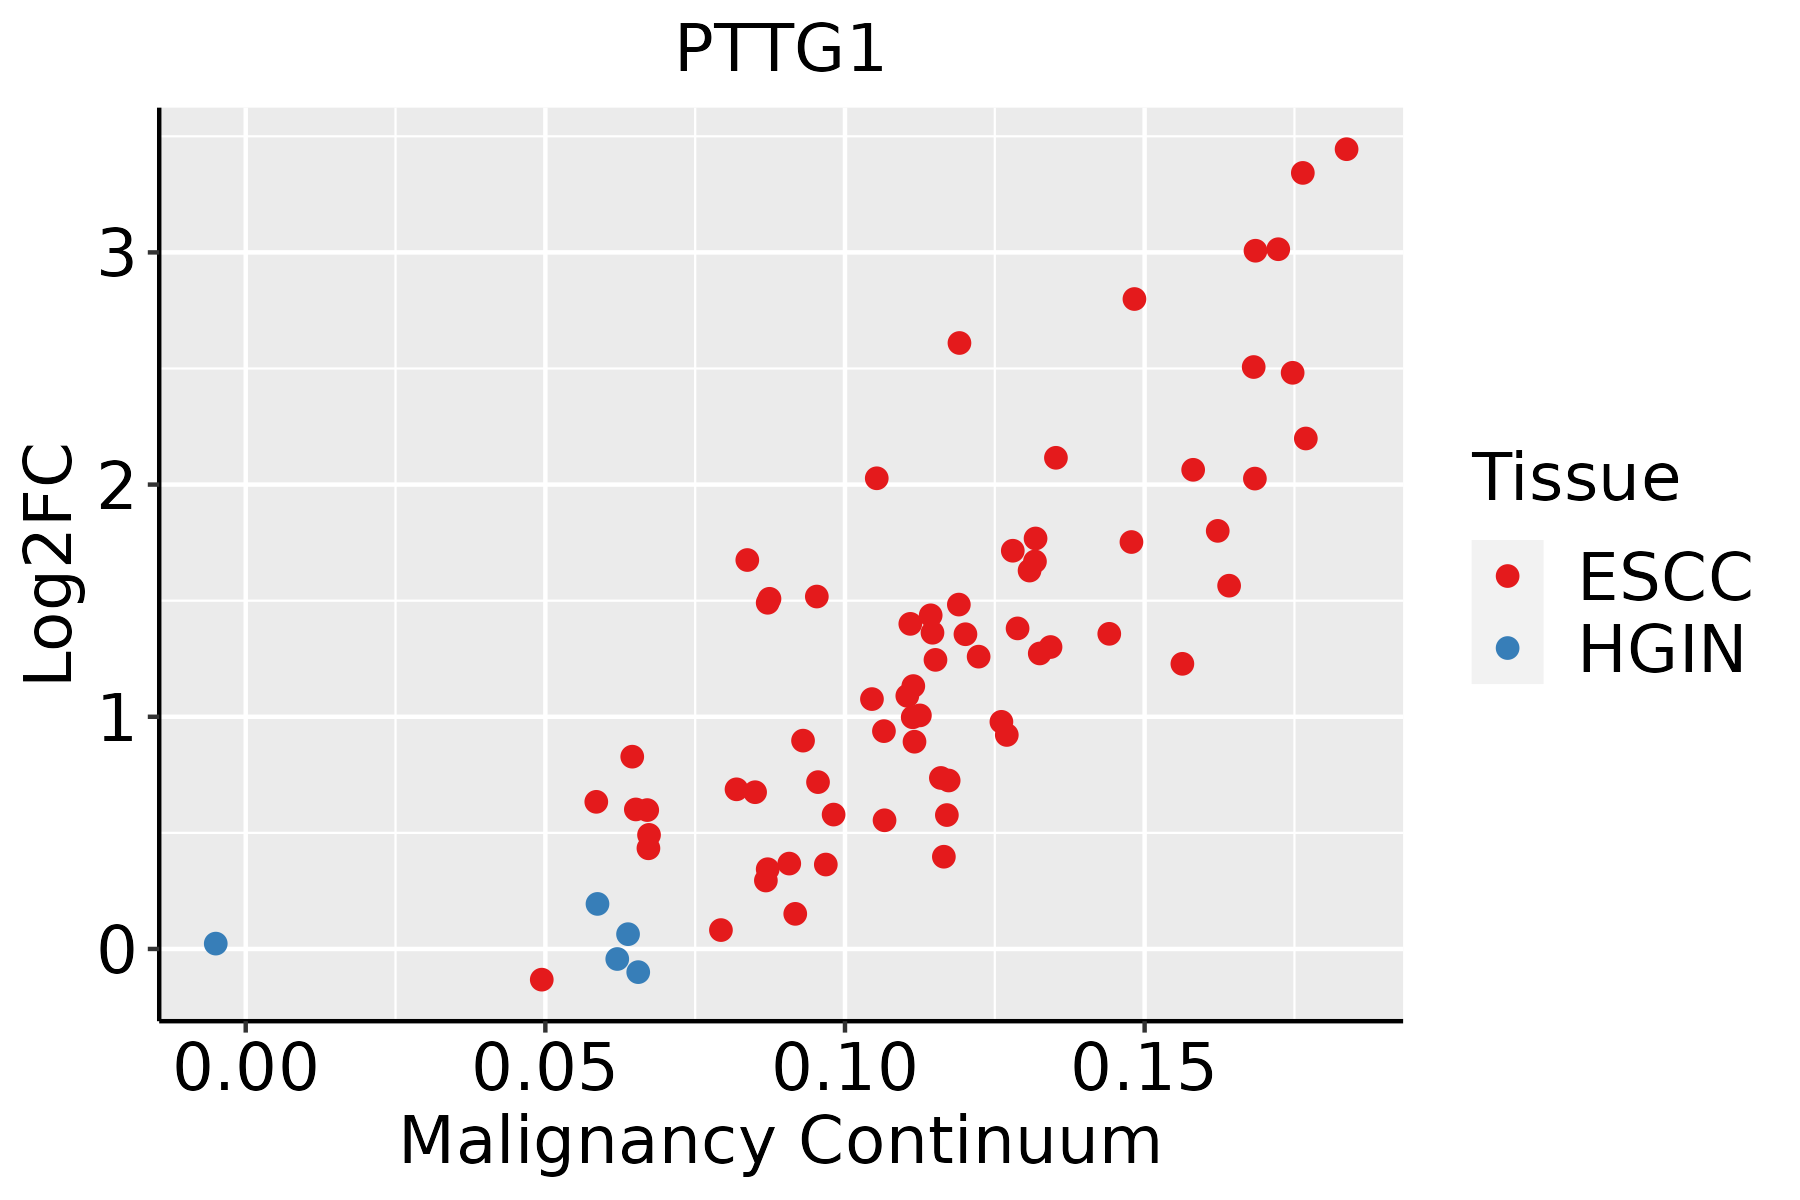 | ESCC: Esophageal squamous cell carcinoma |
| HGIN: High-grade intraepithelial neoplasias | ||
| LGIN: Low-grade intraepithelial neoplasias | ||
| Liver | 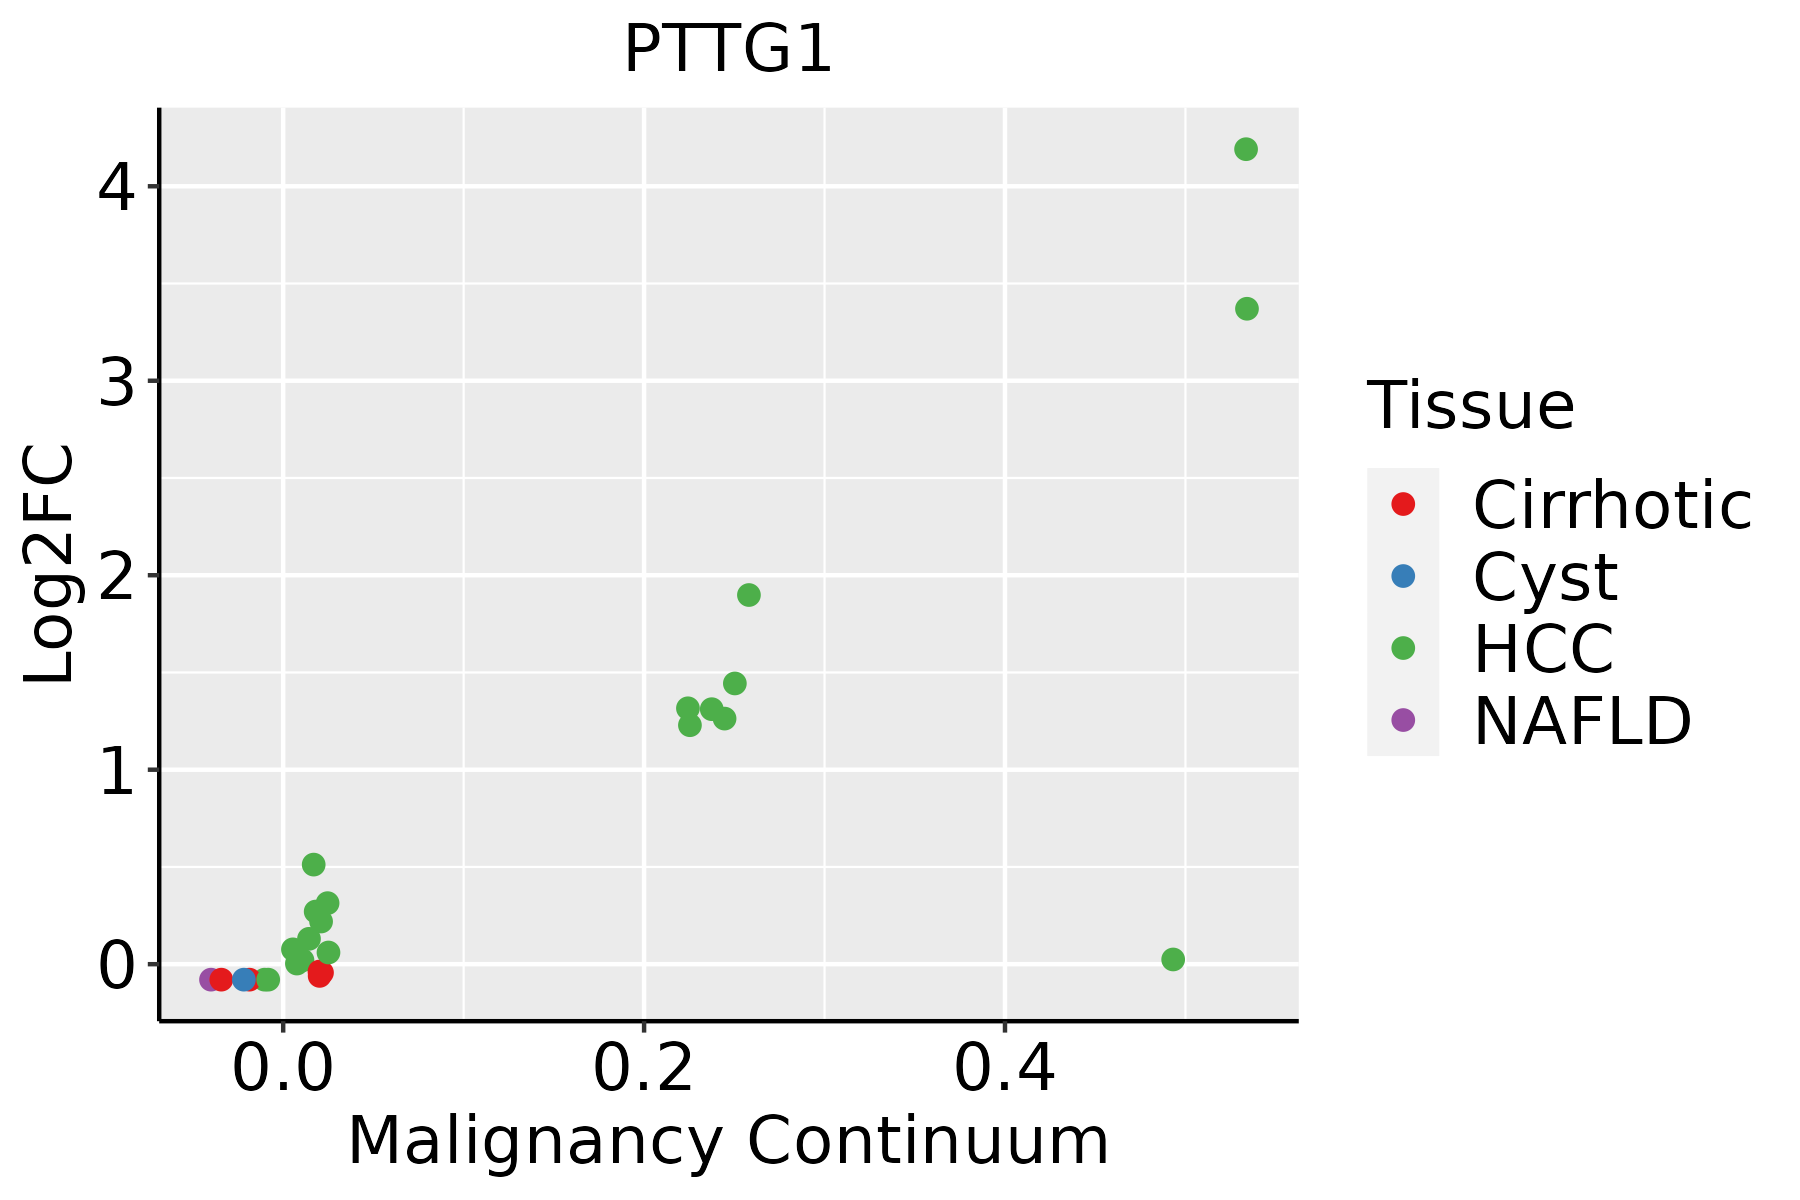 | HCC: Hepatocellular carcinoma |
| NAFLD: Non-alcoholic fatty liver disease | ||
| Oral Cavity | 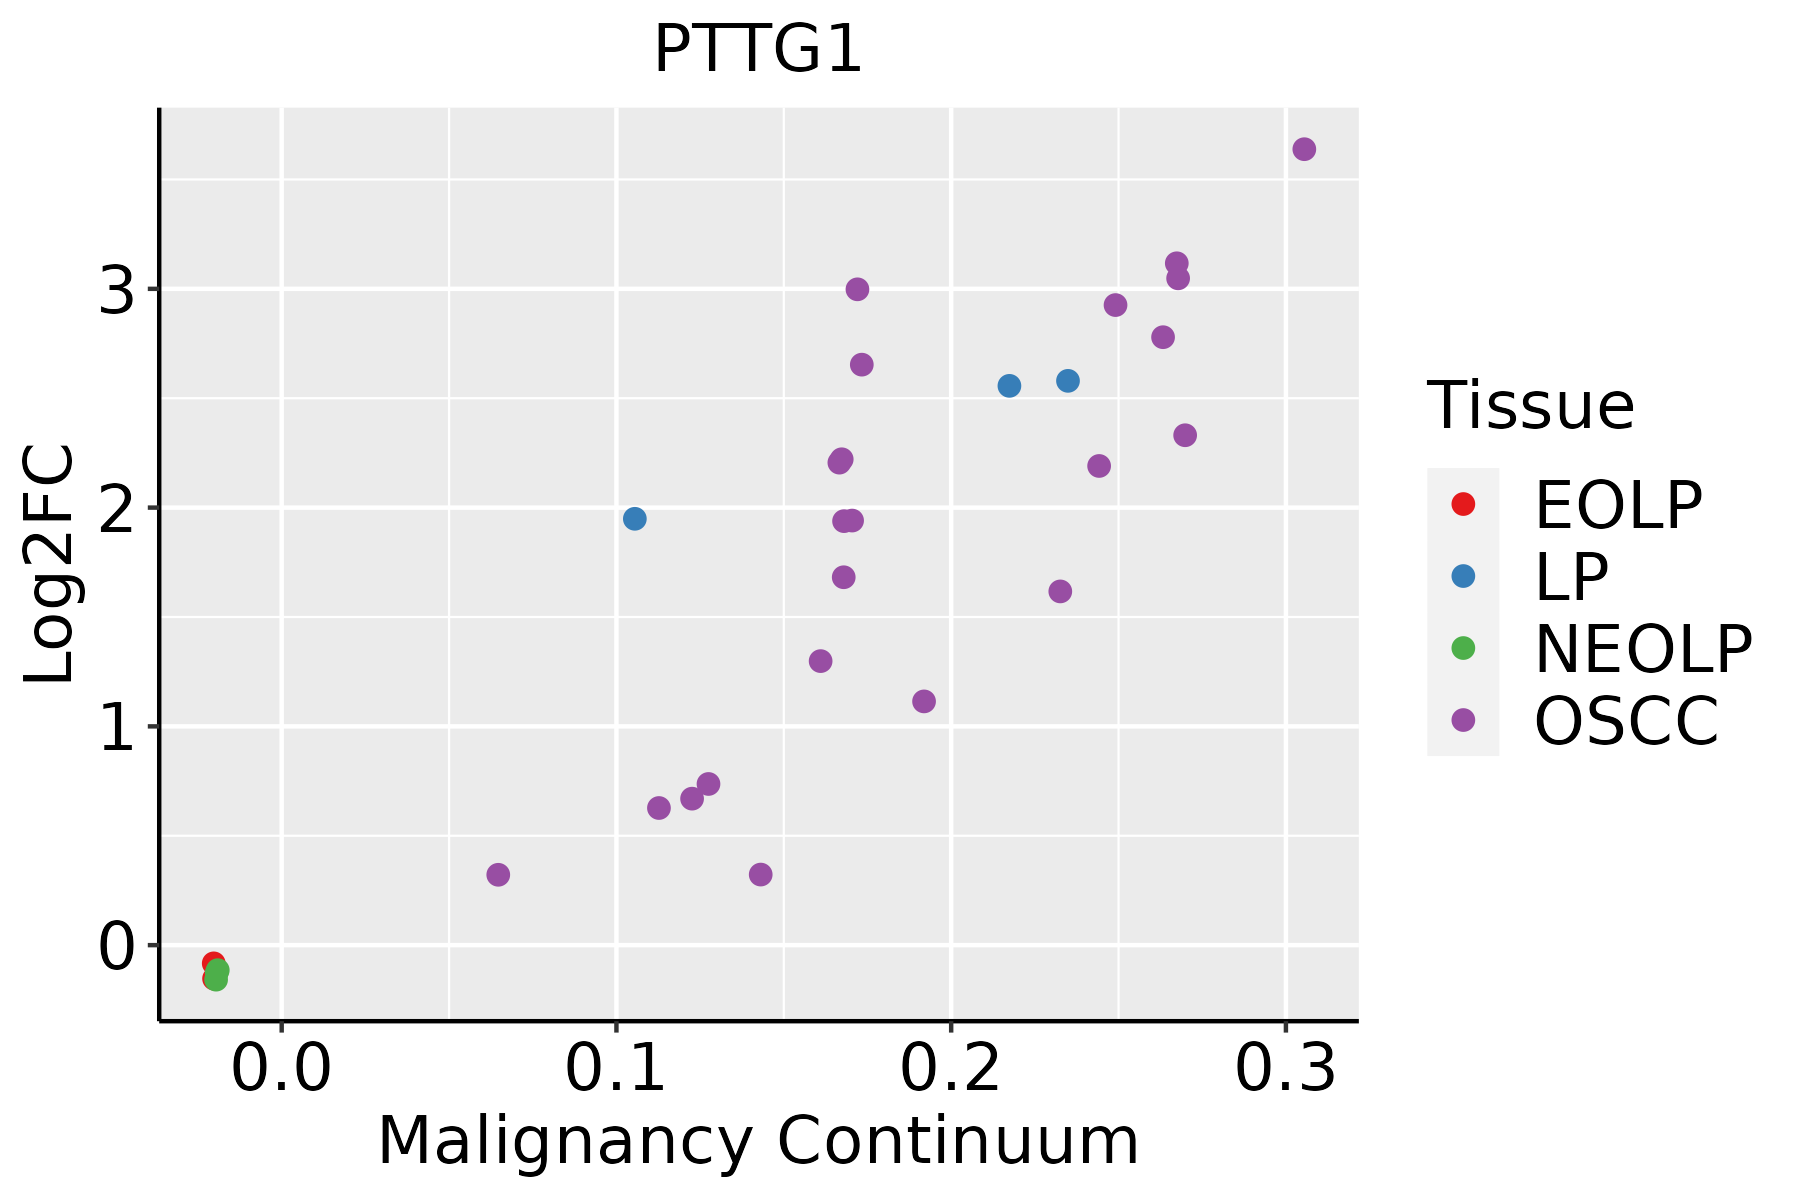 | EOLP: Erosive Oral lichen planus |
| LP: leukoplakia | ||
| NEOLP: Non-erosive oral lichen planus | ||
| OSCC: Oral squamous cell carcinoma | ||
| Skin |  | AK: Actinic keratosis |
| cSCC: Cutaneous squamous cell carcinoma | ||
| SCCIS:squamous cell carcinoma in situ | ||
| Thyroid |  | ATC: Anaplastic thyroid cancer |
| HT: Hashimoto's thyroiditis | ||
| PTC: Papillary thyroid cancer |
| ∗log2FC in expression of this searched gene in stem-like cells from each diseased tissue sample relative to stem-like cells in normal samples in each tissue plotted against the malignancy continuum. Samples are colored based on if they are from different disease stage. |
Top |
Malignant transformation related pathway analysis |
| Find out the enriched GO biological processes and KEGG pathways involved in transition from healthy to precancer to cancer |
| Tissue | Disease Stage | Enriched GO biological Processes |
| Colorectum | AD |  |
| Colorectum | SER |  |
| Colorectum | MSS |  |
| Colorectum | MSI-H |  |
| Colorectum | FAP |  |
| ∗Top 15 enriched GO BP terms are showed in the bar plot of each disease state in each tissue. Each row represents a significant GO biological process which is colored according to the -log10(p.adjust). |
| Page: 1 2 3 4 5 6 7 8 9 |
| GO ID | Tissue | Disease Stage | Description | Gene Ratio | Bg Ratio | pvalue | p.adjust | Count |
| GO:004573229 | Skin | cSCC | positive regulation of protein catabolic process | 112/4864 | 231/18723 | 1.37e-13 | 8.40e-12 | 112 |
| GO:00482854 | Skin | cSCC | organelle fission | 197/4864 | 488/18723 | 1.51e-12 | 8.36e-11 | 197 |
| GO:0017038110 | Skin | cSCC | protein import | 100/4864 | 206/18723 | 2.50e-12 | 1.36e-10 | 100 |
| GO:009881311 | Skin | cSCC | nuclear chromosome segregation | 126/4864 | 281/18723 | 4.76e-12 | 2.53e-10 | 126 |
| GO:007233129 | Skin | cSCC | signal transduction by p53 class mediator | 83/4864 | 163/18723 | 7.71e-12 | 4.00e-10 | 83 |
| GO:00002803 | Skin | cSCC | nuclear division | 178/4864 | 439/18723 | 1.17e-11 | 5.93e-10 | 178 |
| GO:00519834 | Skin | cSCC | regulation of chromosome segregation | 52/4864 | 91/18723 | 2.88e-10 | 1.20e-08 | 52 |
| GO:200123429 | Skin | cSCC | negative regulation of apoptotic signaling pathway | 101/4864 | 224/18723 | 4.17e-10 | 1.70e-08 | 101 |
| GO:005117016 | Skin | cSCC | import into nucleus | 77/4864 | 159/18723 | 9.17e-10 | 3.58e-08 | 77 |
| GO:005254728 | Skin | cSCC | regulation of peptidase activity | 177/4864 | 461/18723 | 2.21e-09 | 8.02e-08 | 177 |
| GO:200124327 | Skin | cSCC | negative regulation of intrinsic apoptotic signaling pathway | 53/4864 | 98/18723 | 2.91e-09 | 1.02e-07 | 53 |
| GO:0010639111 | Skin | cSCC | negative regulation of organelle organization | 140/4864 | 348/18723 | 3.35e-09 | 1.15e-07 | 140 |
| GO:000660615 | Skin | cSCC | protein import into nucleus | 73/4864 | 155/18723 | 1.13e-08 | 3.48e-07 | 73 |
| GO:005254828 | Skin | cSCC | regulation of endopeptidase activity | 165/4864 | 432/18723 | 1.18e-08 | 3.63e-07 | 165 |
| GO:007233228 | Skin | cSCC | intrinsic apoptotic signaling pathway by p53 class mediator | 43/4864 | 76/18723 | 1.48e-08 | 4.49e-07 | 43 |
| GO:00330453 | Skin | cSCC | regulation of sister chromatid segregation | 41/4864 | 72/18723 | 2.48e-08 | 6.89e-07 | 41 |
| GO:19058183 | Skin | cSCC | regulation of chromosome separation | 41/4864 | 72/18723 | 2.48e-08 | 6.89e-07 | 41 |
| GO:00109653 | Skin | cSCC | regulation of mitotic sister chromatid separation | 38/4864 | 65/18723 | 3.03e-08 | 8.18e-07 | 38 |
| GO:190179629 | Skin | cSCC | regulation of signal transduction by p53 class mediator | 49/4864 | 93/18723 | 3.49e-08 | 9.19e-07 | 49 |
| GO:00513063 | Skin | cSCC | mitotic sister chromatid separation | 38/4864 | 67/18723 | 9.27e-08 | 2.22e-06 | 38 |
| Page: 1 2 3 4 5 6 7 8 9 10 11 12 13 14 15 16 17 18 19 20 21 22 23 24 25 26 27 28 29 30 31 32 33 34 35 36 37 38 39 40 41 42 |
| Pathway ID | Tissue | Disease Stage | Description | Gene Ratio | Bg Ratio | pvalue | p.adjust | qvalue | Count |
| hsa0516624 | Breast | IDC | Human T-cell leukemia virus 1 infection | 40/867 | 222/8465 | 2.52e-04 | 2.21e-03 | 1.66e-03 | 40 |
| hsa0516634 | Breast | IDC | Human T-cell leukemia virus 1 infection | 40/867 | 222/8465 | 2.52e-04 | 2.21e-03 | 1.66e-03 | 40 |
| hsa0516642 | Breast | DCIS | Human T-cell leukemia virus 1 infection | 41/846 | 222/8465 | 7.03e-05 | 6.88e-04 | 5.07e-04 | 41 |
| hsa0516652 | Breast | DCIS | Human T-cell leukemia virus 1 infection | 41/846 | 222/8465 | 7.03e-05 | 6.88e-04 | 5.07e-04 | 41 |
| hsa0516639 | Esophagus | HGIN | Human T-cell leukemia virus 1 infection | 51/1383 | 222/8465 | 5.84e-03 | 4.05e-02 | 3.22e-02 | 51 |
| hsa041109 | Esophagus | HGIN | Cell cycle | 38/1383 | 157/8465 | 6.70e-03 | 4.37e-02 | 3.47e-02 | 38 |
| hsa05166114 | Esophagus | HGIN | Human T-cell leukemia virus 1 infection | 51/1383 | 222/8465 | 5.84e-03 | 4.05e-02 | 3.22e-02 | 51 |
| hsa0411016 | Esophagus | HGIN | Cell cycle | 38/1383 | 157/8465 | 6.70e-03 | 4.37e-02 | 3.47e-02 | 38 |
| hsa0411023 | Esophagus | ESCC | Cell cycle | 126/4205 | 157/8465 | 1.34e-15 | 5.60e-14 | 2.87e-14 | 126 |
| hsa05166211 | Esophagus | ESCC | Human T-cell leukemia virus 1 infection | 164/4205 | 222/8465 | 8.13e-14 | 2.09e-12 | 1.07e-12 | 164 |
| hsa041146 | Esophagus | ESCC | Oocyte meiosis | 77/4205 | 131/8465 | 2.19e-02 | 4.80e-02 | 2.46e-02 | 77 |
| hsa0411033 | Esophagus | ESCC | Cell cycle | 126/4205 | 157/8465 | 1.34e-15 | 5.60e-14 | 2.87e-14 | 126 |
| hsa05166310 | Esophagus | ESCC | Human T-cell leukemia virus 1 infection | 164/4205 | 222/8465 | 8.13e-14 | 2.09e-12 | 1.07e-12 | 164 |
| hsa0411411 | Esophagus | ESCC | Oocyte meiosis | 77/4205 | 131/8465 | 2.19e-02 | 4.80e-02 | 2.46e-02 | 77 |
| hsa041102 | Liver | HCC | Cell cycle | 106/4020 | 157/8465 | 2.54e-07 | 3.04e-06 | 1.69e-06 | 106 |
| hsa0516622 | Liver | HCC | Human T-cell leukemia virus 1 infection | 139/4020 | 222/8465 | 3.17e-06 | 2.79e-05 | 1.55e-05 | 139 |
| hsa041103 | Liver | HCC | Cell cycle | 106/4020 | 157/8465 | 2.54e-07 | 3.04e-06 | 1.69e-06 | 106 |
| hsa0516632 | Liver | HCC | Human T-cell leukemia virus 1 infection | 139/4020 | 222/8465 | 3.17e-06 | 2.79e-05 | 1.55e-05 | 139 |
| hsa041108 | Oral cavity | OSCC | Cell cycle | 118/3704 | 157/8465 | 7.15e-16 | 2.66e-14 | 1.35e-14 | 118 |
| hsa0516630 | Oral cavity | OSCC | Human T-cell leukemia virus 1 infection | 150/3704 | 222/8465 | 3.68e-13 | 7.26e-12 | 3.70e-12 | 150 |
| Page: 1 2 |
Top |
Cell-cell communication analysis |
| Identification of potential cell-cell interactions between two cell types and their ligand-receptor pairs for different disease states |
| Ligand | Receptor | LRpair | Pathway | Tissue | Disease Stage |
| Page: 1 |
Top |
Single-cell gene regulatory network inference analysis |
| Find out the significant the regulons (TFs) and the target genes of each regulon across cell types for different disease states |
| TF | Cell Type | Tissue | Disease Stage | Target Gene | RSS | Regulon Activity |
| ∗The dot plots of a searched regulon are shown for all cell subpopulations in each disease state of each tissue based on the regulon specific score inferred using pySCENIC and by calculating the average expression. |
| Page: 1 |
Top |
Somatic mutation of malignant transformation related genes |
| Annotation of somatic variants for genes involved in malignant transformation |
| Hugo Symbol | Variant Class | Variant Classification | dbSNP RS | HGVSc | HGVSp | HGVSp Short | SWISSPROT | BIOTYPE | SIFT | PolyPhen | Tumor Sample Barcode | Tissue | Histology | Sex | Age | Stage | Therapy Types | Drugs | Outcome |
| PTTG1 | SNV | Missense_Mutation | c.385N>A | p.Asp129Asn | p.D129N | O95997 | protein_coding | deleterious(0.03) | benign(0.125) | TCGA-BH-A204-01 | Breast | breast invasive carcinoma | Female | >=65 | I/II | Unknown | Unknown | SD | |
| PTTG1 | SNV | Missense_Mutation | rs763093561 | c.351N>A | p.Phe117Leu | p.F117L | O95997 | protein_coding | tolerated(0.5) | benign(0.007) | TCGA-AA-A010-01 | Colorectum | colon adenocarcinoma | Female | <65 | I/II | Chemotherapy | folinic | CR |
| PTTG1 | SNV | Missense_Mutation | novel | c.491C>A | p.Pro164His | p.P164H | O95997 | protein_coding | deleterious(0) | probably_damaging(0.992) | TCGA-A5-A1OF-01 | Endometrium | uterine corpus endometrioid carcinoma | Female | <65 | I/II | Unknown | Unknown | SD |
| PTTG1 | SNV | Missense_Mutation | novel | c.551N>A | p.Ser184Asn | p.S184N | O95997 | protein_coding | tolerated(0.31) | possibly_damaging(0.459) | TCGA-AX-A06F-01 | Endometrium | uterine corpus endometrioid carcinoma | Female | <65 | III/IV | Chemotherapy | carboplatin | SD |
| PTTG1 | SNV | Missense_Mutation | c.329N>T | p.Ala110Val | p.A110V | O95997 | protein_coding | tolerated(0.2) | benign(0.171) | TCGA-AX-A1CE-01 | Endometrium | uterine corpus endometrioid carcinoma | Female | <65 | I/II | Unspecific | Paclitaxel | SD | |
| PTTG1 | SNV | Missense_Mutation | c.385N>A | p.Asp129Asn | p.D129N | O95997 | protein_coding | deleterious(0.03) | benign(0.125) | TCGA-B5-A11U-01 | Endometrium | uterine corpus endometrioid carcinoma | Female | >=65 | III/IV | Unknown | Unknown | SD | |
| PTTG1 | SNV | Missense_Mutation | novel | c.391C>T | p.Pro131Ser | p.P131S | O95997 | protein_coding | deleterious(0) | probably_damaging(1) | TCGA-B5-A3FA-01 | Endometrium | uterine corpus endometrioid carcinoma | Female | >=65 | I/II | Unknown | Unknown | SD |
| PTTG1 | SNV | Missense_Mutation | novel | c.584N>T | p.Pro195Leu | p.P195L | O95997 | protein_coding | deleterious(0) | possibly_damaging(0.661) | TCGA-EO-A3KX-01 | Endometrium | uterine corpus endometrioid carcinoma | Female | >=65 | I/II | Unknown | Unknown | SD |
| PTTG1 | SNV | Missense_Mutation | novel | c.583N>A | p.Pro195Thr | p.P195T | O95997 | protein_coding | deleterious(0) | possibly_damaging(0.661) | TCGA-DD-AAC9-01 | Liver | liver hepatocellular carcinoma | Male | <65 | I/II | Unknown | Unknown | SD |
| PTTG1 | SNV | Missense_Mutation | c.410C>G | p.Ala137Gly | p.A137G | O95997 | protein_coding | deleterious(0.02) | possibly_damaging(0.715) | TCGA-05-4427-01 | Lung | lung adenocarcinoma | Female | >=65 | I/II | Chemotherapy | cisplatin | CR |
| Page: 1 2 |
Top |
Related drugs of malignant transformation related genes |
| Identification of chemicals and drugs interact with genes involved in malignant transfromation |
| (DGIdb 4.0) |
| Entrez ID | Symbol | Category | Interaction Types | Drug Claim Name | Drug Name | PMIDs |
| Page: 1 |

Copyright 2023-Present -The University of Texas Health Science Center at Houston |