| Tissue | Expression Dynamics | Abbreviation |
| Breast |  | IDC: Invasive ductal carcinoma |
| DCIS: Ductal carcinoma in situ |
| Precancer(BRCA1-mut): Precancerous lesion from BRCA1 mutation carriers |
| Cervix | 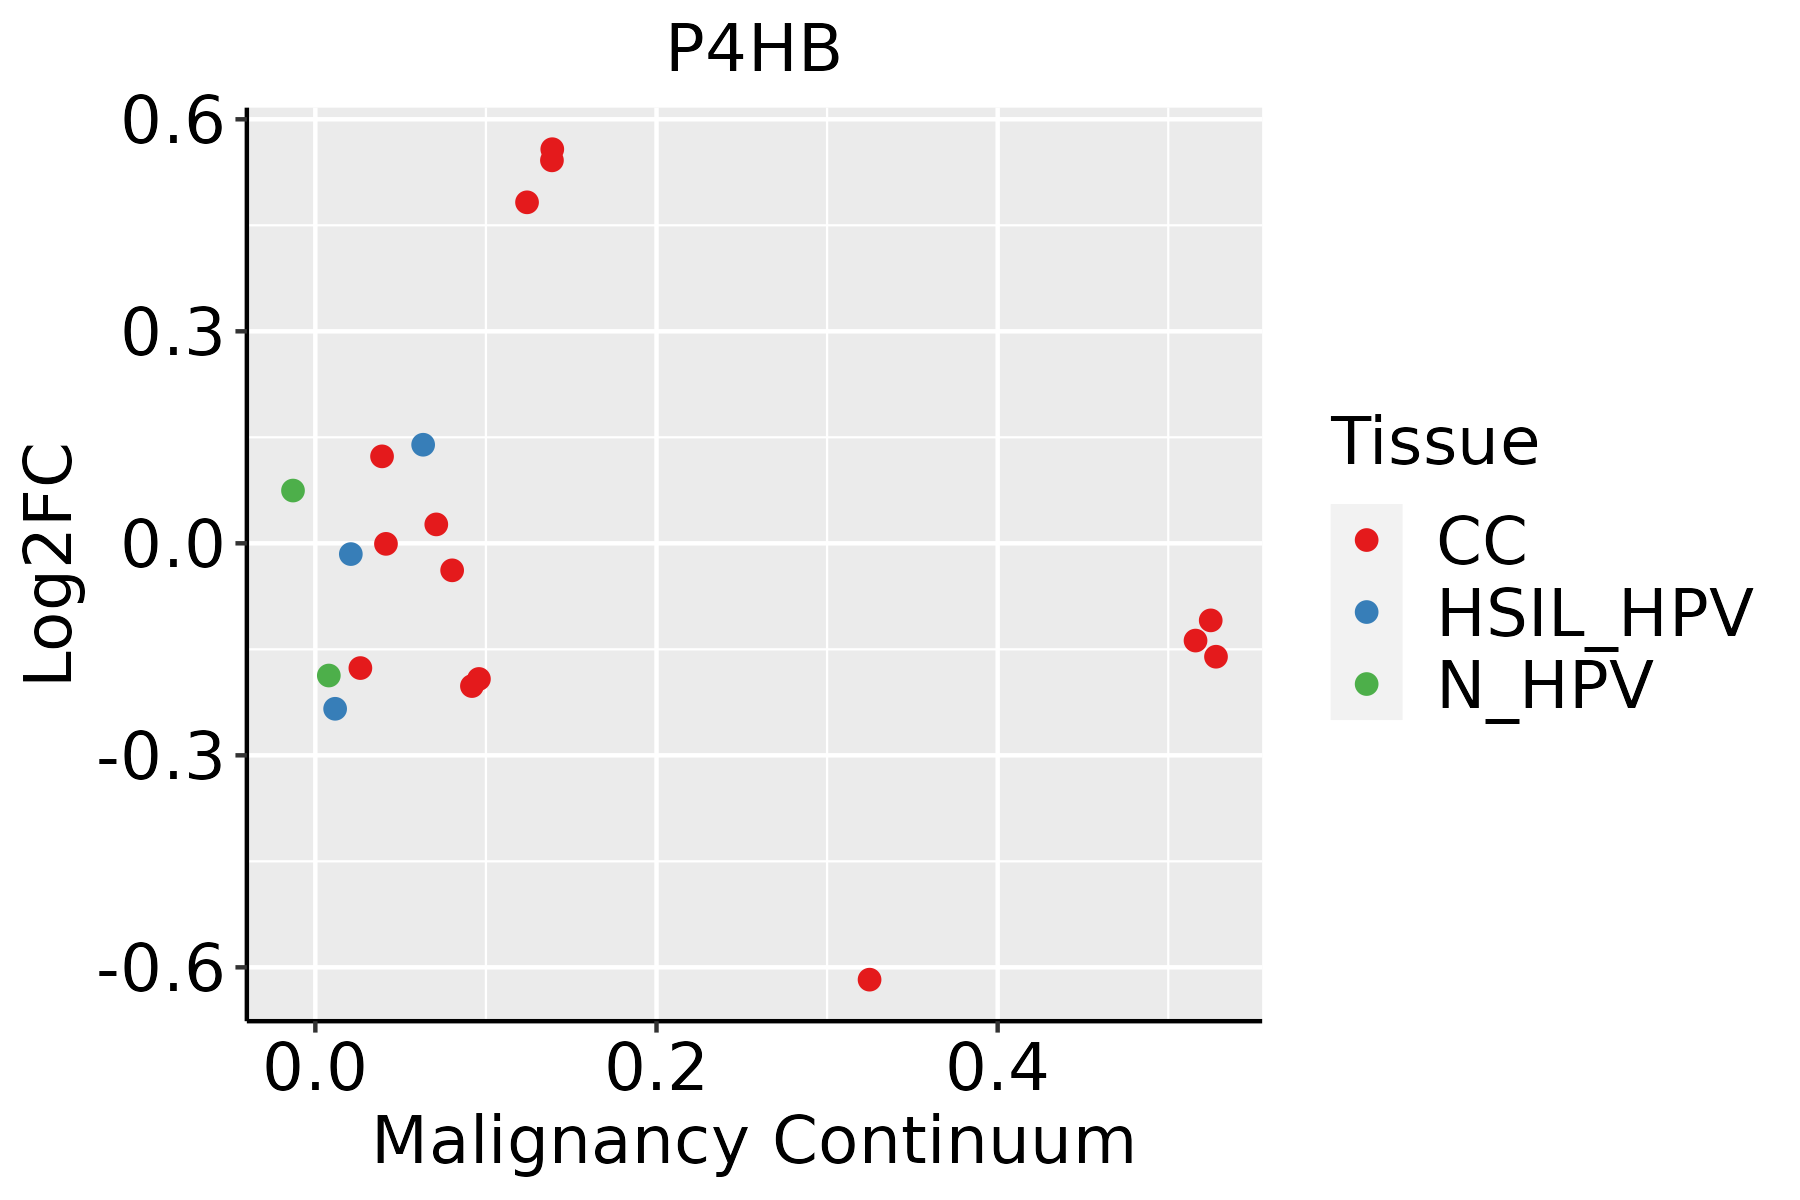 | CC: Cervix cancer |
| HSIL_HPV: HPV-infected high-grade squamous intraepithelial lesions |
| N_HPV: HPV-infected normal cervix |
| Colorectum (GSE201348) |  | FAP: Familial adenomatous polyposis |
| CRC: Colorectal cancer |
| Colorectum (HTA11) |  | AD: Adenomas |
| SER: Sessile serrated lesions |
| MSI-H: Microsatellite-high colorectal cancer |
| MSS: Microsatellite stable colorectal cancer |
| Endometrium | 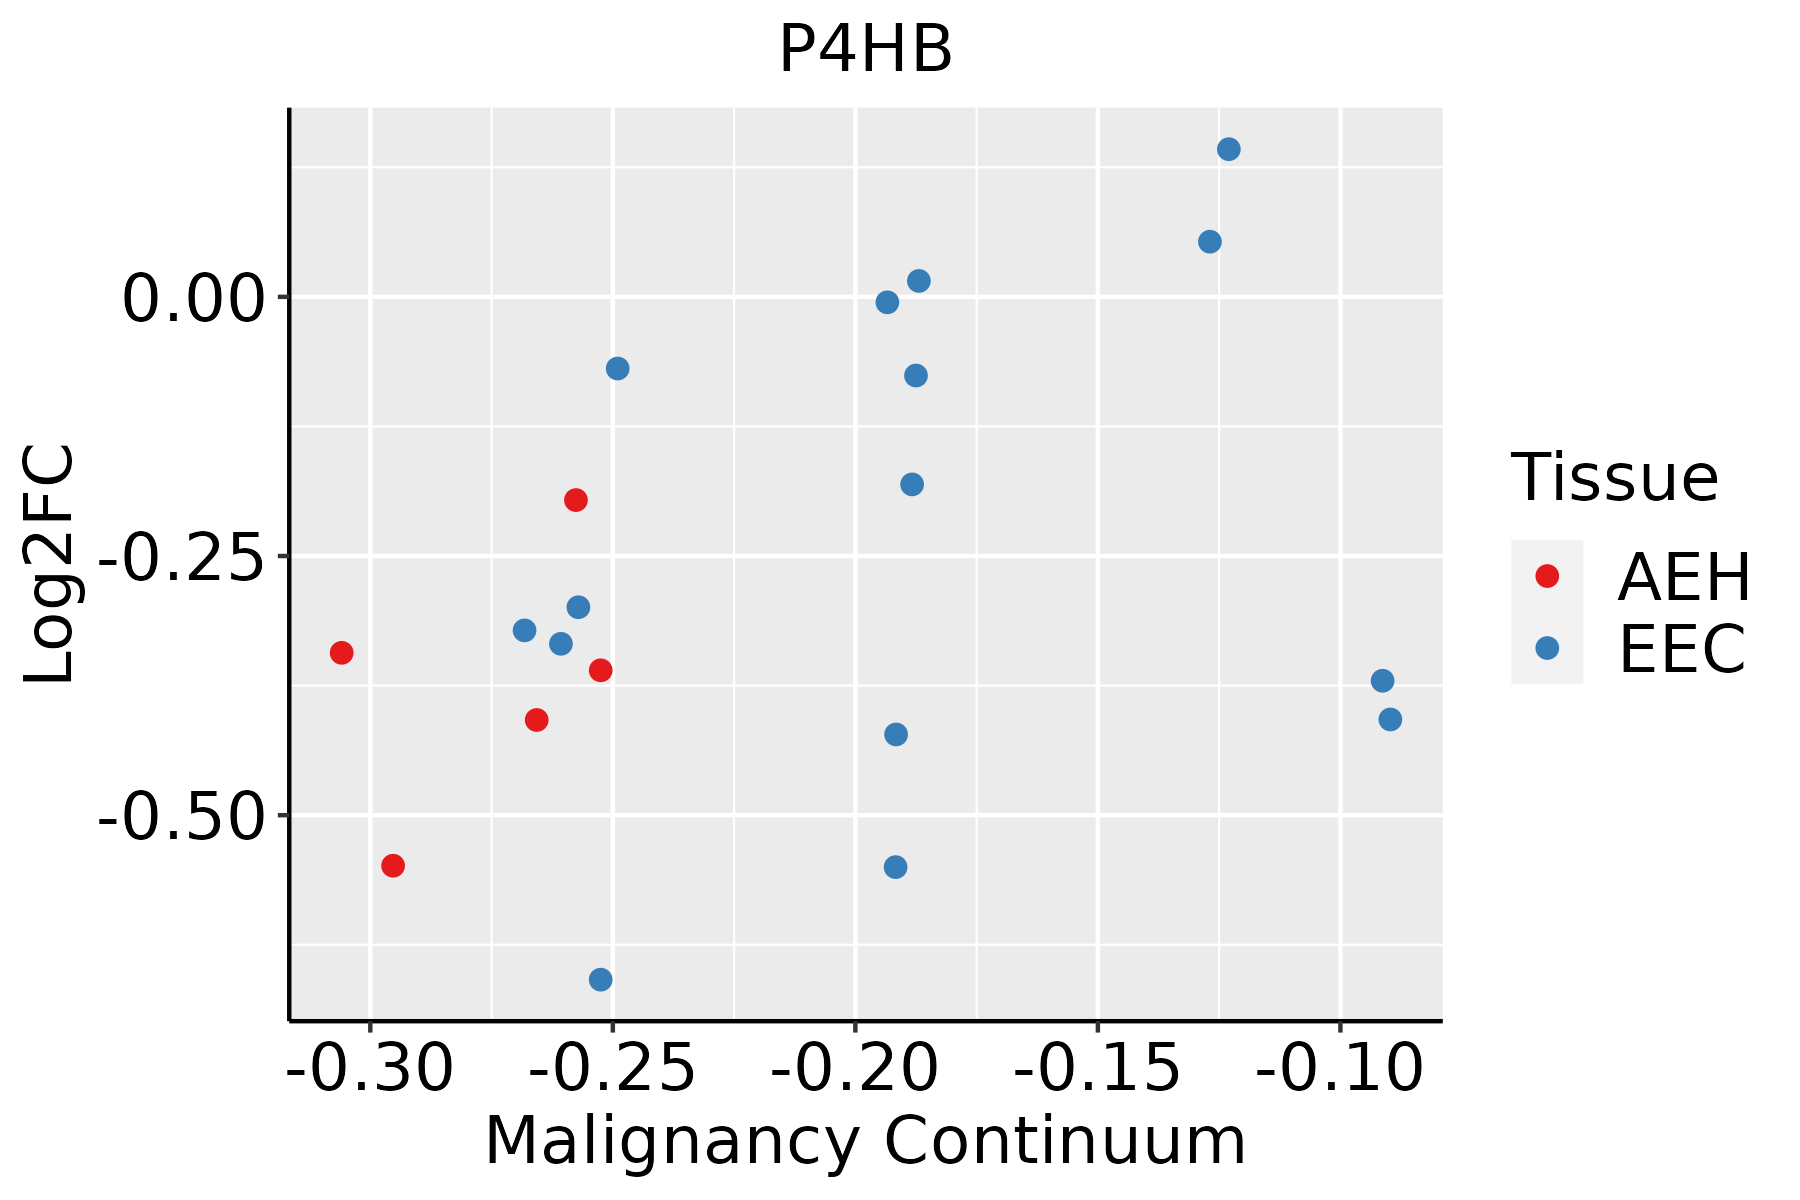 | AEH: Atypical endometrial hyperplasia |
| EEC: Endometrioid Cancer |
| Esophagus | 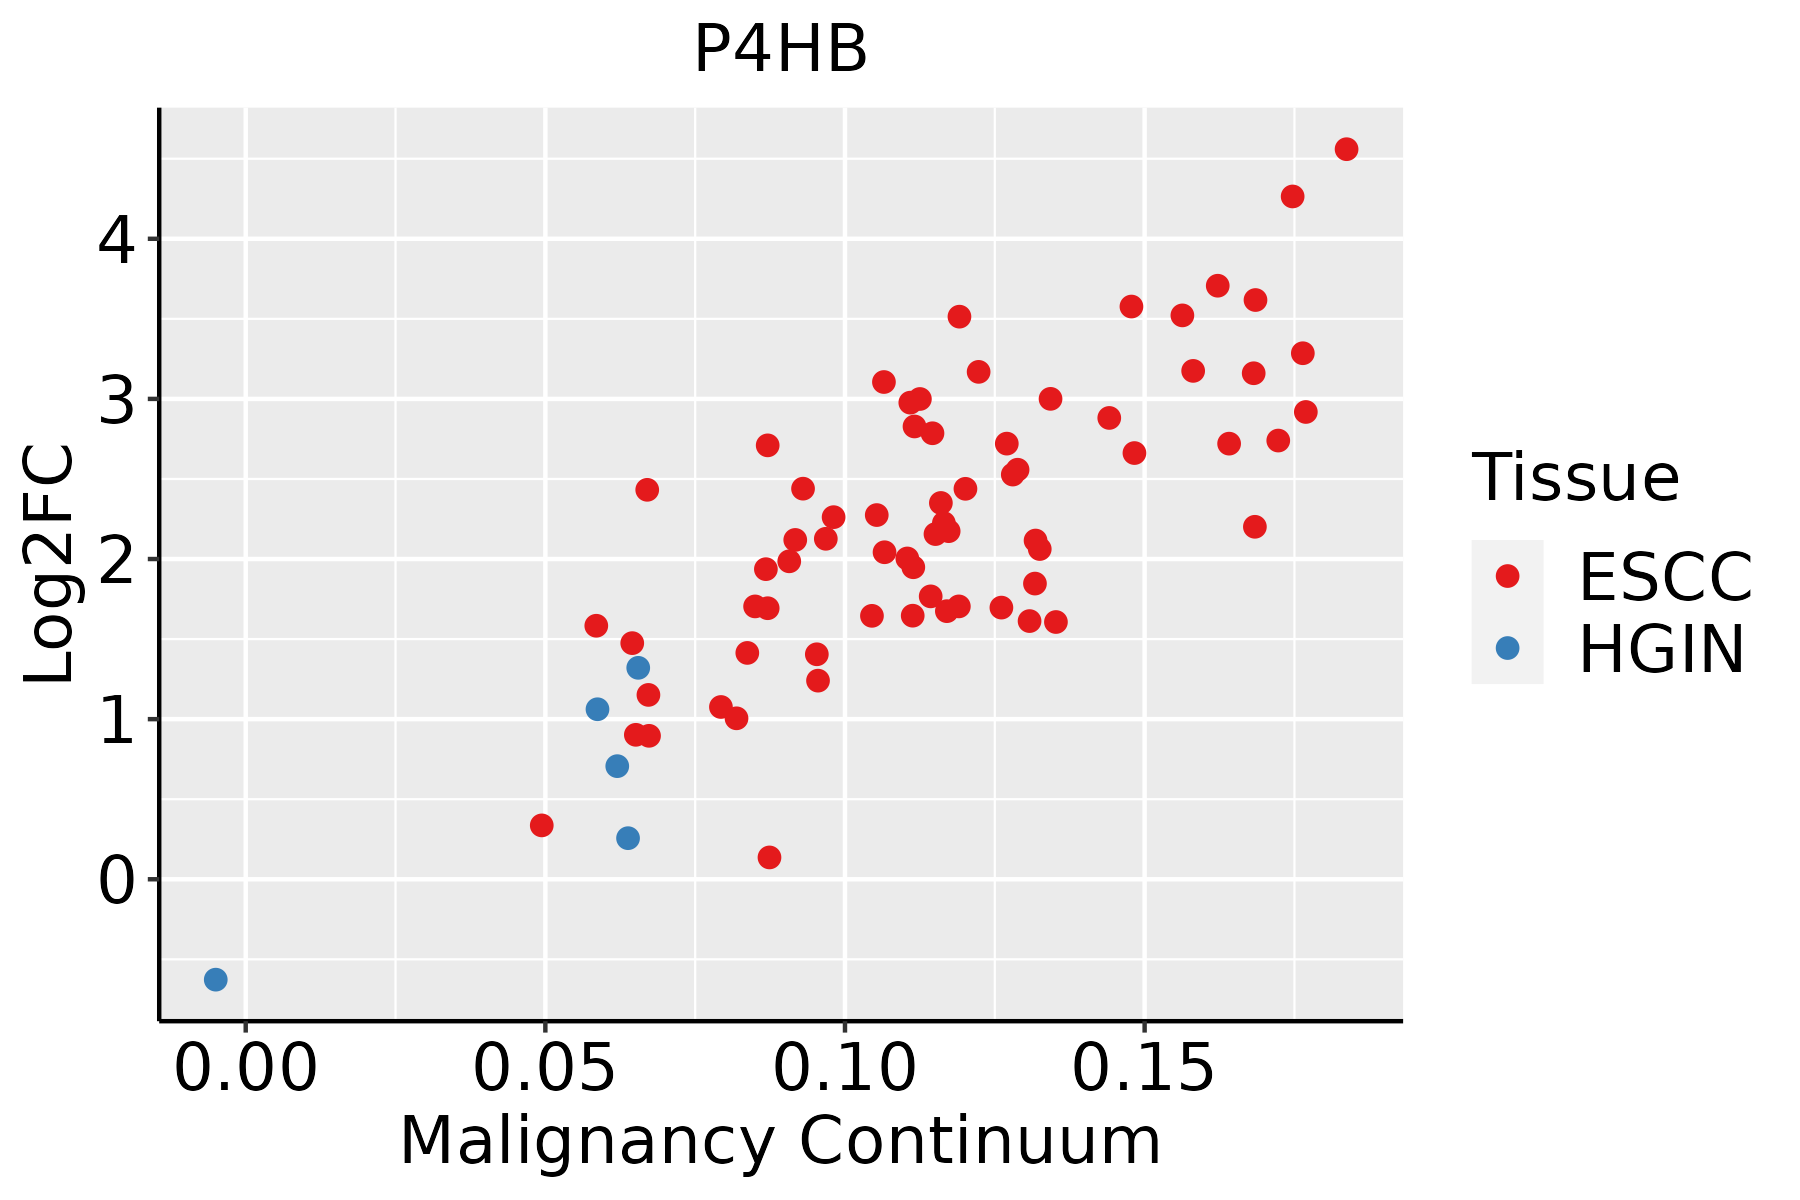 | ESCC: Esophageal squamous cell carcinoma |
| HGIN: High-grade intraepithelial neoplasias |
| LGIN: Low-grade intraepithelial neoplasias |
| GC |  | CAG: Chronic atrophic gastritis |
| CAG with IM: Chronic atrophic gastritis with intestinal metaplasia |
| CSG: Chronic superficial gastritis |
| GC: Gastric cancer |
| SIM: Severe intestinal metaplasia |
| WIM: Wild intestinal metaplasia |
| Liver | 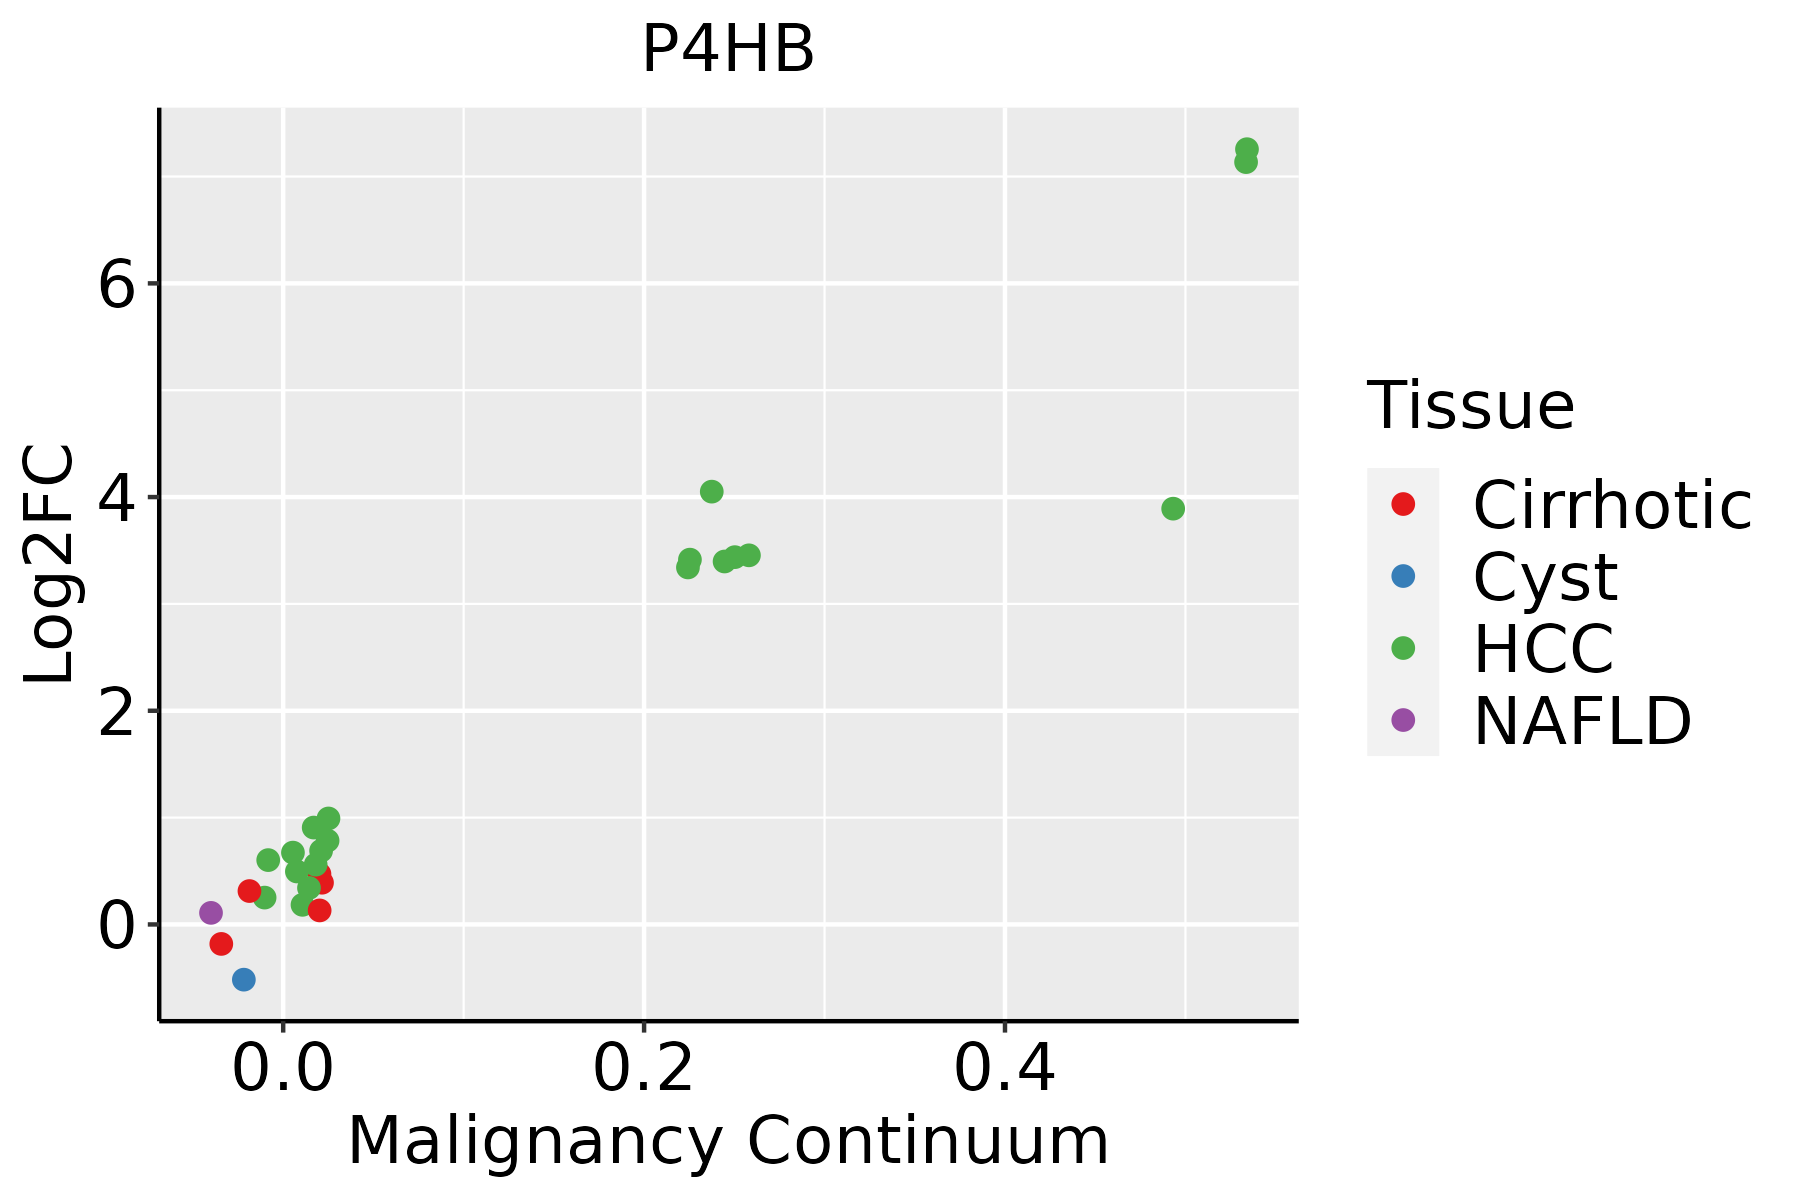 | HCC: Hepatocellular carcinoma |
| NAFLD: Non-alcoholic fatty liver disease |
| Lung | 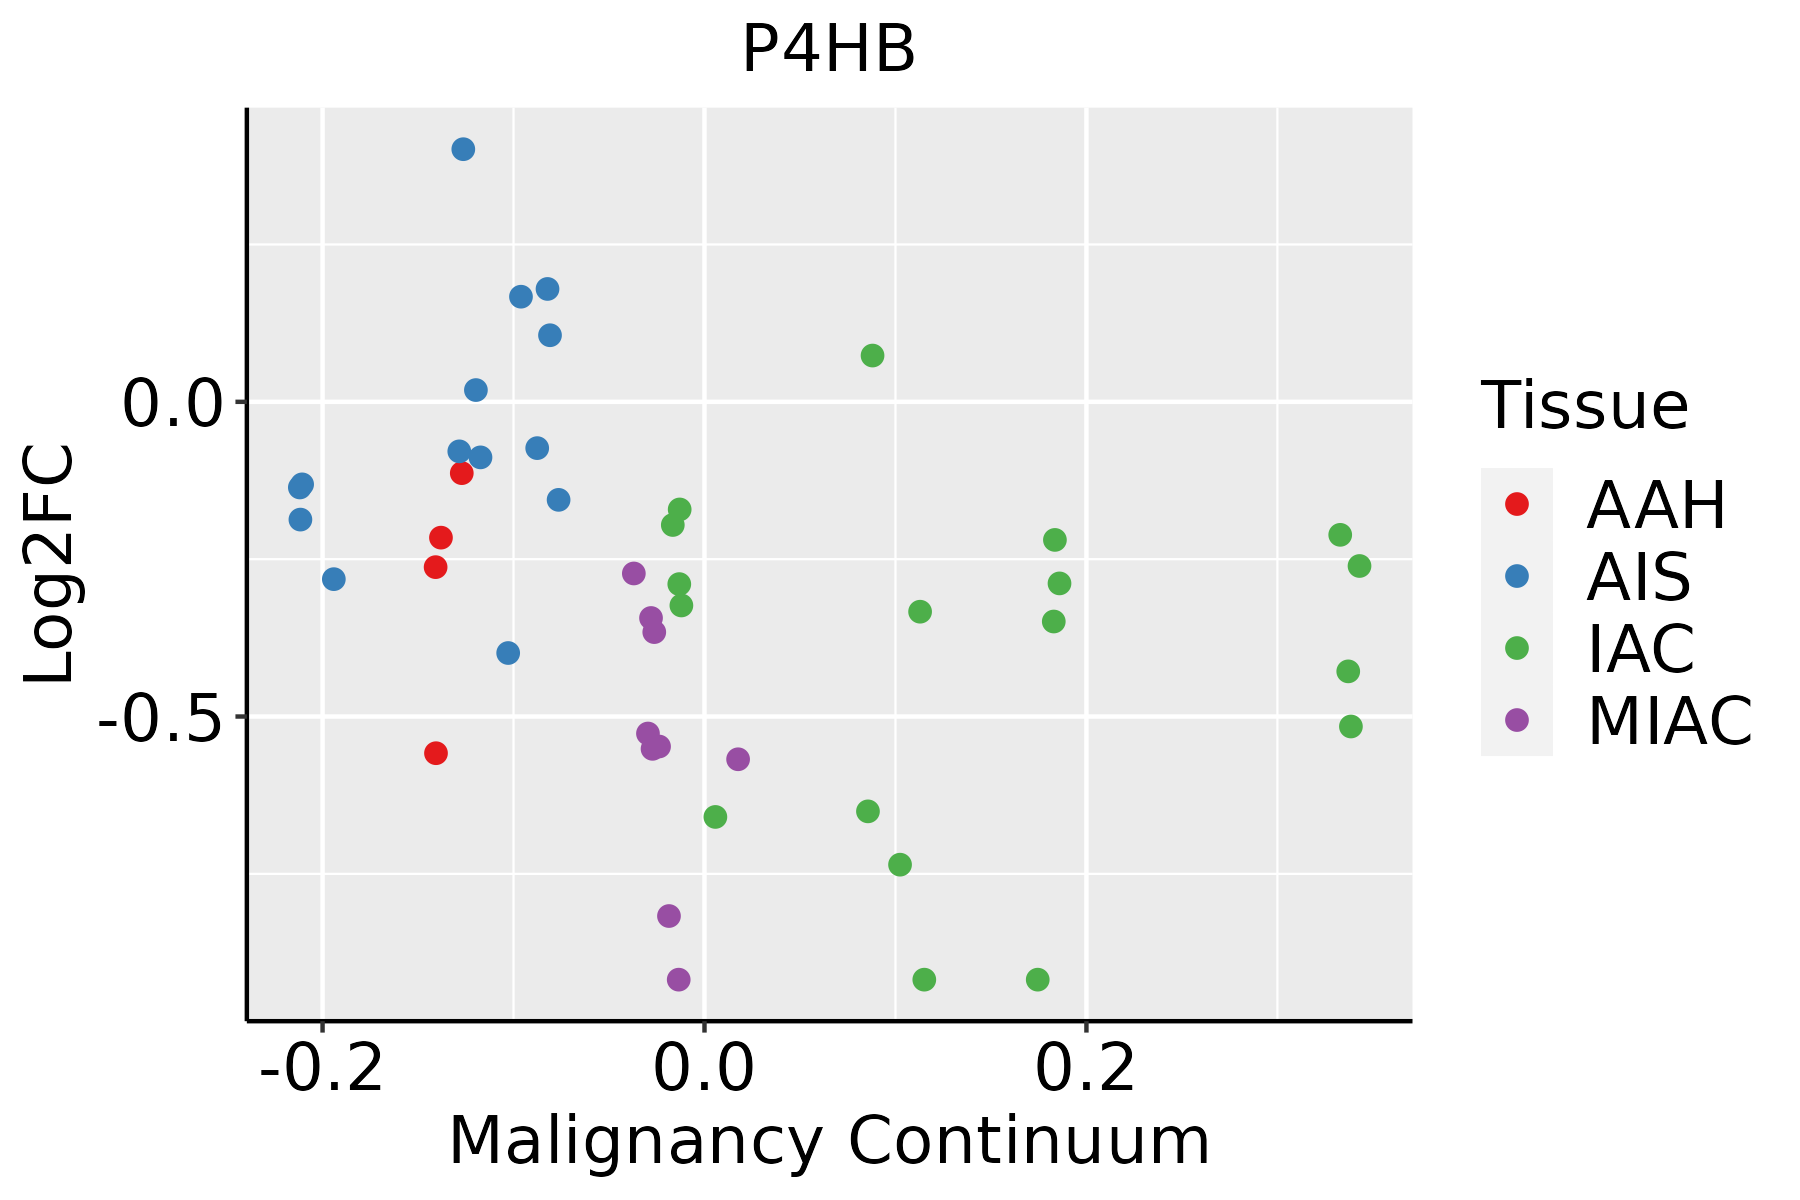 | AAH: Atypical adenomatous hyperplasia |
| AIS: Adenocarcinoma in situ |
| IAC: Invasive lung adenocarcinoma |
| MIA: Minimally invasive adenocarcinoma |
| Oral Cavity | 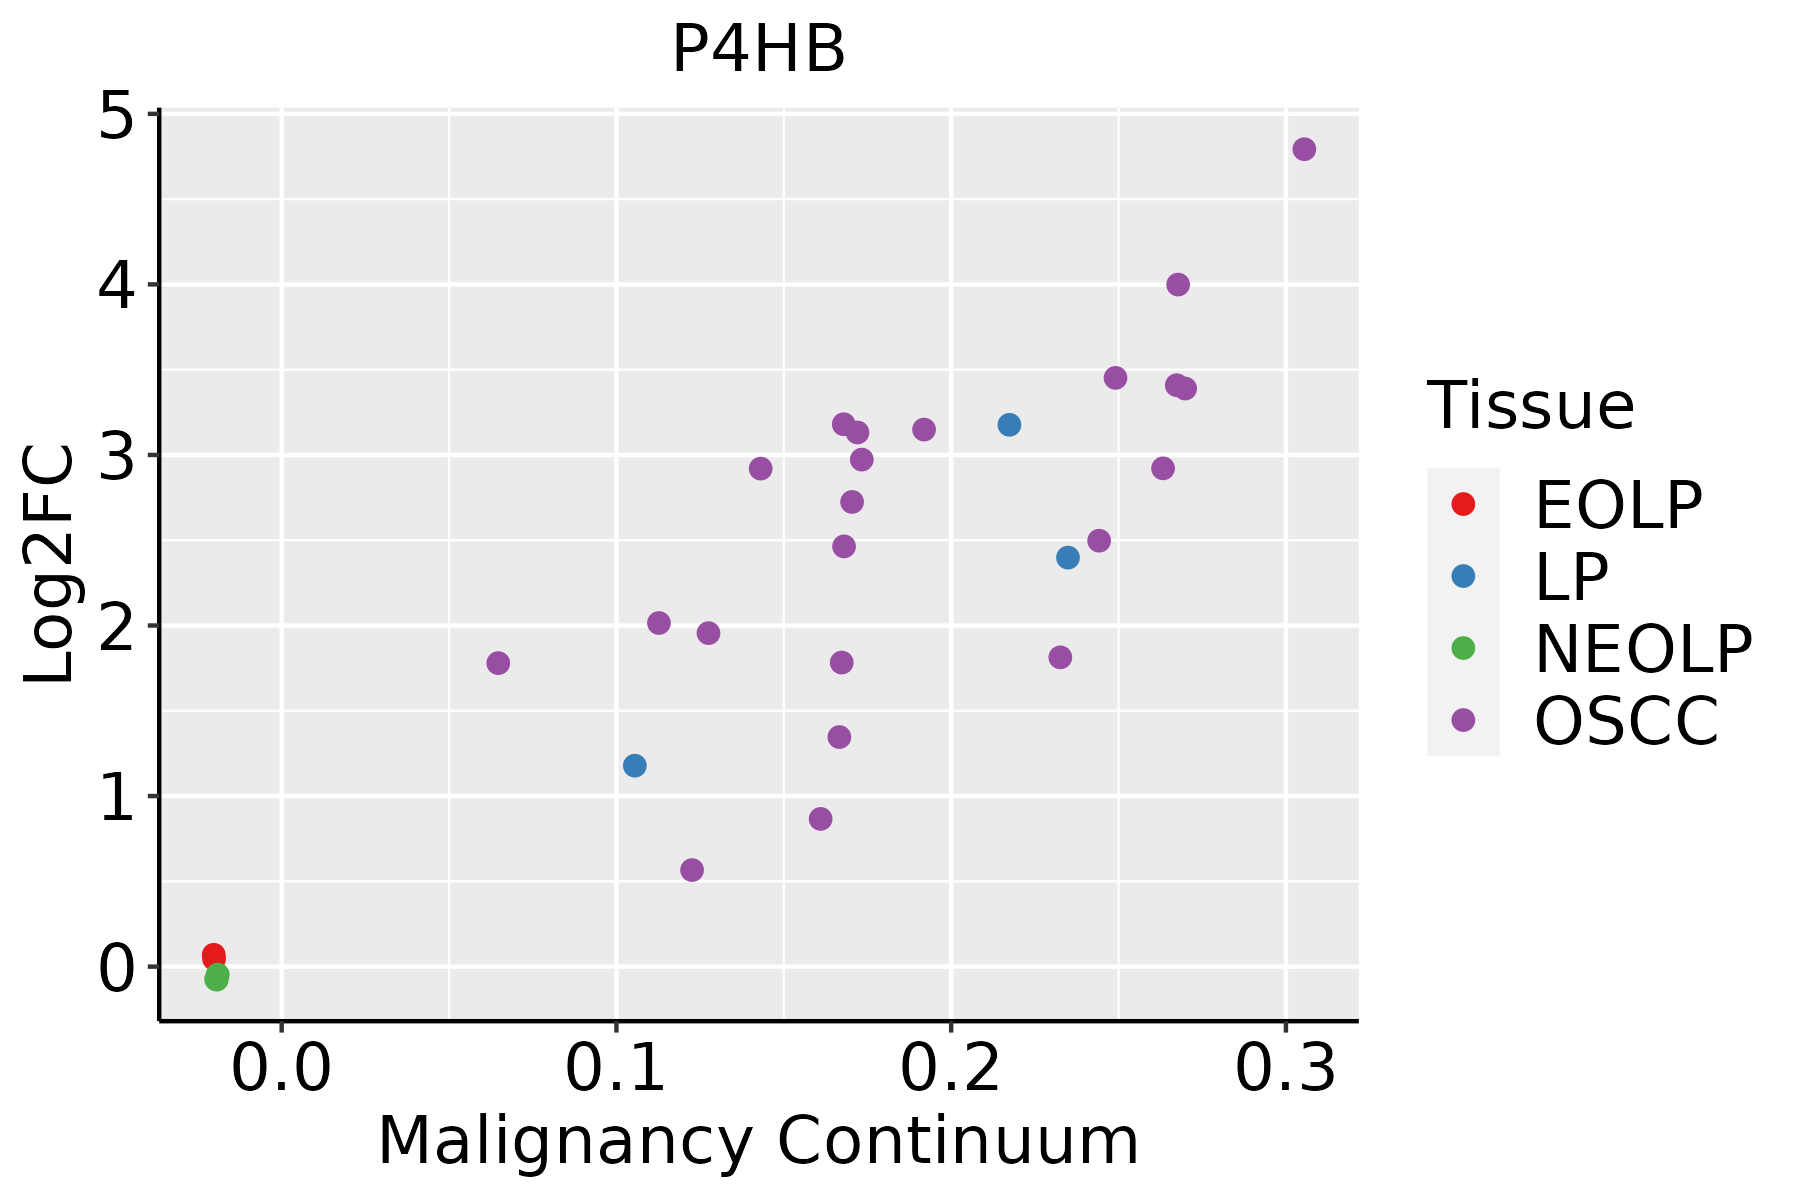 | EOLP: Erosive Oral lichen planus |
| LP: leukoplakia |
| NEOLP: Non-erosive oral lichen planus |
| OSCC: Oral squamous cell carcinoma |
| Prostate |  | BPH: Benign Prostatic Hyperplasia |
| Skin | 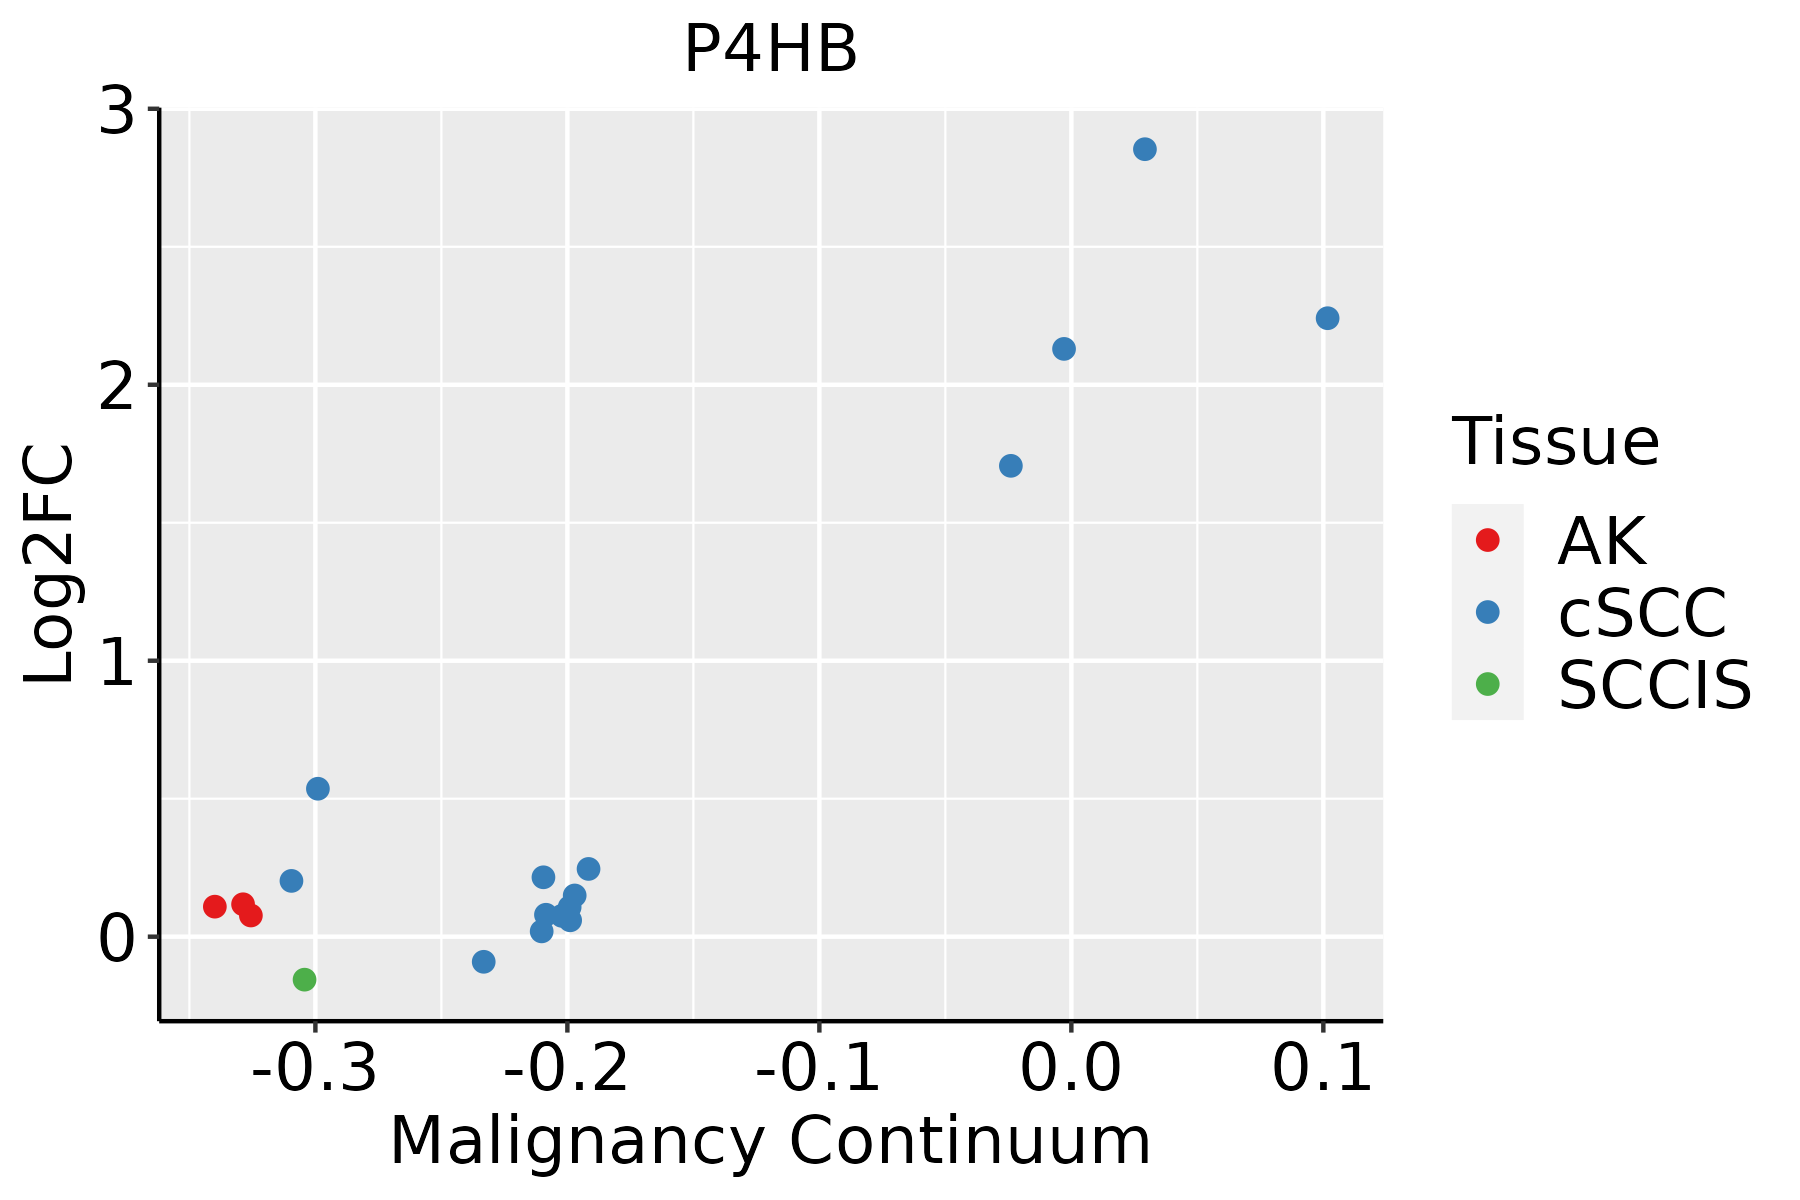 | AK: Actinic keratosis |
| cSCC: Cutaneous squamous cell carcinoma |
| SCCIS:squamous cell carcinoma in situ |
| Thyroid | 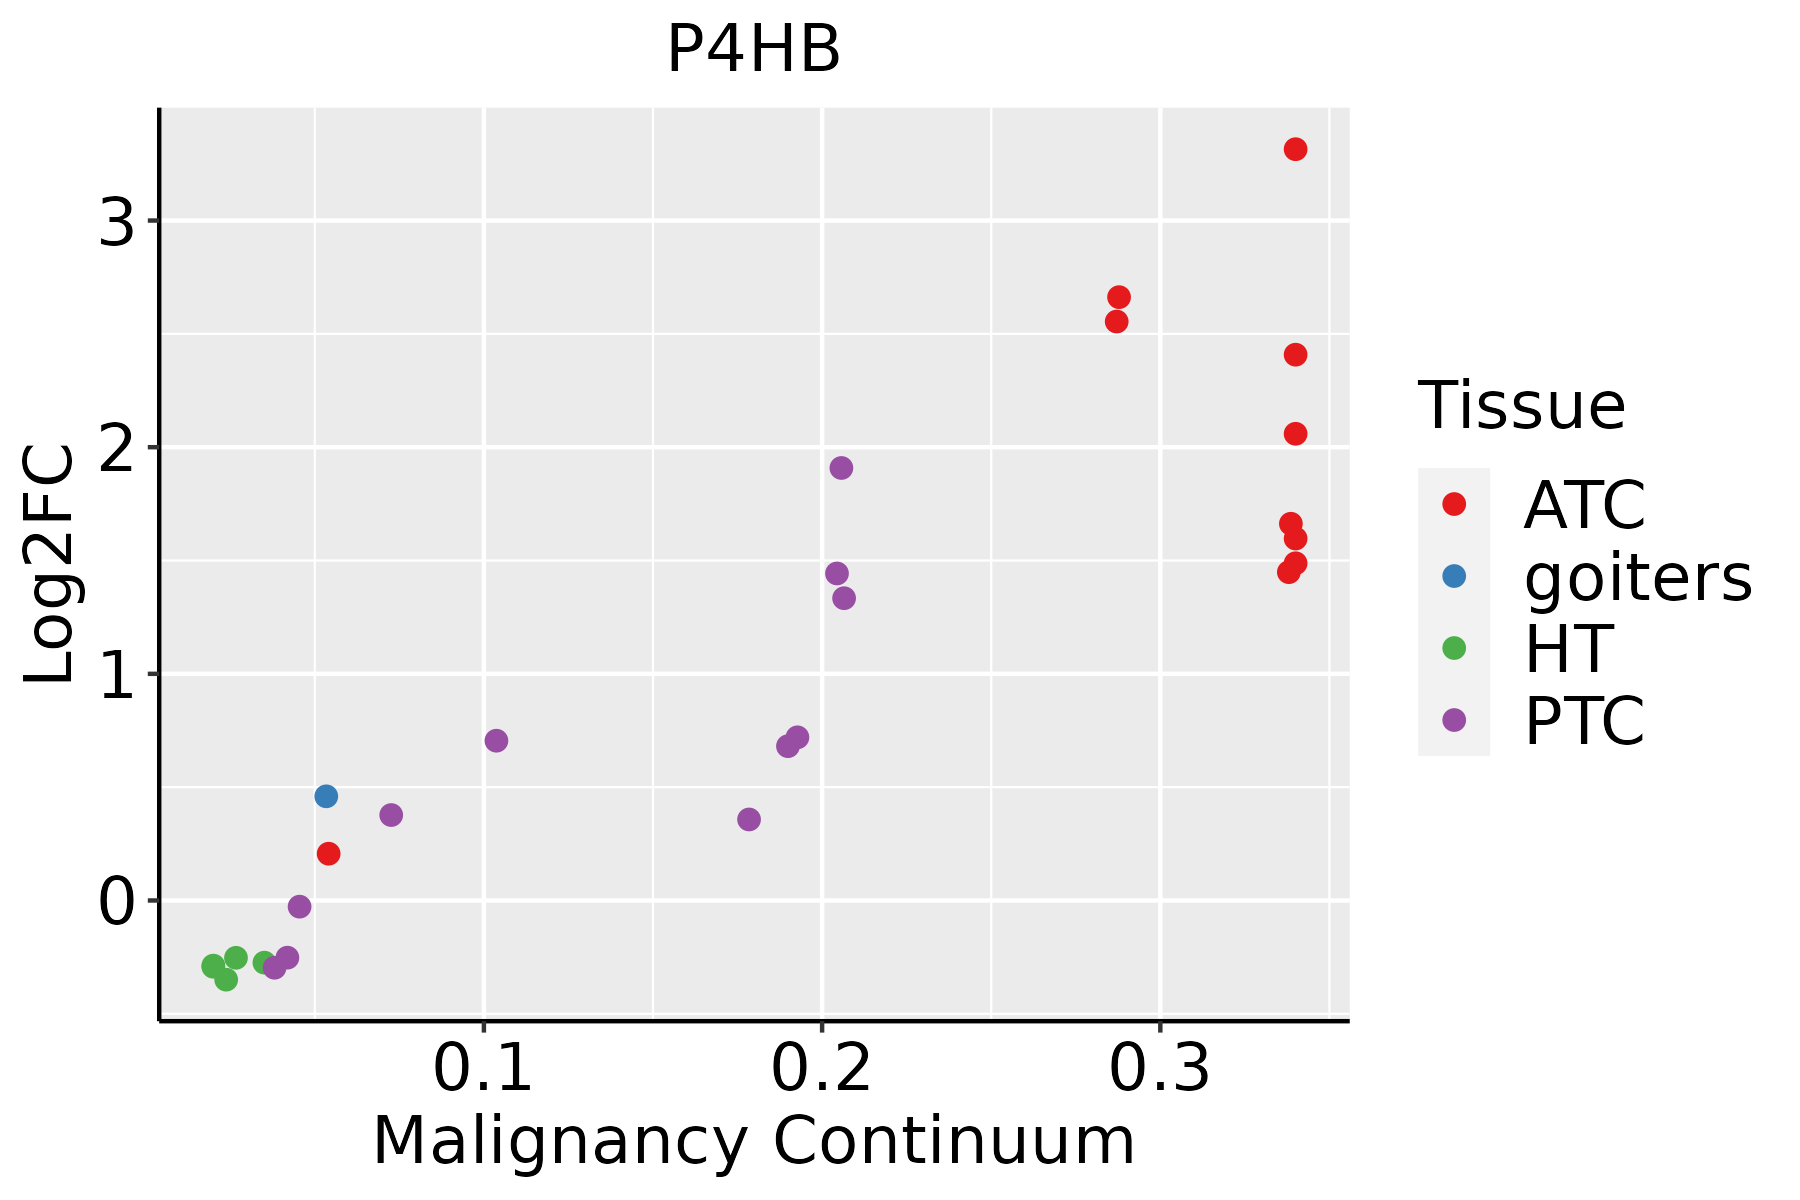 | ATC: Anaplastic thyroid cancer |
| HT: Hashimoto's thyroiditis |
| PTC: Papillary thyroid cancer |
| GO ID | Tissue | Disease Stage | Description | Gene Ratio | Bg Ratio | pvalue | p.adjust | Count |
| GO:00457858 | Lung | IAC | positive regulation of cell adhesion | 87/2061 | 437/18723 | 2.59e-08 | 3.13e-06 | 87 |
| GO:00444038 | Lung | IAC | biological process involved in symbiotic interaction | 63/2061 | 290/18723 | 8.57e-08 | 8.34e-06 | 63 |
| GO:20012428 | Lung | IAC | regulation of intrinsic apoptotic signaling pathway | 42/2061 | 164/18723 | 1.16e-07 | 1.07e-05 | 42 |
| GO:00362947 | Lung | IAC | cellular response to decreased oxygen levels | 41/2061 | 161/18723 | 1.92e-07 | 1.59e-05 | 41 |
| GO:00714537 | Lung | IAC | cellular response to oxygen levels | 43/2061 | 177/18723 | 4.03e-07 | 2.82e-05 | 43 |
| GO:00714564 | Lung | IAC | cellular response to hypoxia | 38/2061 | 151/18723 | 7.33e-07 | 4.14e-05 | 38 |
| GO:00362938 | Lung | IAC | response to decreased oxygen levels | 64/2061 | 322/18723 | 1.87e-06 | 8.87e-05 | 64 |
| GO:00069798 | Lung | IAC | response to oxidative stress | 82/2061 | 446/18723 | 1.99e-06 | 9.18e-05 | 82 |
| GO:00016668 | Lung | IAC | response to hypoxia | 61/2061 | 307/18723 | 3.26e-06 | 1.39e-04 | 61 |
| GO:00621978 | Lung | IAC | cellular response to chemical stress | 64/2061 | 337/18723 | 8.92e-06 | 3.01e-04 | 64 |
| GO:00704828 | Lung | IAC | response to oxygen levels | 65/2061 | 347/18723 | 1.21e-05 | 3.64e-04 | 65 |
| GO:00485248 | Lung | IAC | positive regulation of viral process | 20/2061 | 65/18723 | 1.31e-05 | 3.94e-04 | 20 |
| GO:00507928 | Lung | IAC | regulation of viral process | 37/2061 | 164/18723 | 1.56e-05 | 4.51e-04 | 37 |
| GO:00465986 | Lung | IAC | positive regulation of viral entry into host cell | 7/2061 | 11/18723 | 4.28e-05 | 1.02e-03 | 7 |
| GO:00752946 | Lung | IAC | positive regulation by symbiont of entry into host | 7/2061 | 11/18723 | 4.28e-05 | 1.02e-03 | 7 |
| GO:00108118 | Lung | IAC | positive regulation of cell-substrate adhesion | 29/2061 | 123/18723 | 5.35e-05 | 1.21e-03 | 29 |
| GO:00345998 | Lung | IAC | cellular response to oxidative stress | 54/2061 | 288/18723 | 6.20e-05 | 1.35e-03 | 54 |
| GO:00439038 | Lung | IAC | regulation of biological process involved in symbiotic interaction | 20/2061 | 72/18723 | 6.79e-05 | 1.45e-03 | 20 |
| GO:19028828 | Lung | IAC | regulation of response to oxidative stress | 24/2061 | 98/18723 | 1.22e-04 | 2.30e-03 | 24 |
| GO:19039025 | Lung | IAC | positive regulation of viral life cycle | 11/2061 | 29/18723 | 1.47e-04 | 2.70e-03 | 11 |
| Pathway ID | Tissue | Disease Stage | Description | Gene Ratio | Bg Ratio | pvalue | p.adjust | qvalue | Count |
| hsa0414118 | Breast | Precancer | Protein processing in endoplasmic reticulum | 33/684 | 174/8465 | 2.78e-06 | 3.83e-05 | 2.94e-05 | 33 |
| hsa0414119 | Breast | Precancer | Protein processing in endoplasmic reticulum | 33/684 | 174/8465 | 2.78e-06 | 3.83e-05 | 2.94e-05 | 33 |
| hsa0414124 | Breast | IDC | Protein processing in endoplasmic reticulum | 36/867 | 174/8465 | 2.73e-05 | 2.86e-04 | 2.14e-04 | 36 |
| hsa0414134 | Breast | IDC | Protein processing in endoplasmic reticulum | 36/867 | 174/8465 | 2.73e-05 | 2.86e-04 | 2.14e-04 | 36 |
| hsa0414143 | Breast | DCIS | Protein processing in endoplasmic reticulum | 36/846 | 174/8465 | 1.60e-05 | 1.91e-04 | 1.41e-04 | 36 |
| hsa0414153 | Breast | DCIS | Protein processing in endoplasmic reticulum | 36/846 | 174/8465 | 1.60e-05 | 1.91e-04 | 1.41e-04 | 36 |
| hsa0414120 | Cervix | CC | Protein processing in endoplasmic reticulum | 55/1267 | 174/8465 | 1.74e-08 | 2.68e-07 | 1.58e-07 | 55 |
| hsa04141110 | Cervix | CC | Protein processing in endoplasmic reticulum | 55/1267 | 174/8465 | 1.74e-08 | 2.68e-07 | 1.58e-07 | 55 |
| hsa04141 | Colorectum | AD | Protein processing in endoplasmic reticulum | 80/2092 | 174/8465 | 5.96e-10 | 1.25e-08 | 7.96e-09 | 80 |
| hsa041411 | Colorectum | AD | Protein processing in endoplasmic reticulum | 80/2092 | 174/8465 | 5.96e-10 | 1.25e-08 | 7.96e-09 | 80 |
| hsa041414 | Colorectum | MSS | Protein processing in endoplasmic reticulum | 75/1875 | 174/8465 | 3.78e-10 | 8.44e-09 | 5.17e-09 | 75 |
| hsa041415 | Colorectum | MSS | Protein processing in endoplasmic reticulum | 75/1875 | 174/8465 | 3.78e-10 | 8.44e-09 | 5.17e-09 | 75 |
| hsa041416 | Colorectum | MSI-H | Protein processing in endoplasmic reticulum | 46/797 | 174/8465 | 4.53e-11 | 9.78e-10 | 8.19e-10 | 46 |
| hsa041417 | Colorectum | MSI-H | Protein processing in endoplasmic reticulum | 46/797 | 174/8465 | 4.53e-11 | 9.78e-10 | 8.19e-10 | 46 |
| hsa041418 | Colorectum | FAP | Protein processing in endoplasmic reticulum | 50/1404 | 174/8465 | 3.64e-05 | 3.68e-04 | 2.24e-04 | 50 |
| hsa041419 | Colorectum | FAP | Protein processing in endoplasmic reticulum | 50/1404 | 174/8465 | 3.64e-05 | 3.68e-04 | 2.24e-04 | 50 |
| hsa0414126 | Endometrium | AEH | Protein processing in endoplasmic reticulum | 62/1197 | 174/8465 | 5.97e-13 | 1.39e-11 | 1.01e-11 | 62 |
| hsa04141111 | Endometrium | AEH | Protein processing in endoplasmic reticulum | 62/1197 | 174/8465 | 5.97e-13 | 1.39e-11 | 1.01e-11 | 62 |
| hsa0414127 | Endometrium | EEC | Protein processing in endoplasmic reticulum | 64/1237 | 174/8465 | 2.17e-13 | 5.09e-12 | 3.80e-12 | 64 |
| hsa0414136 | Endometrium | EEC | Protein processing in endoplasmic reticulum | 64/1237 | 174/8465 | 2.17e-13 | 5.09e-12 | 3.80e-12 | 64 |
| Hugo Symbol | Variant Class | Variant Classification | dbSNP RS | HGVSc | HGVSp | HGVSp Short | SWISSPROT | BIOTYPE | SIFT | PolyPhen | Tumor Sample Barcode | Tissue | Histology | Sex | Age | Stage | Therapy Types | Drugs | Outcome |
| P4HB | SNV | Missense_Mutation | | c.1439N>T | p.Asp480Val | p.D480V | P07237 | protein_coding | tolerated(0.3) | possibly_damaging(0.454) | TCGA-A2-A0T0-01 | Breast | breast invasive carcinoma | Female | <65 | I/II | Chemotherapy | taxotere | SD |
| P4HB | SNV | Missense_Mutation | novel | c.431C>A | p.Ala144Glu | p.A144E | P07237 | protein_coding | tolerated(1) | benign(0.003) | TCGA-A8-A06T-01 | Breast | breast invasive carcinoma | Female | >=65 | III/IV | Hormone Therapy | anastrozole | SD |
| P4HB | SNV | Missense_Mutation | novel | c.431N>A | p.Ala144Glu | p.A144E | P07237 | protein_coding | tolerated(1) | benign(0.003) | TCGA-A8-A08Z-01 | Breast | breast invasive carcinoma | Female | >=65 | III/IV | Unknown | Unknown | SD |
| P4HB | SNV | Missense_Mutation | rs138621837 | c.430N>A | p.Ala144Thr | p.A144T | P07237 | protein_coding | tolerated(0.51) | benign(0.003) | TCGA-A8-A08Z-01 | Breast | breast invasive carcinoma | Female | >=65 | III/IV | Unknown | Unknown | SD |
| P4HB | SNV | Missense_Mutation | novel | c.1089N>G | p.Asp363Glu | p.D363E | P07237 | protein_coding | deleterious(0.02) | benign(0.036) | TCGA-AR-A2LR-01 | Breast | breast invasive carcinoma | Female | <65 | I/II | Chemotherapy | adriamycin | SD |
| P4HB | SNV | Missense_Mutation | | c.1163N>G | p.Val388Gly | p.V388G | P07237 | protein_coding | deleterious(0) | probably_damaging(1) | TCGA-B6-A0IA-01 | Breast | breast invasive carcinoma | Female | <65 | I/II | Unknown | Unknown | SD |
| P4HB | insertion | Frame_Shift_Ins | novel | c.1453_1454insCCTGGAATCCCAGTGCTGGGGC | p.Glu485AlafsTer23 | p.E485Afs*23 | P07237 | protein_coding | | | TCGA-AO-A0JB-01 | Breast | breast invasive carcinoma | Female | <65 | III/IV | Chemotherapy | cyclophosphamide | SD |
| P4HB | deletion | Frame_Shift_Del | rs773547908 | c.1160delN | p.Asn387ThrfsTer118 | p.N387Tfs*118 | P07237 | protein_coding | | | TCGA-BH-A18G-01 | Breast | breast invasive carcinoma | Female | >=65 | I/II | Unknown | Unknown | SD |
| P4HB | deletion | Frame_Shift_Del | rs773547908 | c.1160delN | p.Asn387ThrfsTer118 | p.N387Tfs*118 | P07237 | protein_coding | | | TCGA-D8-A1J8-01 | Breast | breast invasive carcinoma | Female | >=65 | I/II | Hormone Therapy | nolvadex | SD |
| P4HB | SNV | Missense_Mutation | novel | c.649N>C | p.Glu217Gln | p.E217Q | P07237 | protein_coding | deleterious(0.03) | possibly_damaging(0.556) | TCGA-C5-A8YQ-01 | Cervix | cervical & endocervical cancer | Female | >=65 | I/II | Chemotherapy | cisplatin | PD |
| Entrez ID | Symbol | Category | Interaction Types | Drug Claim Name | Drug Name | PMIDs |
| 5034 | P4HB | THIOREDOXIN, DRUGGABLE GENOME, ENZYME, EXTERNAL SIDE OF PLASMA MEMBRANE | | RALOXIFENE HYDROCHLORIDE | RALOXIFENE HYDROCHLORIDE | |
| 5034 | P4HB | THIOREDOXIN, DRUGGABLE GENOME, ENZYME, EXTERNAL SIDE OF PLASMA MEMBRANE | | ASTRAGALIN | ASTRAGALIN | |
| 5034 | P4HB | THIOREDOXIN, DRUGGABLE GENOME, ENZYME, EXTERNAL SIDE OF PLASMA MEMBRANE | | SYROSINGOPINE | SYROSINGOPINE | |
| 5034 | P4HB | THIOREDOXIN, DRUGGABLE GENOME, ENZYME, EXTERNAL SIDE OF PLASMA MEMBRANE | | LIQUIRITIN | LIQUIRITIN | |
| 5034 | P4HB | THIOREDOXIN, DRUGGABLE GENOME, ENZYME, EXTERNAL SIDE OF PLASMA MEMBRANE | | QUERCITRIN | QUERCITRIN | |
| 5034 | P4HB | THIOREDOXIN, DRUGGABLE GENOME, ENZYME, EXTERNAL SIDE OF PLASMA MEMBRANE | inhibitor | CHEMBL2105662 | LOMITAPIDE MESYLATE | |
| 5034 | P4HB | THIOREDOXIN, DRUGGABLE GENOME, ENZYME, EXTERNAL SIDE OF PLASMA MEMBRANE | | NSC-19803 | CHEMBL522983 | |
| 5034 | P4HB | THIOREDOXIN, DRUGGABLE GENOME, ENZYME, EXTERNAL SIDE OF PLASMA MEMBRANE | | DIHYDRODAPHNODORIN B | DIHYDRODAPHNODORIN B | |
| 5034 | P4HB | THIOREDOXIN, DRUGGABLE GENOME, ENZYME, EXTERNAL SIDE OF PLASMA MEMBRANE | | GNF-PF-2976 | CHEMBL579956 | |


