Schematic overview of the cellular and molecular mechanisms involved in the cancer progression, including the proposed cellular and molecular mechanisms in cancer cells trajectory. AT1: alveolar type 1 cells; AT2: alveolar type 2 cells; AAH: atypical adenomatous hyperplasia; AIS: adenocarcinoma in situ; MIA: minimally invasive adenocarcinoma; IA: invasive adenocarcinoma; EMT: epithelial-mesenchymal transition

Home

Download

Statistics

Help

Contact

Center for Computational Systems Medicine
leaf

Gene summary

leaf

Malignant transformation analysis

leaf

Malignant transformation related pathway analysis

leaf

Cell-cell communication analysis

leaf

Single-cell gene regulatory network inference analysis

leaf

Somatic mutation of malignant transformation related genes

leaf

Related drugs of malignant transformation related genes

Gene: ITGB1BP1

Gene summary for ITGB1BP1

check button Gene summary.

Gene informationSpeciesHuman
Gene symbol

ITGB1BP1

Gene ID

9270

Gene nameintegrin subunit beta 1 binding protein 1
Gene AliasICAP-1A
Cytomap2p25.1
Gene Typeprotein-coding
GO ID

GO:0000165

UniProtAcc

O14713


Top

Malignant transformation analysis

check button Identification of the aberrant gene expression in precancerous and cancerous lesions by comparing the gene expression of stem-like cells in diseased tissues with normal stem cells
check button Malignant transformation involving gene list.
Entrez IDSymbolReplicatesSpeciesOrganTissueAdj P-valueLog2FCMalignancy
9270ITGB1BP1LZE4THumanEsophagusESCC3.19e-227.32e-010.0811
9270ITGB1BP1LZE5THumanEsophagusESCC9.94e-042.39e-010.0514
9270ITGB1BP1LZE7THumanEsophagusESCC1.76e-076.14e-010.0667
9270ITGB1BP1LZE20THumanEsophagusESCC1.83e-032.09e-010.0662
9270ITGB1BP1LZE22THumanEsophagusESCC4.25e-049.11e-010.068
9270ITGB1BP1LZE24THumanEsophagusESCC3.49e-197.05e-010.0596
9270ITGB1BP1LZE21THumanEsophagusESCC2.61e-044.43e-010.0655
9270ITGB1BP1LZE6THumanEsophagusESCC5.81e-106.17e-010.0845
9270ITGB1BP1P1T-EHumanEsophagusESCC1.52e-095.19e-010.0875
9270ITGB1BP1P2T-EHumanEsophagusESCC1.05e-327.46e-010.1177
9270ITGB1BP1P4T-EHumanEsophagusESCC5.40e-389.82e-010.1323
9270ITGB1BP1P5T-EHumanEsophagusESCC3.34e-489.79e-010.1327
9270ITGB1BP1P8T-EHumanEsophagusESCC7.49e-315.27e-010.0889
9270ITGB1BP1P9T-EHumanEsophagusESCC3.25e-286.81e-010.1131
9270ITGB1BP1P10T-EHumanEsophagusESCC1.51e-571.10e+000.116
9270ITGB1BP1P11T-EHumanEsophagusESCC6.14e-241.15e+000.1426
9270ITGB1BP1P12T-EHumanEsophagusESCC4.50e-407.29e-010.1122
9270ITGB1BP1P15T-EHumanEsophagusESCC7.10e-359.40e-010.1149
9270ITGB1BP1P16T-EHumanEsophagusESCC9.15e-203.67e-010.1153
9270ITGB1BP1P17T-EHumanEsophagusESCC1.15e-119.66e-010.1278
Page: 1 2 3 4 5 6 7 

check button Transcriptomic changes along malignancy continuum.
TissueExpression DynamicsAbbreviation
EsophagusThe image shows the transcriptomic changes along malignancy continuum.log2FC in expression of this searched gene in stem-like cells from each diseased tissue sample relative to stem-like cells in normal samples in each tissue plotted against the malignancy continuum. Samples are colored based on if they are from different disease stage.
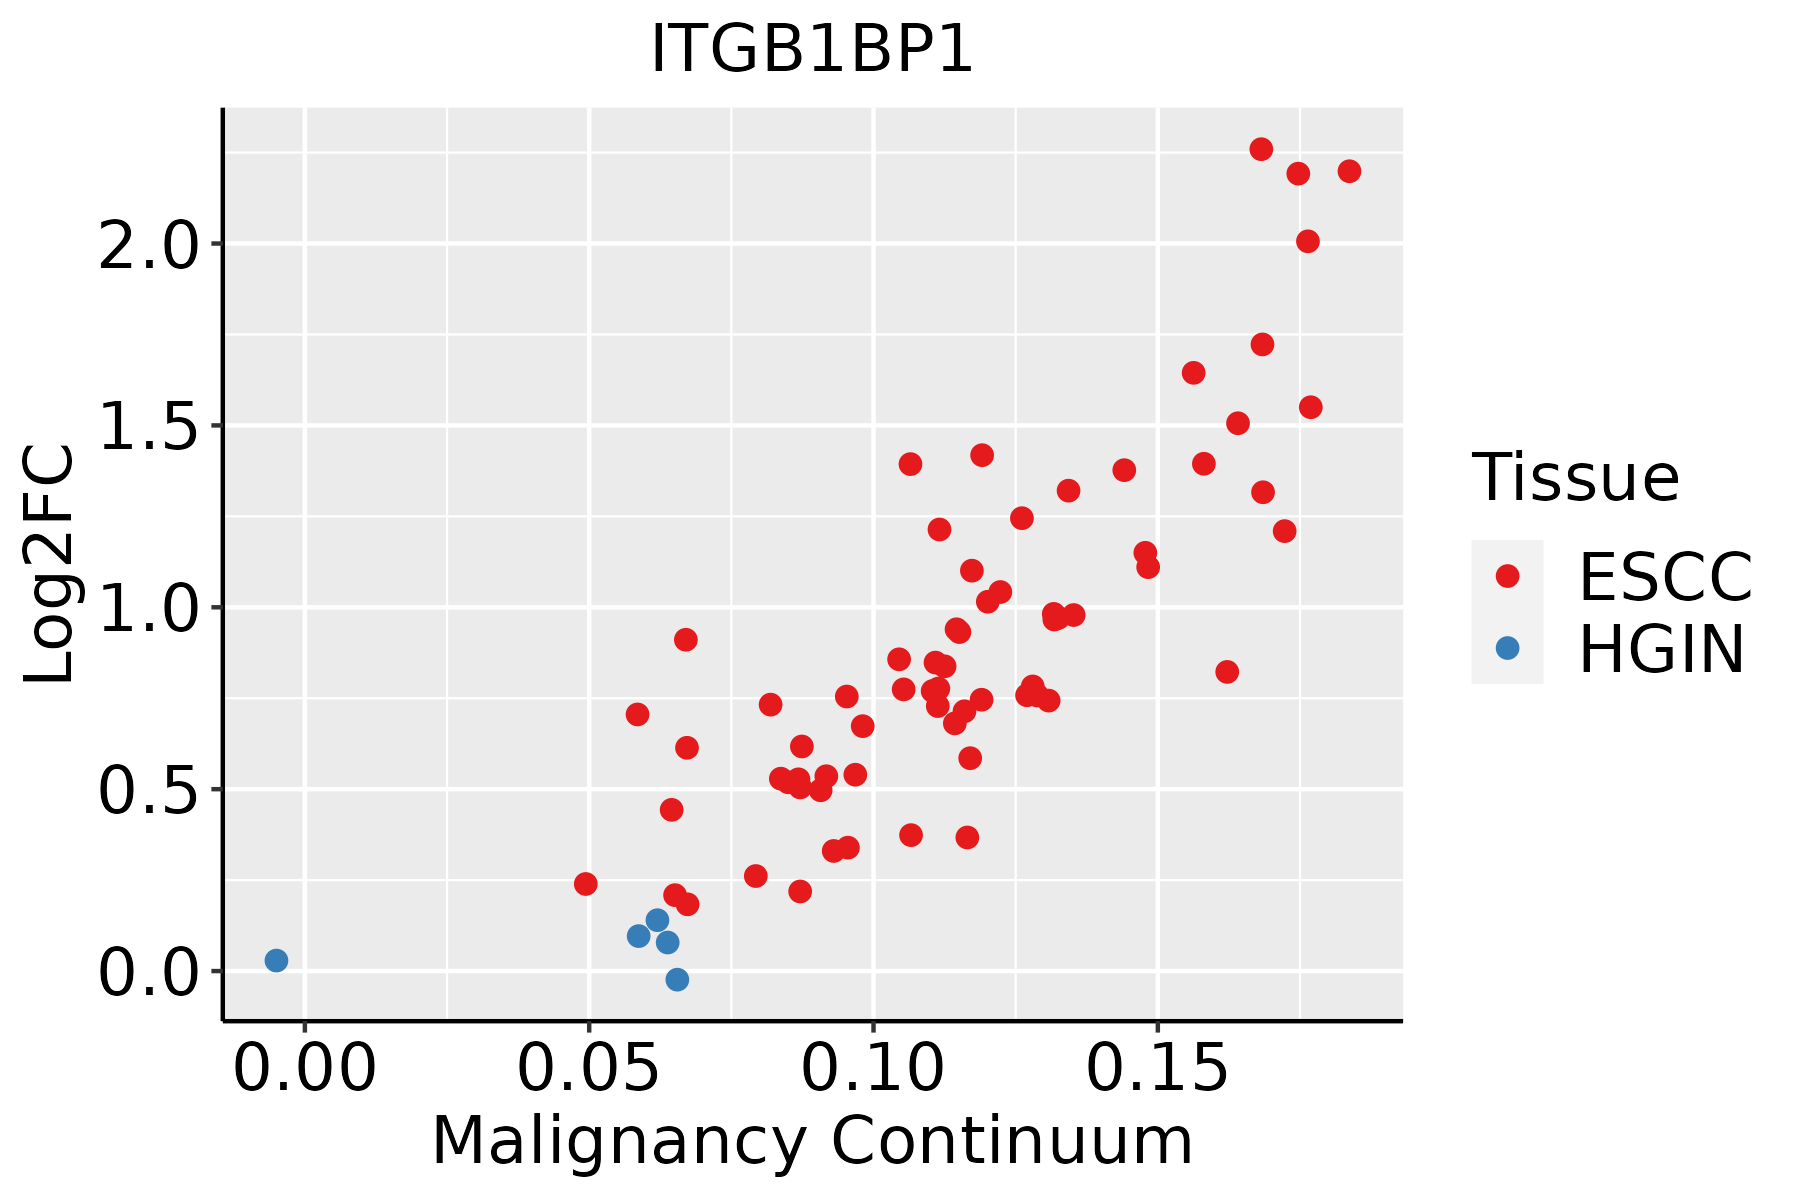
ESCC: Esophageal squamous cell carcinoma
HGIN: High-grade intraepithelial neoplasias
LGIN: Low-grade intraepithelial neoplasias
LiverThe image shows the transcriptomic changes along malignancy continuum.log2FC in expression of this searched gene in stem-like cells from each diseased tissue sample relative to stem-like cells in normal samples in each tissue plotted against the malignancy continuum. Samples are colored based on if they are from different disease stage.
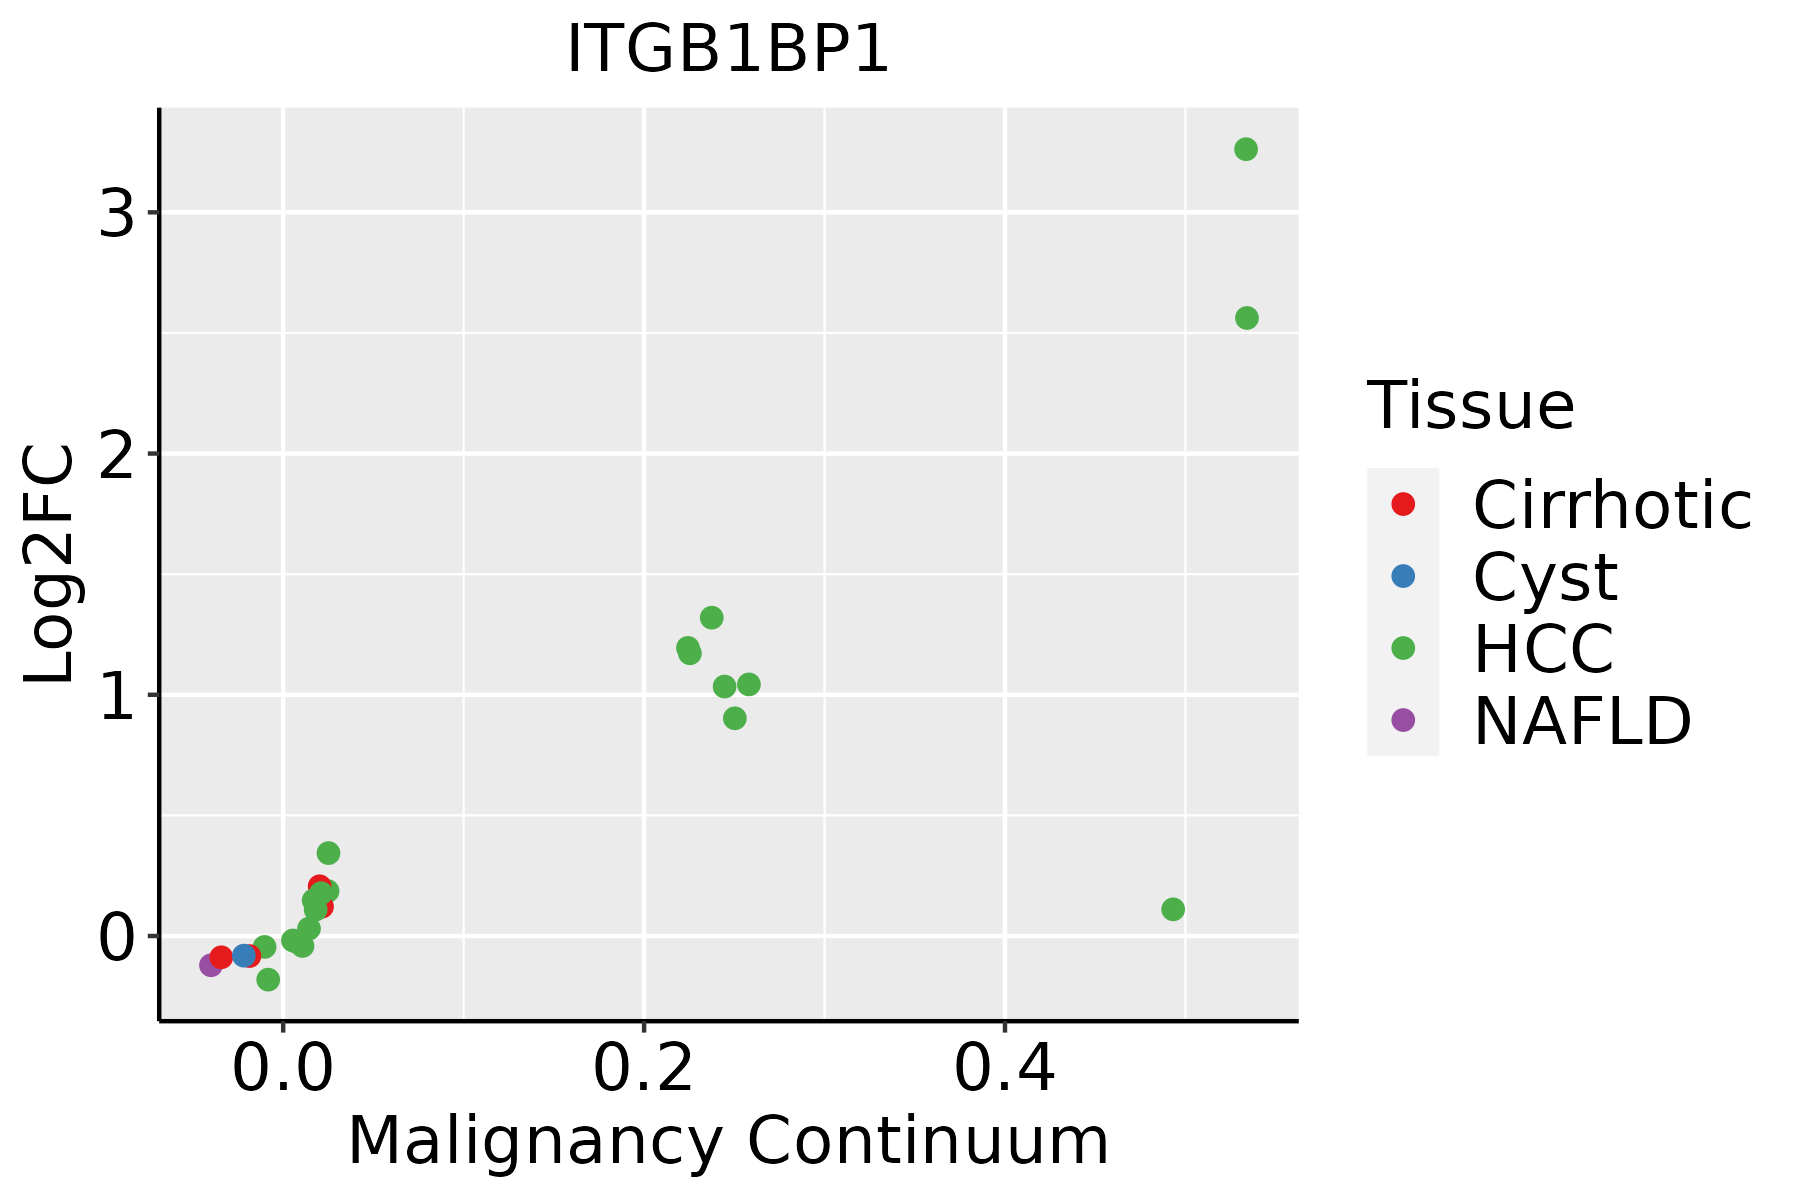
HCC: Hepatocellular carcinoma
NAFLD: Non-alcoholic fatty liver disease
Oral CavityThe image shows the transcriptomic changes along malignancy continuum.log2FC in expression of this searched gene in stem-like cells from each diseased tissue sample relative to stem-like cells in normal samples in each tissue plotted against the malignancy continuum. Samples are colored based on if they are from different disease stage.
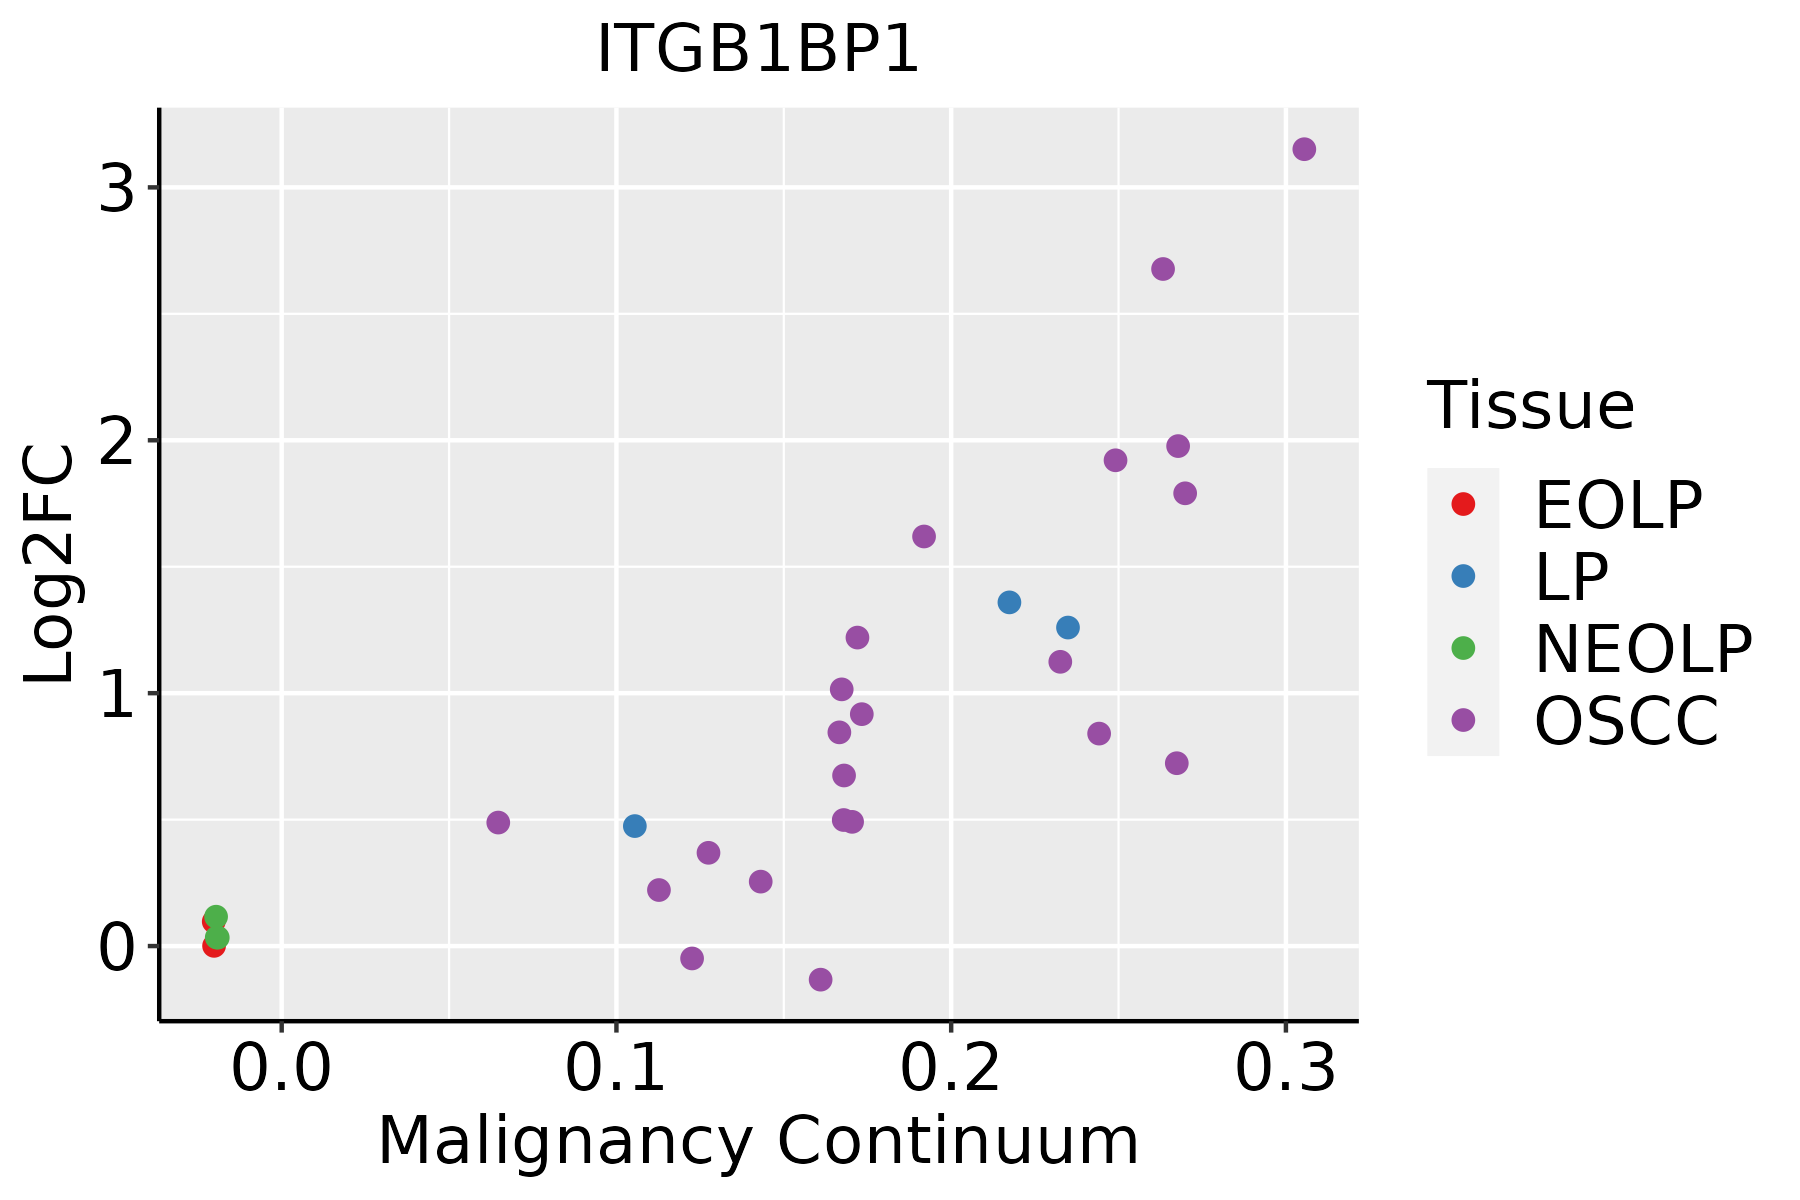
EOLP: Erosive Oral lichen planus
LP: leukoplakia
NEOLP: Non-erosive oral lichen planus
OSCC: Oral squamous cell carcinoma
SkinThe image shows the transcriptomic changes along malignancy continuum.log2FC in expression of this searched gene in stem-like cells from each diseased tissue sample relative to stem-like cells in normal samples in each tissue plotted against the malignancy continuum. Samples are colored based on if they are from different disease stage.AK: Actinic keratosis
cSCC: Cutaneous squamous cell carcinoma
SCCIS:squamous cell carcinoma in situ
ThyroidThe image shows the transcriptomic changes along malignancy continuum.log2FC in expression of this searched gene in stem-like cells from each diseased tissue sample relative to stem-like cells in normal samples in each tissue plotted against the malignancy continuum. Samples are colored based on if they are from different disease stage.
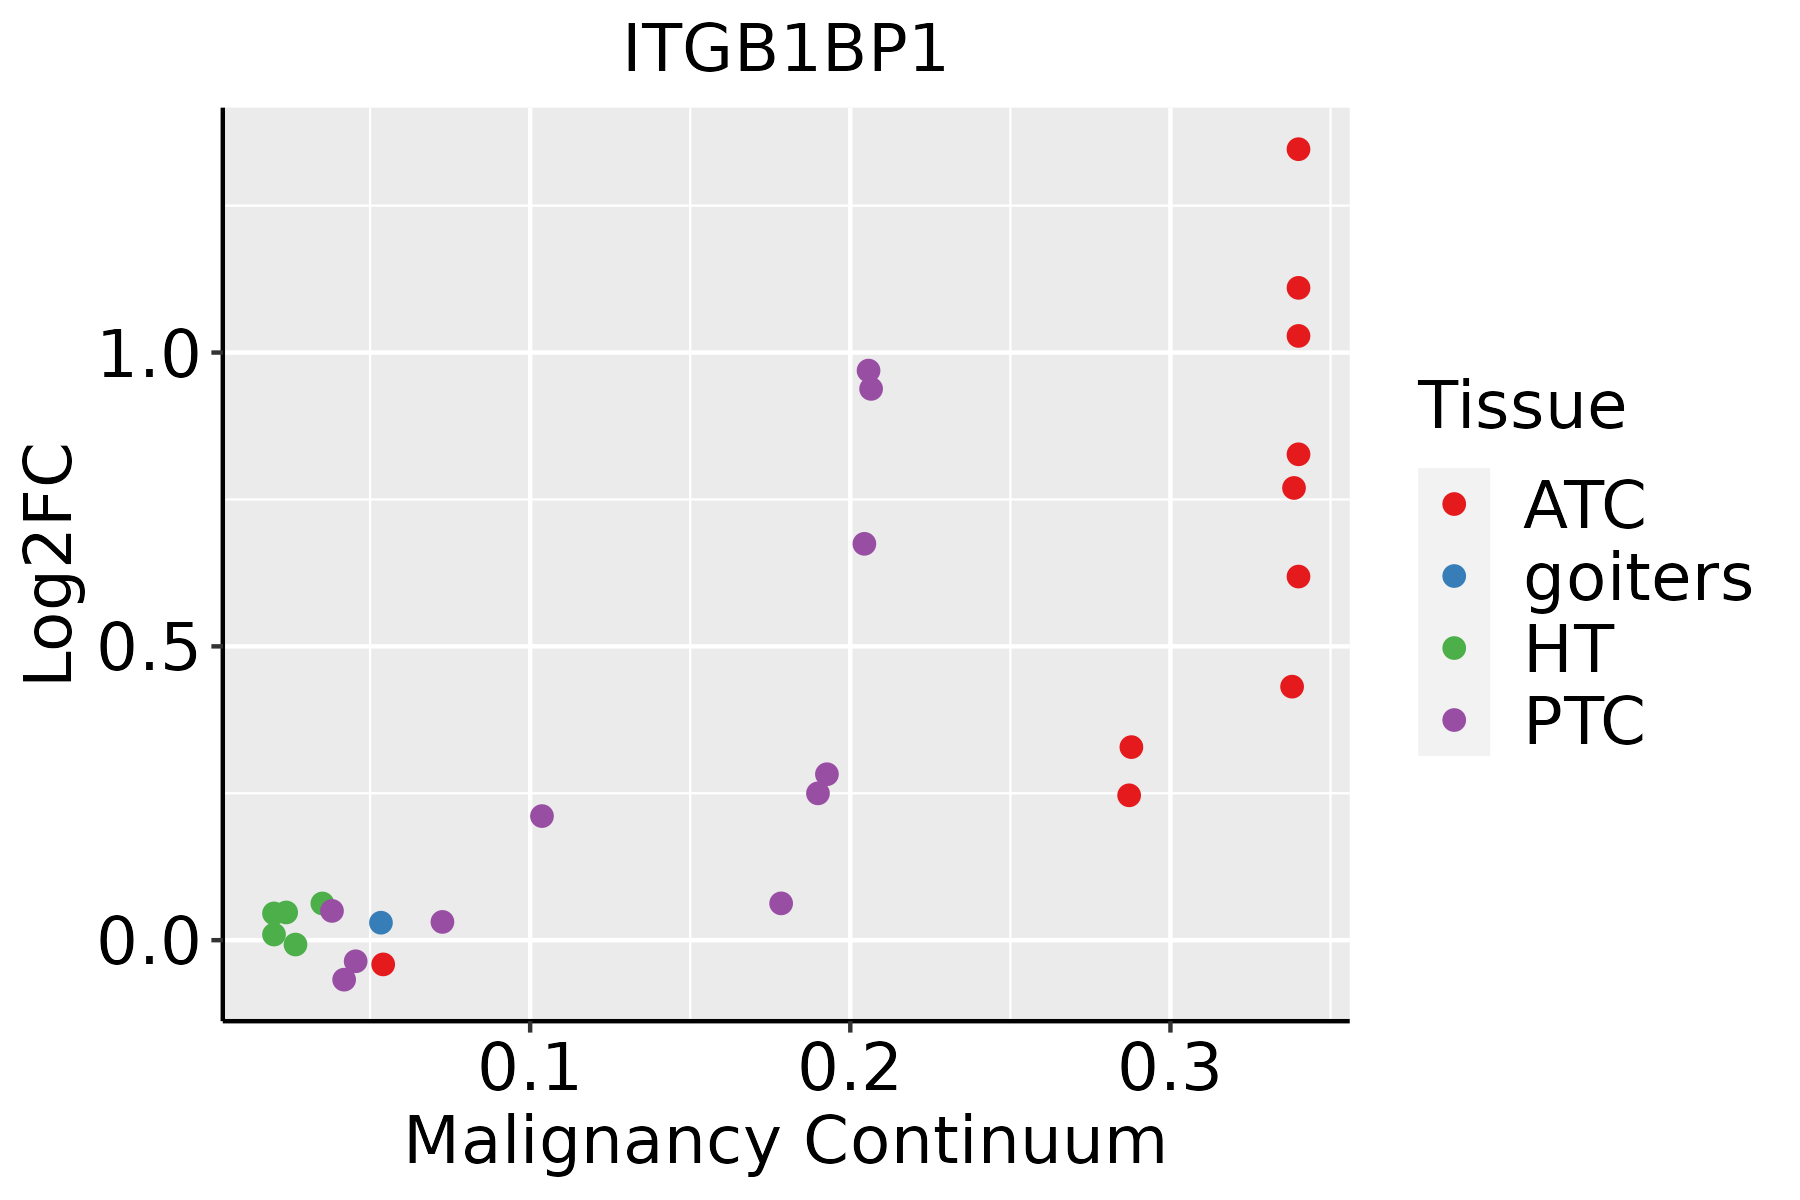
ATC: Anaplastic thyroid cancer
HT: Hashimoto's thyroiditis
PTC: Papillary thyroid cancer
∗log2FC in expression of this searched gene in stem-like cells from each diseased tissue sample relative to stem-like cells in normal samples in each tissue plotted against the malignancy continuum. Samples are colored based on if they are from different disease stage.

Top

Malignant transformation related pathway analysis

check buttonFind out the enriched GO biological processes and KEGG pathways involved in transition from healthy to precancer to cancer
check button Figure of enriched GO biological processes.
TissueDisease StageEnriched GO biological Processes
ColorectumADGO analysis - Figure of enriched GO biological processes: Top 15 enriched GO BP terms are showed in the bar plot of each disease state in each tissue. Each row represents a significant GO biological process which is colored according to the -log10(p.adjust).
ColorectumSERGO analysis - Figure of enriched GO biological processes: Top 15 enriched GO BP terms are showed in the bar plot of each disease state in each tissue. Each row represents a significant GO biological process which is colored according to the -log10(p.adjust).
ColorectumMSSGO analysis - Figure of enriched GO biological processes: Top 15 enriched GO BP terms are showed in the bar plot of each disease state in each tissue. Each row represents a significant GO biological process which is colored according to the -log10(p.adjust).
ColorectumMSI-HGO analysis - Figure of enriched GO biological processes: Top 15 enriched GO BP terms are showed in the bar plot of each disease state in each tissue. Each row represents a significant GO biological process which is colored according to the -log10(p.adjust).
ColorectumFAPGO analysis - Figure of enriched GO biological processes: Top 15 enriched GO BP terms are showed in the bar plot of each disease state in each tissue. Each row represents a significant GO biological process which is colored according to the -log10(p.adjust).
∗Top 15 enriched GO BP terms are showed in the bar plot of each disease state in each tissue. Each row represents a significant GO biological process which is colored according to the -log10(p.adjust).
Page: 1 2 3 4 5 6 7 8 9 

check button Enriched GO biological processes.
GO IDTissueDisease StageDescriptionGene RatioBg Ratiopvaluep.adjustCount
GO:001063125SkincSCCepithelial cell migration115/4864357/187234.64e-032.37e-02115
GO:004586025SkincSCCpositive regulation of protein kinase activity123/4864386/187235.23e-032.64e-02123
GO:005189422SkincSCCpositive regulation of focal adhesion assembly14/486428/187235.47e-032.73e-0214
GO:000721922SkincSCCNotch signaling pathway60/4864172/187235.82e-032.87e-0260
GO:009013225SkincSCCepithelium migration115/4864360/187236.20e-033.04e-02115
GO:00513026SkincSCCregulation of cell division61/4864177/187237.34e-033.47e-0261
GO:000716224SkincSCCnegative regulation of cell adhesion98/4864303/187237.45e-033.50e-0298
GO:0032231111SkincSCCregulation of actin filament bundle assembly39/4864105/187237.56e-033.53e-0239
GO:19054765SkincSCCnegative regulation of protein localization to membrane15/486432/187238.65e-034.00e-0215
GO:001081221SkincSCCnegative regulation of cell-substrate adhesion27/486468/187239.07e-034.16e-0227
GO:00019531SkincSCCnegative regulation of cell-matrix adhesion18/486441/187239.64e-034.31e-0218
GO:009013025SkincSCCtissue migration115/4864365/187239.81e-034.33e-02115
GO:000166727SkincSCCameboidal-type cell migration146/4864475/187231.05e-024.58e-02146
GO:0032386111ThyroidPTCregulation of intracellular transport202/5968337/187231.12e-263.93e-24202
GO:0033157112ThyroidPTCregulation of intracellular protein transport149/5968229/187233.83e-251.15e-22149
GO:0032388112ThyroidPTCpositive regulation of intracellular transport132/5968202/187231.10e-222.57e-20132
GO:0090316110ThyroidPTCpositive regulation of intracellular protein transport109/5968160/187234.20e-217.79e-19109
GO:0006605113ThyroidPTCprotein targeting180/5968314/187236.81e-211.19e-18180
GO:1903829113ThyroidPTCpositive regulation of cellular protein localization162/5968276/187232.40e-203.52e-18162
GO:0051098113ThyroidPTCregulation of binding195/5968363/187233.21e-183.37e-16195
Page: 1 2 3 4 5 6 7 8 9 10 11 12 13 14 15 16 17 18 19 20 21 22 23 24 25 26 27 28 29 30 31 32 33 34 35 36 37 38 39 40 41 42 43 

check button Enriched KEGG pathways.
Pathway IDTissueDisease StageDescriptionGene RatioBg Ratiopvaluep.adjustqvalueCount
Page: 1 

Top

Cell-cell communication analysis

check buttonIdentification of potential cell-cell interactions between two cell types and their ligand-receptor pairs for different disease states
LigandReceptorLRpairPathwayTissueDisease Stage
Page: 1 

Top

Single-cell gene regulatory network inference analysis

check buttonFind out the significant the regulons (TFs) and the target genes of each regulon across cell types for different disease states
TFCell TypeTissueDisease StageTarget GeneRSSRegulon Activity
∗The dot plots of a searched regulon are shown for all cell subpopulations in each disease state of each tissue based on the regulon specific score inferred using pySCENIC and by calculating the average expression.
Page: 1 

Top

Somatic mutation of malignant transformation related genes

check buttonAnnotation of somatic variants for genes involved in malignant transformation
Hugo SymbolVariant ClassVariant ClassificationdbSNP RSHGVScHGVSpHGVSp ShortSWISSPROTBIOTYPESIFTPolyPhenTumor Sample BarcodeTissueHistologySexAgeStageTherapy TypesDrugsOutcome
ITGB1BP1SNVMissense_Mutationc.592N>Ap.Glu198Lysp.E198KO14713protein_codingtolerated(0.25)benign(0.185)TCGA-D8-A1XQ-01Breastbreast invasive carcinomaFemale>=65I/IIUnknownUnknownSD
ITGB1BP1SNVMissense_Mutationc.83N>Gp.Ser28Cysp.S28CO14713protein_codingtolerated(0.12)probably_damaging(0.996)TCGA-JW-A5VL-01Cervixcervical & endocervical cancerFemale<65I/IIUnknownUnknownSD
ITGB1BP1SNVMissense_Mutationrs773209764c.8G>Ap.Arg3Hisp.R3HO14713protein_codingdeleterious_low_confidence(0.01)probably_damaging(0.991)TCGA-AA-A00N-01Colorectumcolon adenocarcinomaMale>=65I/IIUnknownUnknownPD
ITGB1BP1SNVMissense_Mutationc.83N>Ap.Ser28Tyrp.S28YO14713protein_codingdeleterious(0.03)probably_damaging(0.995)TCGA-A5-A0G2-01Endometriumuterine corpus endometrioid carcinomaFemale<65III/IVUnknownUnknownSD
ITGB1BP1SNVMissense_Mutationrs376533619c.317C>Tp.Pro106Leup.P106LO14713protein_codingtolerated(0.31)benign(0.007)TCGA-AP-A059-01Endometriumuterine corpus endometrioid carcinomaFemale>=65I/IIUnknownUnknownSD
ITGB1BP1SNVMissense_Mutationnovelc.29N>Ap.Ser10Asnp.S10NO14713protein_codingtolerated_low_confidence(0.19)probably_damaging(0.95)TCGA-AP-A0LM-01Endometriumuterine corpus endometrioid carcinomaFemale<65III/IVChemotherapycisplatinSD
ITGB1BP1SNVMissense_Mutationnovelc.122G>Ap.Ser41Asnp.S41NO14713protein_codingdeleterious(0.03)probably_damaging(0.988)TCGA-B5-A1MX-01Endometriumuterine corpus endometrioid carcinomaFemale<65I/IIHormone TherapymegaceSD
ITGB1BP1SNVMissense_Mutationnovelc.526N>Gp.Ser176Glyp.S176GO14713protein_codingtolerated(0.13)possibly_damaging(0.59)TCGA-BK-A6W3-01Endometriumuterine corpus endometrioid carcinomaFemale<65I/IIUnknownUnknownSD
ITGB1BP1SNVMissense_Mutationnovelc.439G>Ap.Gly147Serp.G147SO14713protein_codingtolerated(0.27)probably_damaging(0.999)TCGA-EO-A22R-01Endometriumuterine corpus endometrioid carcinomaFemale<65I/IIUnknownUnknownSD
ITGB1BP1SNVMissense_Mutationrs771640299c.568N>Ap.Ala190Thrp.A190TO14713protein_codingtolerated(0.21)benign(0.207)TCGA-EO-A22U-01Endometriumuterine corpus endometrioid carcinomaFemale>=65I/IIUnknownUnknownSD
Page: 1 2 

Top

Related drugs of malignant transformation related genes

check buttonIdentification of chemicals and drugs interact with genes involved in malignant transfromation
(DGIdb 4.0)
Entrez IDSymbolCategoryInteraction TypesDrug Claim NameDrug NamePMIDs
Page: 1