Schematic overview of the cellular and molecular mechanisms involved in the cancer progression, including the proposed cellular and molecular mechanisms in cancer cells trajectory. AT1: alveolar type 1 cells; AT2: alveolar type 2 cells; AAH: atypical adenomatous hyperplasia; AIS: adenocarcinoma in situ; MIA: minimally invasive adenocarcinoma; IA: invasive adenocarcinoma; EMT: epithelial-mesenchymal transition

Home

Download

Statistics

Help

Contact

Center for Computational Systems Medicine
leaf

Gene summary

leaf

Malignant transformation analysis

leaf

Malignant transformation related pathway analysis

leaf

Cell-cell communication analysis

leaf

Single-cell gene regulatory network inference analysis

leaf

Somatic mutation of malignant transformation related genes

leaf

Related drugs of malignant transformation related genes

Gene: CARMIL1

Gene summary for CARMIL1

check button Gene summary.

Gene informationSpeciesHuman
Gene symbol

CARMIL1

Gene ID

55604

Gene namecapping protein regulator and myosin 1 linker 1
Gene AliasCARMIL
Cytomap6p22.2
Gene Typeprotein-coding
GO ID

GO:0000902

UniProtAcc

Q5VZK9


Top

Malignant transformation analysis

check button Identification of the aberrant gene expression in precancerous and cancerous lesions by comparing the gene expression of stem-like cells in diseased tissues with normal stem cells
check button Malignant transformation involving gene list.
Entrez IDSymbolReplicatesSpeciesOrganTissueAdj P-valueLog2FCMalignancy
55604CARMIL1CCI_1HumanCervixCC1.32e-181.34e+000.528
55604CARMIL1CCI_2HumanCervixCC7.71e-107.94e-010.5249
55604CARMIL1CCI_3HumanCervixCC1.18e-281.48e+000.516
55604CARMIL1CCII_1HumanCervixCC5.19e-054.20e-010.3249
55604CARMIL1sample3HumanCervixCC5.84e-062.61e-010.1387
55604CARMIL1T3HumanCervixCC3.60e-082.41e-010.1389
55604CARMIL1HTA11_3410_2000001011HumanColorectumAD1.76e-20-6.16e-010.0155
55604CARMIL1HTA11_2951_2000001011HumanColorectumAD1.12e-04-7.32e-010.0216
55604CARMIL1HTA11_347_2000001011HumanColorectumAD2.74e-136.76e-01-0.1954
55604CARMIL1HTA11_3361_2000001011HumanColorectumAD2.89e-04-4.98e-01-0.1207
55604CARMIL1HTA11_696_2000001011HumanColorectumAD2.89e-02-2.72e-01-0.1464
55604CARMIL1HTA11_546_2000001011HumanColorectumAD4.29e-04-3.91e-01-0.0842
55604CARMIL1HTA11_866_3004761011HumanColorectumAD1.38e-11-5.49e-010.096
55604CARMIL1HTA11_10623_2000001011HumanColorectumAD4.37e-06-3.50e-01-0.0177
55604CARMIL1HTA11_10711_2000001011HumanColorectumAD3.10e-06-5.31e-010.0338
55604CARMIL1HTA11_7696_3000711011HumanColorectumAD1.61e-20-5.60e-010.0674
55604CARMIL1HTA11_6818_2000001011HumanColorectumAD2.58e-06-5.16e-010.0112
55604CARMIL1HTA11_6818_2000001021HumanColorectumAD2.14e-05-5.03e-010.0588
55604CARMIL1HTA11_99999970781_79442HumanColorectumMSS1.01e-88-1.27e+000.294
55604CARMIL1HTA11_99999965062_69753HumanColorectumMSI-H5.16e-05-1.27e+000.3487
Page: 1 2 3 4 5 6 7 

check button Transcriptomic changes along malignancy continuum.
TissueExpression DynamicsAbbreviation
CervixThe image shows the transcriptomic changes along malignancy continuum.log2FC in expression of this searched gene in stem-like cells from each diseased tissue sample relative to stem-like cells in normal samples in each tissue plotted against the malignancy continuum. Samples are colored based on if they are from different disease stage.CC: Cervix cancer
HSIL_HPV: HPV-infected high-grade squamous intraepithelial lesions
N_HPV: HPV-infected normal cervix
Colorectum (GSE201348)The image shows the transcriptomic changes along malignancy continuum.log2FC in expression of this searched gene in stem-like cells from each diseased tissue sample relative to stem-like cells in normal samples in each tissue plotted against the malignancy continuum. Samples are colored based on if they are from different disease stage.FAP: Familial adenomatous polyposis
CRC: Colorectal cancer
Colorectum (HTA11)The image shows the transcriptomic changes along malignancy continuum.log2FC in expression of this searched gene in stem-like cells from each diseased tissue sample relative to stem-like cells in normal samples in each tissue plotted against the malignancy continuum. Samples are colored based on if they are from different disease stage.AD: Adenomas
SER: Sessile serrated lesions
MSI-H: Microsatellite-high colorectal cancer
MSS: Microsatellite stable colorectal cancer
EndometriumThe image shows the transcriptomic changes along malignancy continuum.log2FC in expression of this searched gene in stem-like cells from each diseased tissue sample relative to stem-like cells in normal samples in each tissue plotted against the malignancy continuum. Samples are colored based on if they are from different disease stage.AEH: Atypical endometrial hyperplasia
EEC: Endometrioid Cancer
GCThe image shows the transcriptomic changes along malignancy continuum.log2FC in expression of this searched gene in stem-like cells from each diseased tissue sample relative to stem-like cells in normal samples in each tissue plotted against the malignancy continuum. Samples are colored based on if they are from different disease stage.
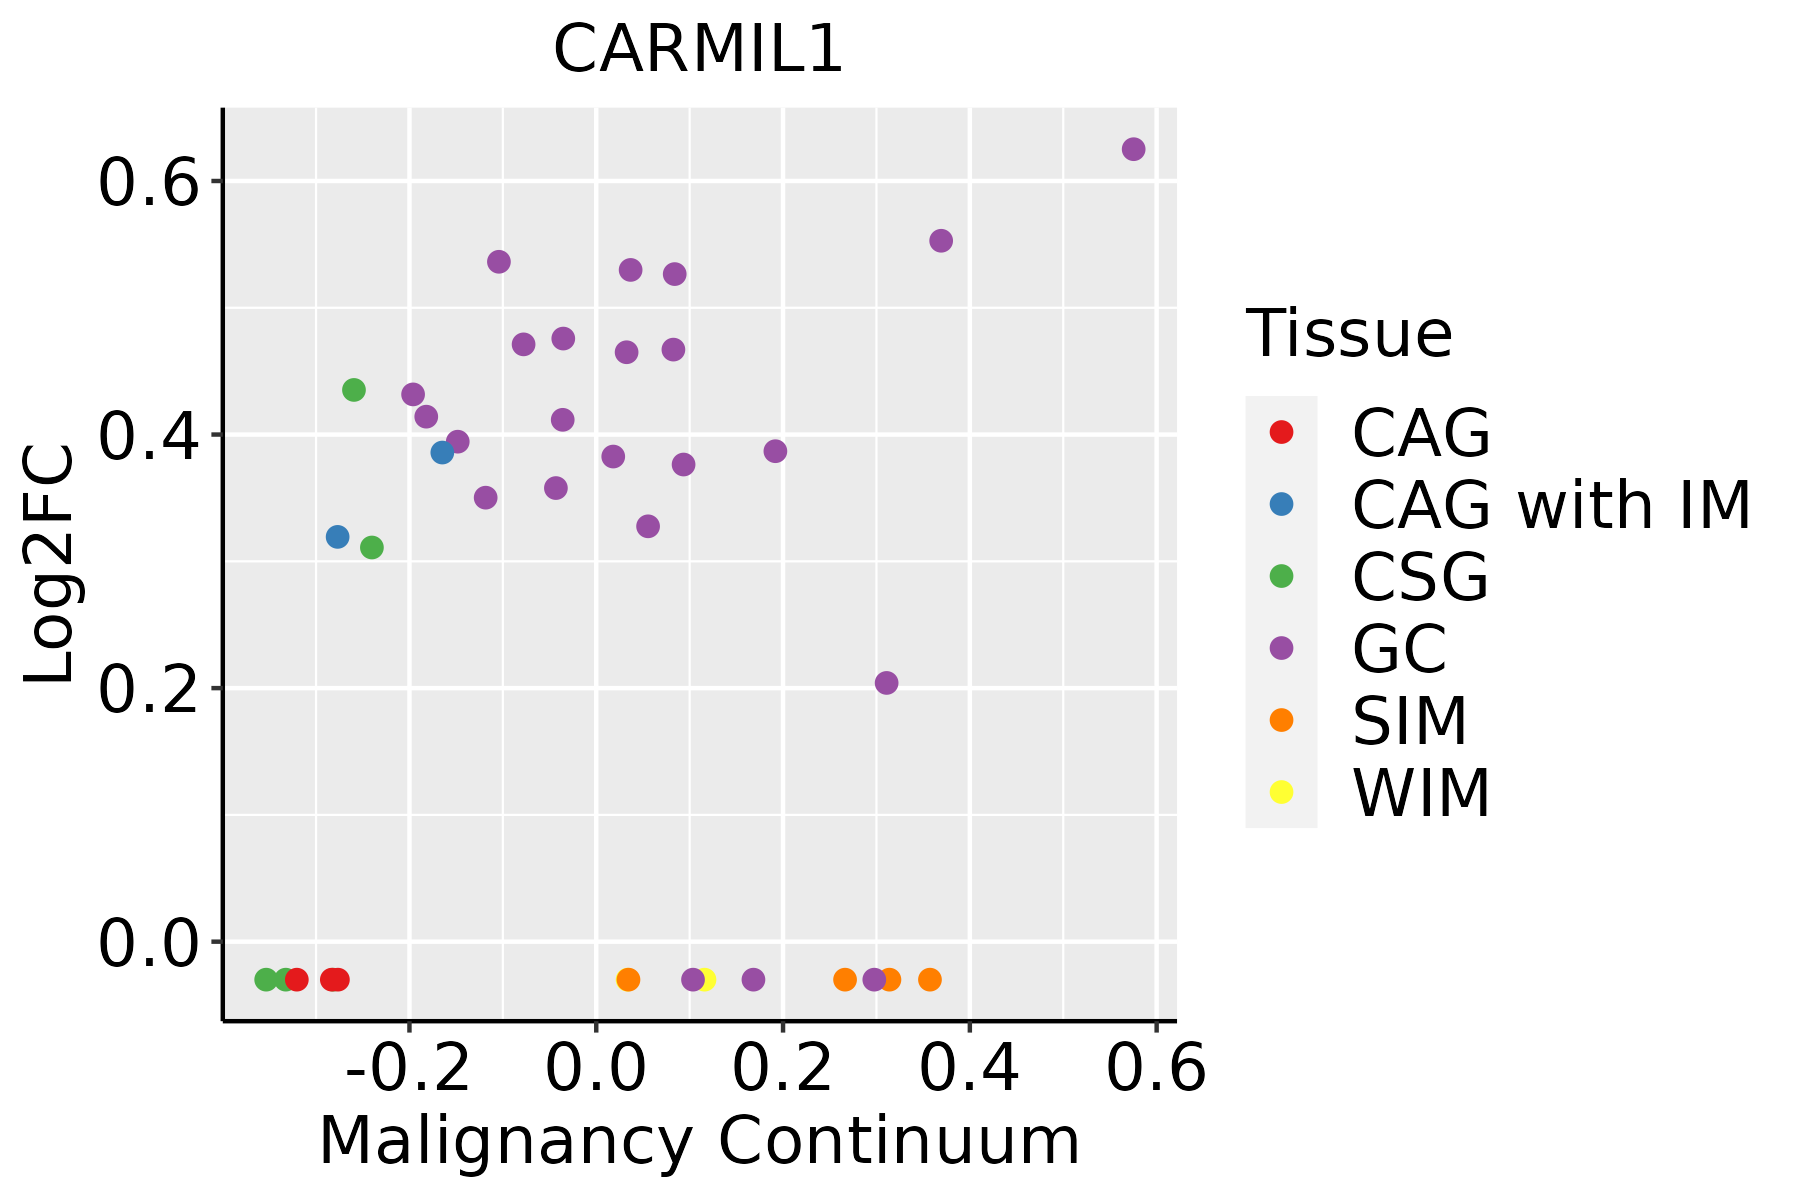
CAG: Chronic atrophic gastritis
CAG with IM: Chronic atrophic gastritis with intestinal metaplasia
CSG: Chronic superficial gastritis
GC: Gastric cancer
SIM: Severe intestinal metaplasia
WIM: Wild intestinal metaplasia
LiverThe image shows the transcriptomic changes along malignancy continuum.log2FC in expression of this searched gene in stem-like cells from each diseased tissue sample relative to stem-like cells in normal samples in each tissue plotted against the malignancy continuum. Samples are colored based on if they are from different disease stage.
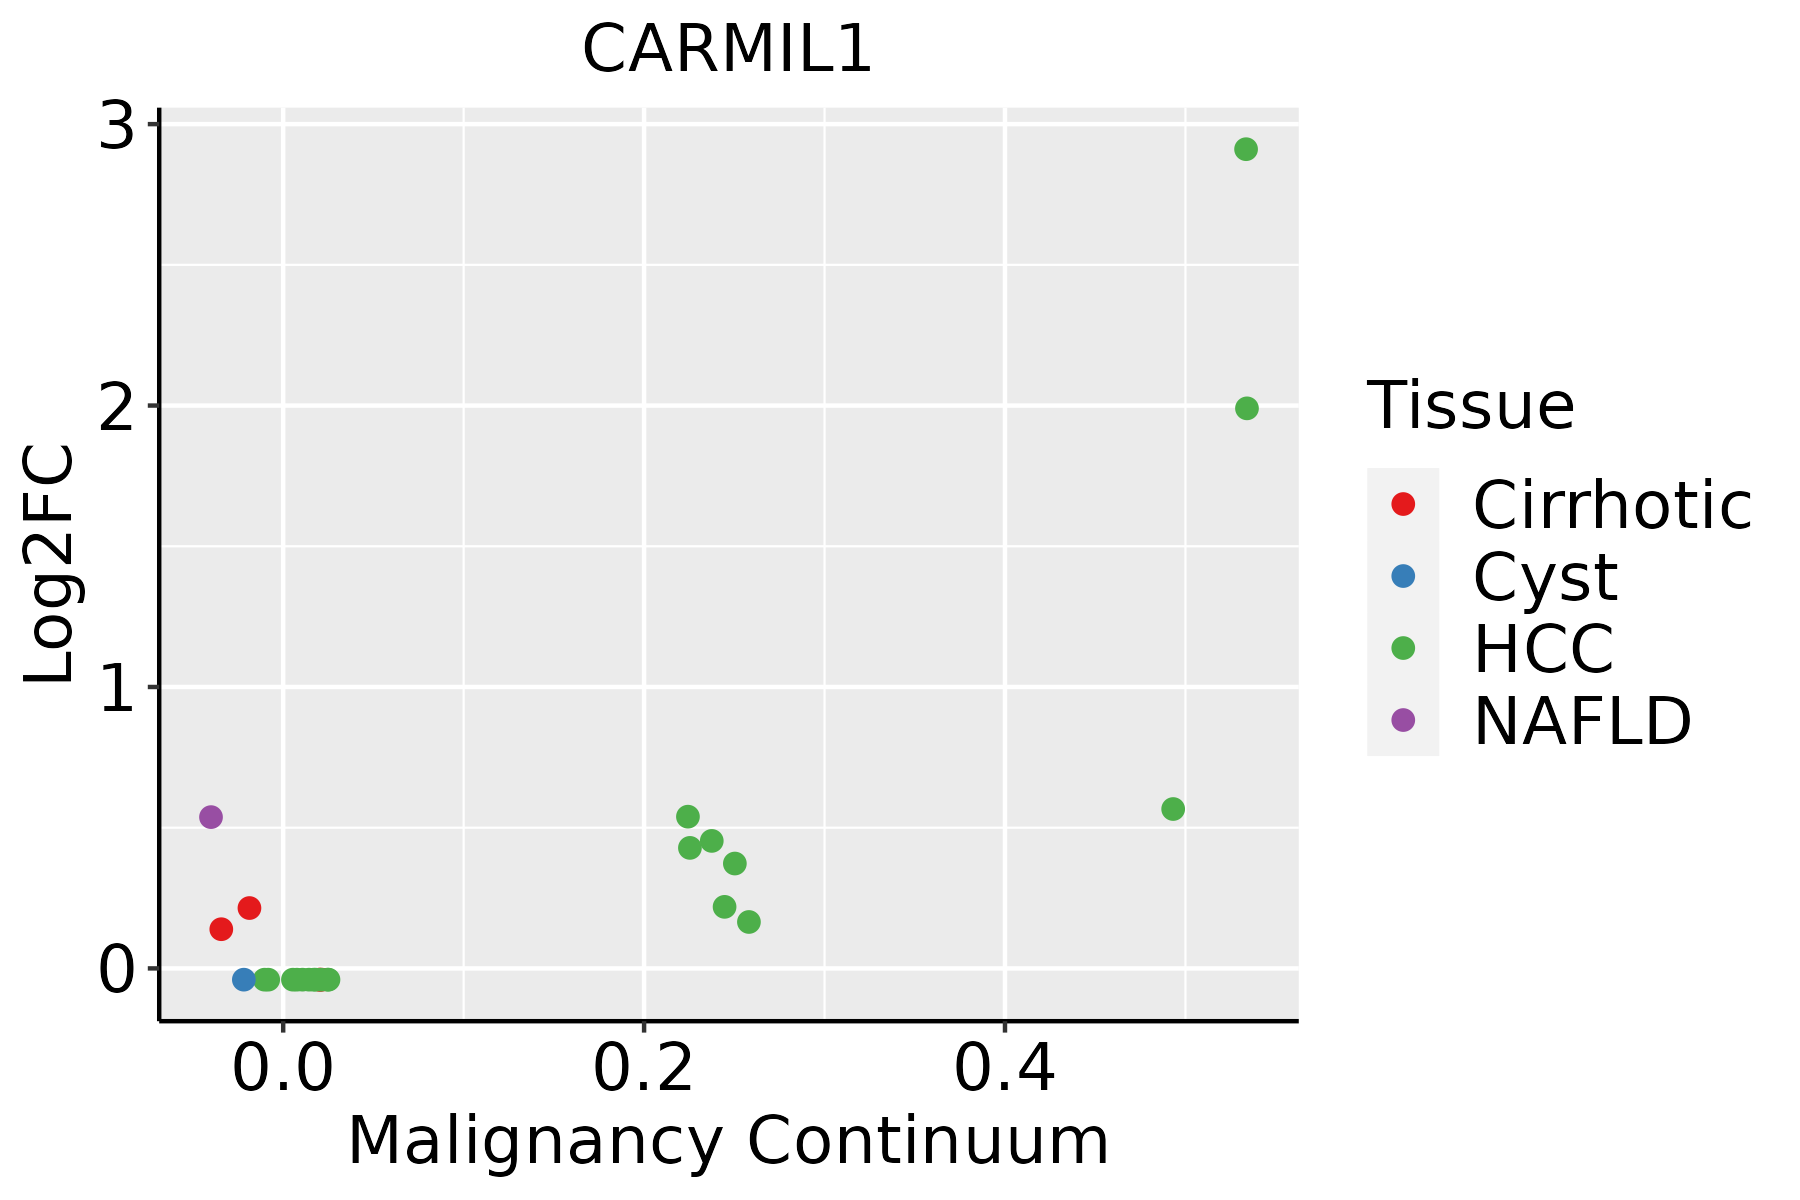
HCC: Hepatocellular carcinoma
NAFLD: Non-alcoholic fatty liver disease
LungThe image shows the transcriptomic changes along malignancy continuum.log2FC in expression of this searched gene in stem-like cells from each diseased tissue sample relative to stem-like cells in normal samples in each tissue plotted against the malignancy continuum. Samples are colored based on if they are from different disease stage.
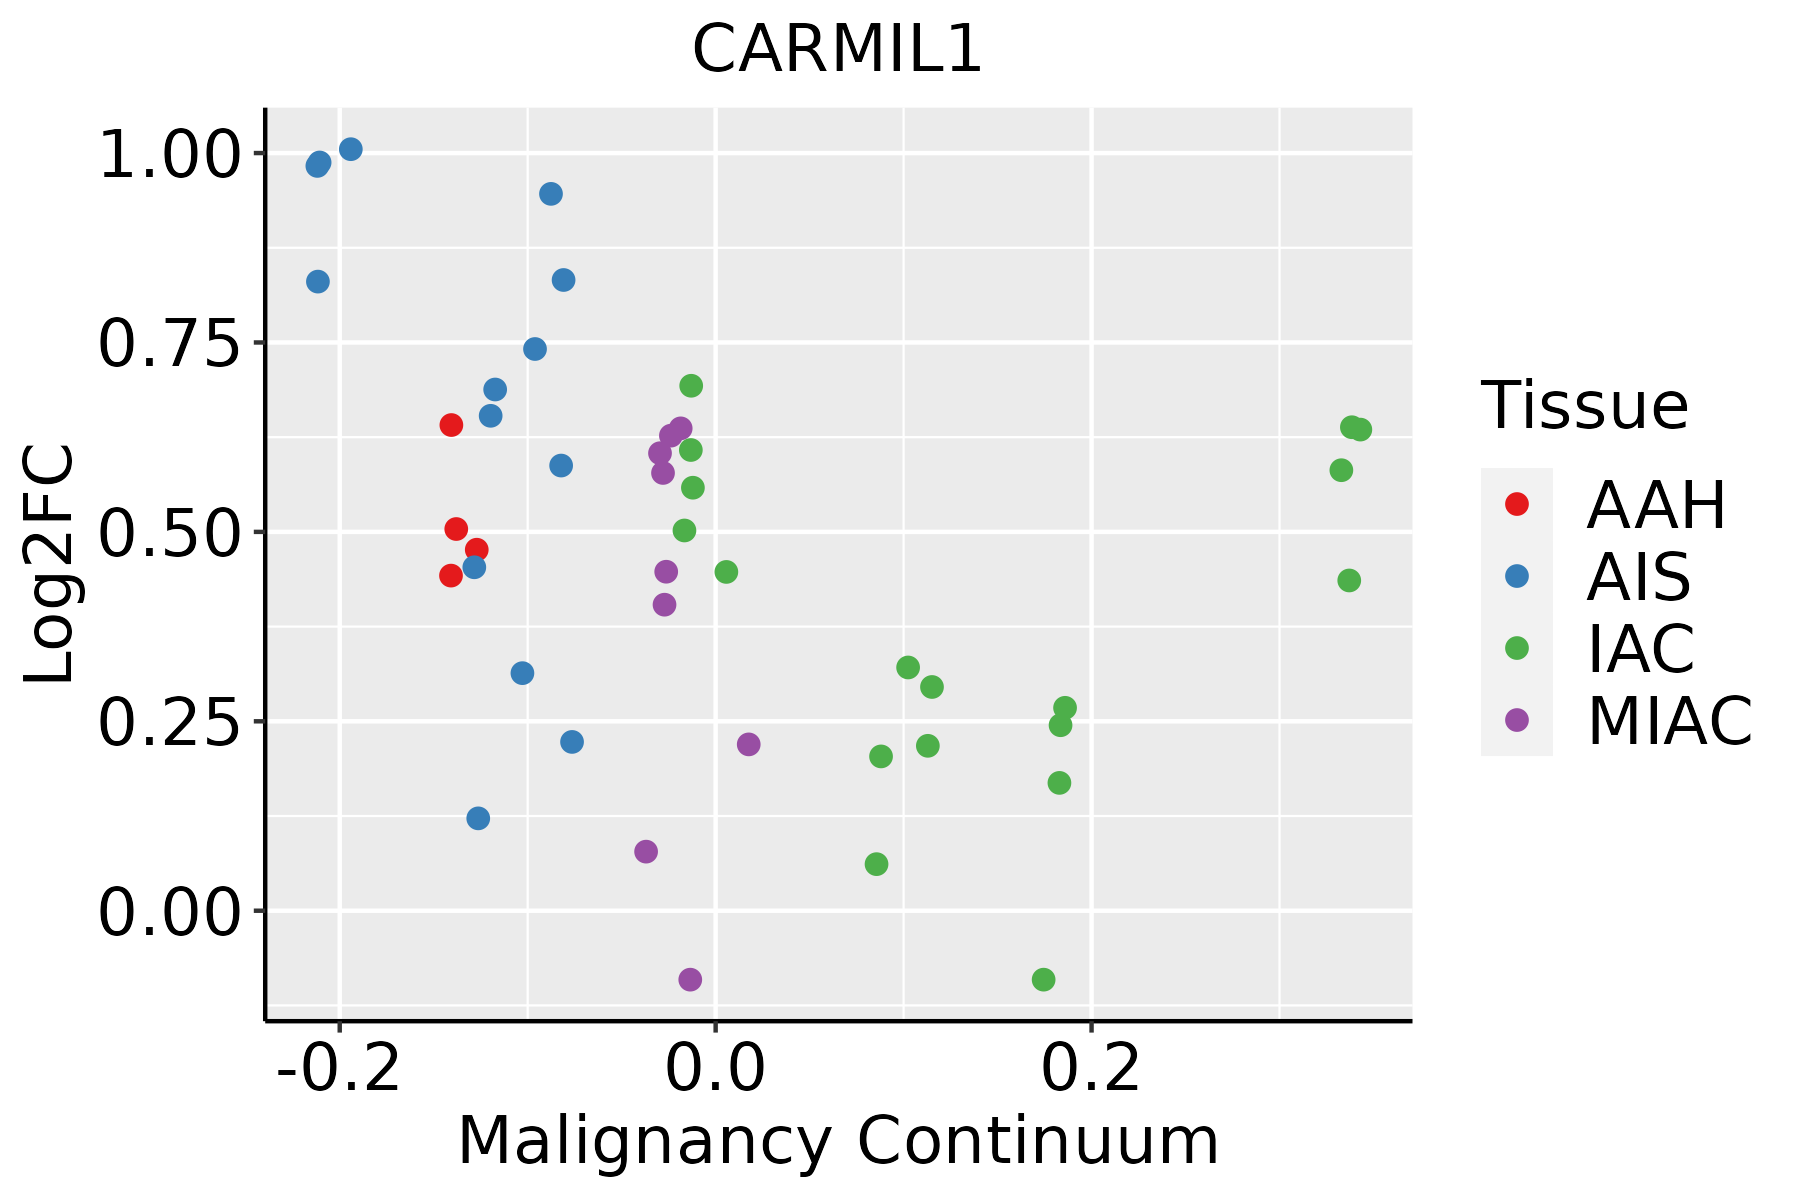
AAH: Atypical adenomatous hyperplasia
AIS: Adenocarcinoma in situ
IAC: Invasive lung adenocarcinoma
MIA: Minimally invasive adenocarcinoma
ProstateThe image shows the transcriptomic changes along malignancy continuum.log2FC in expression of this searched gene in stem-like cells from each diseased tissue sample relative to stem-like cells in normal samples in each tissue plotted against the malignancy continuum. Samples are colored based on if they are from different disease stage.
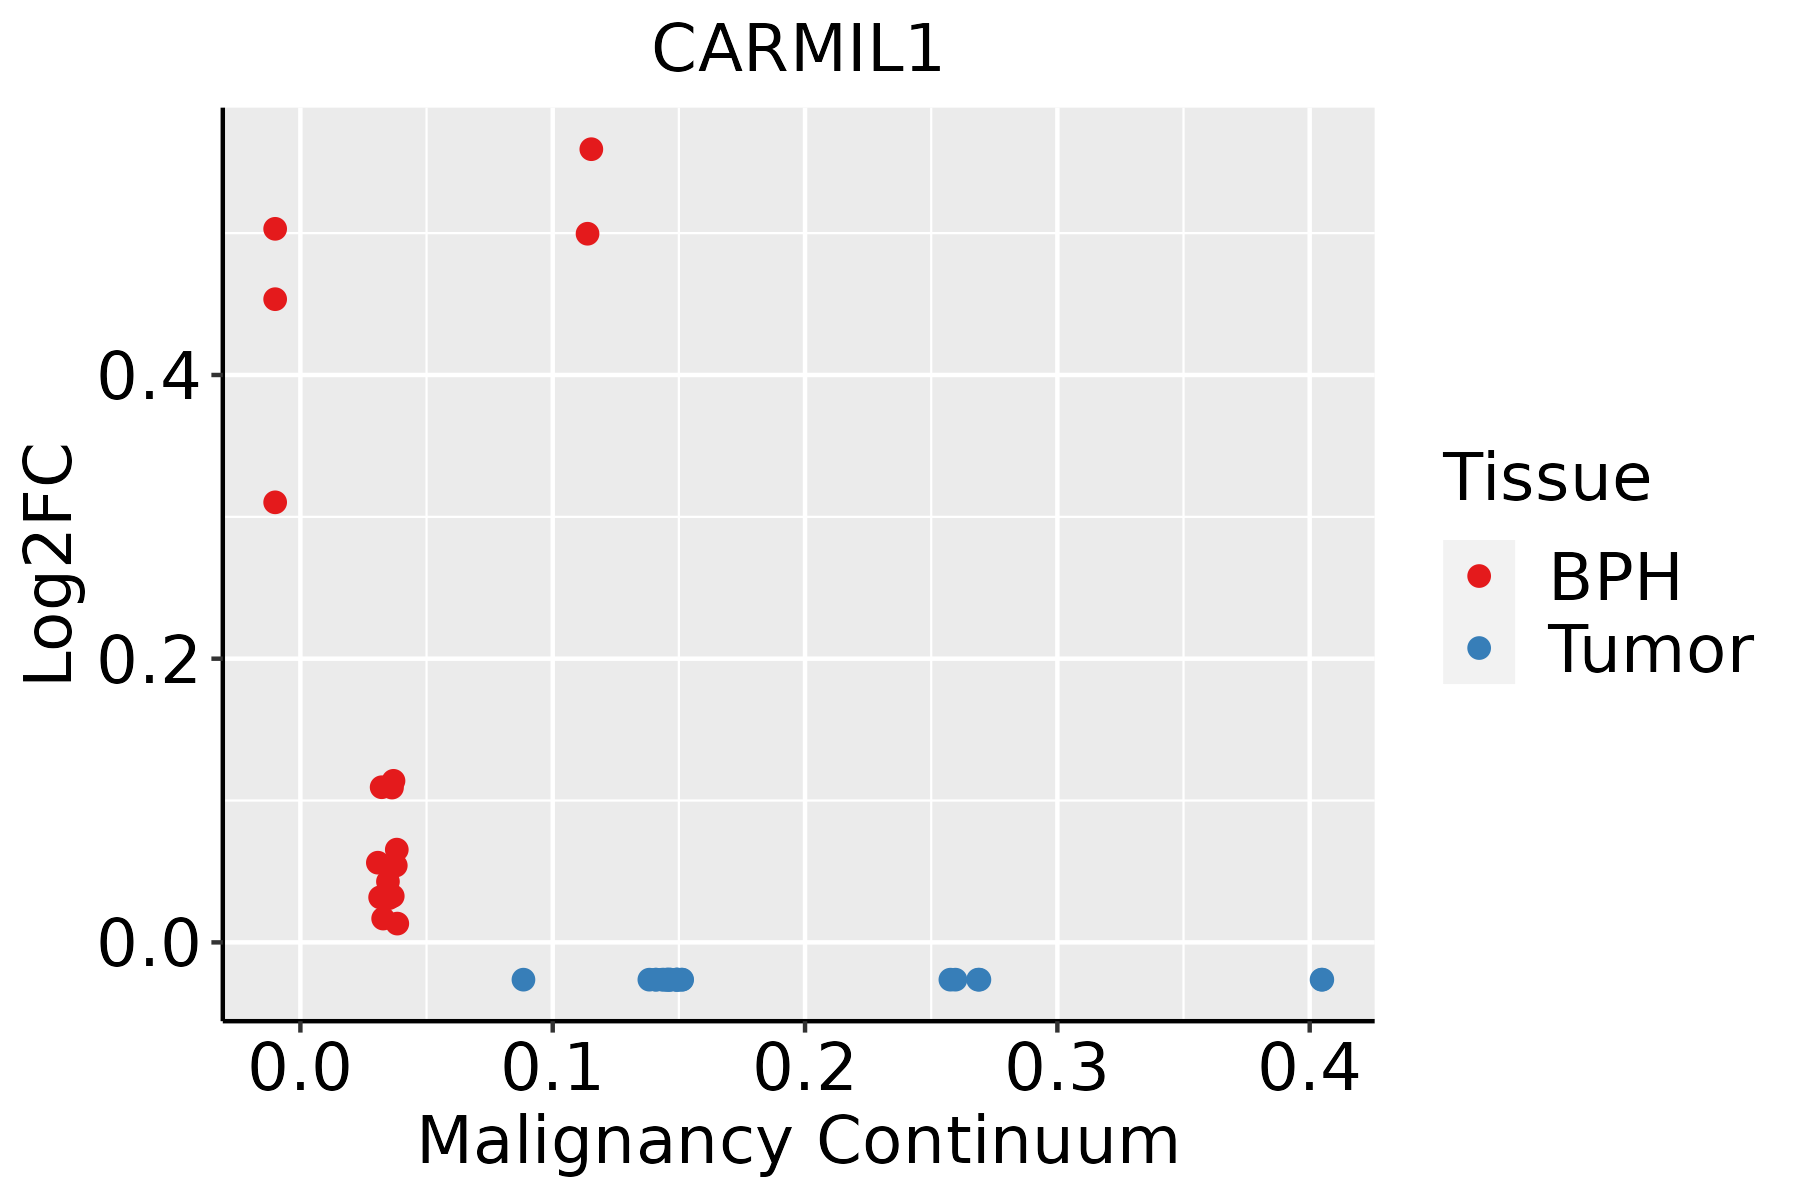
BPH: Benign Prostatic Hyperplasia
ThyroidThe image shows the transcriptomic changes along malignancy continuum.log2FC in expression of this searched gene in stem-like cells from each diseased tissue sample relative to stem-like cells in normal samples in each tissue plotted against the malignancy continuum. Samples are colored based on if they are from different disease stage.ATC: Anaplastic thyroid cancer
HT: Hashimoto's thyroiditis
PTC: Papillary thyroid cancer
∗log2FC in expression of this searched gene in stem-like cells from each diseased tissue sample relative to stem-like cells in normal samples in each tissue plotted against the malignancy continuum. Samples are colored based on if they are from different disease stage.

Top

Malignant transformation related pathway analysis

check buttonFind out the enriched GO biological processes and KEGG pathways involved in transition from healthy to precancer to cancer
check button Figure of enriched GO biological processes.
TissueDisease StageEnriched GO biological Processes
ColorectumADGO analysis - Figure of enriched GO biological processes: Top 15 enriched GO BP terms are showed in the bar plot of each disease state in each tissue. Each row represents a significant GO biological process which is colored according to the -log10(p.adjust).
ColorectumSERGO analysis - Figure of enriched GO biological processes: Top 15 enriched GO BP terms are showed in the bar plot of each disease state in each tissue. Each row represents a significant GO biological process which is colored according to the -log10(p.adjust).
ColorectumMSSGO analysis - Figure of enriched GO biological processes: Top 15 enriched GO BP terms are showed in the bar plot of each disease state in each tissue. Each row represents a significant GO biological process which is colored according to the -log10(p.adjust).
ColorectumMSI-HGO analysis - Figure of enriched GO biological processes: Top 15 enriched GO BP terms are showed in the bar plot of each disease state in each tissue. Each row represents a significant GO biological process which is colored according to the -log10(p.adjust).
ColorectumFAPGO analysis - Figure of enriched GO biological processes: Top 15 enriched GO BP terms are showed in the bar plot of each disease state in each tissue. Each row represents a significant GO biological process which is colored according to the -log10(p.adjust).
∗Top 15 enriched GO BP terms are showed in the bar plot of each disease state in each tissue. Each row represents a significant GO biological process which is colored according to the -log10(p.adjust).
Page: 1 2 3 4 5 6 7 8 9 

check button Enriched GO biological processes.
GO IDTissueDisease StageDescriptionGene RatioBg Ratiopvaluep.adjustCount
GO:00070156StomachGCactin filament organization67/1159442/187237.96e-122.20e-0967
GO:00432546StomachGCregulation of protein-containing complex assembly58/1159428/187231.48e-081.32e-0658
GO:00313346StomachGCpositive regulation of protein-containing complex assembly39/1159237/187232.00e-081.63e-0639
GO:19029036StomachGCregulation of supramolecular fiber organization53/1159383/187233.07e-082.39e-0653
GO:00329706StomachGCregulation of actin filament-based process54/1159397/187234.11e-082.85e-0654
GO:00615726StomachGCactin filament bundle organization30/1159161/187235.07e-083.40e-0630
GO:00510176StomachGCactin filament bundle assembly29/1159157/187231.03e-076.28e-0629
GO:00457856StomachGCpositive regulation of cell adhesion56/1159437/187231.79e-071.02e-0556
GO:01100536StomachGCregulation of actin filament organization41/1159278/187232.00e-071.11e-0541
GO:00226046StomachGCregulation of cell morphogenesis44/1159309/187232.01e-071.11e-0544
GO:00329566StomachGCregulation of actin cytoskeleton organization48/1159358/187233.57e-071.88e-0548
GO:19029056StomachGCpositive regulation of supramolecular fiber organization32/1159209/187231.88e-068.30e-0532
GO:00512586StomachGCprotein polymerization38/1159297/187231.72e-055.40e-0438
GO:00322716StomachGCregulation of protein polymerization32/1159233/187231.90e-055.83e-0432
GO:00322316StomachGCregulation of actin filament bundle assembly19/1159105/187232.15e-056.45e-0419
GO:0031529StomachGCruffle organization13/115956/187232.85e-057.90e-0413
GO:00081546StomachGCactin polymerization or depolymerization30/1159218/187233.29e-058.94e-0430
GO:19000246StomachGCregulation of substrate adhesion-dependent cell spreading13/115957/187233.48e-059.32e-0413
GO:00514926StomachGCregulation of stress fiber assembly17/115991/187233.76e-059.76e-0417
GO:01100206StomachGCregulation of actomyosin structure organization18/1159100/187233.77e-059.76e-0418
Page: 1 2 3 4 5 6 7 8 9 10 11 12 13 14 15 16 17 18 19 20 21 22 23 24 25 26 27 28 29 30 31 32 33 34 35 36 37 38 39 40 41 42 43 44 45 46 

check button Enriched KEGG pathways.
Pathway IDTissueDisease StageDescriptionGene RatioBg Ratiopvaluep.adjustqvalueCount
Page: 1 

Top

Cell-cell communication analysis

check buttonIdentification of potential cell-cell interactions between two cell types and their ligand-receptor pairs for different disease states
LigandReceptorLRpairPathwayTissueDisease Stage
Page: 1 

Top

Single-cell gene regulatory network inference analysis

check buttonFind out the significant the regulons (TFs) and the target genes of each regulon across cell types for different disease states
TFCell TypeTissueDisease StageTarget GeneRSSRegulon Activity
∗The dot plots of a searched regulon are shown for all cell subpopulations in each disease state of each tissue based on the regulon specific score inferred using pySCENIC and by calculating the average expression.
Page: 1 

Top

Somatic mutation of malignant transformation related genes

check buttonAnnotation of somatic variants for genes involved in malignant transformation
Hugo SymbolVariant ClassVariant ClassificationdbSNP RSHGVScHGVSpHGVSp ShortSWISSPROTBIOTYPESIFTPolyPhenTumor Sample BarcodeTissueHistologySexAgeStageTherapy TypesDrugsOutcome
CARMIL1SNVMissense_Mutationnovelc.1550N>Ap.Gly517Aspp.G517DQ5VZK9protein_codingdeleterious(0)probably_damaging(1)TCGA-A8-A09Z-01Breastbreast invasive carcinomaFemale>=65I/IIUnknownUnknownSD
CARMIL1SNVMissense_Mutationc.3439G>Tp.Asp1147Tyrp.D1147YQ5VZK9protein_codingdeleterious_low_confidence(0)probably_damaging(0.987)TCGA-AC-A23H-01Breastbreast invasive carcinomaFemale>=65I/IIUnknownUnknownPD
CARMIL1SNVMissense_Mutationc.1533N>Gp.Ile511Metp.I511MQ5VZK9protein_codingdeleterious(0)probably_damaging(0.999)TCGA-D8-A1XK-01Breastbreast invasive carcinomaFemale<65I/IIChemotherapydoxorubicine+cyclophosphamideSD
CARMIL1SNVMissense_Mutationrs555687744c.410N>Ap.Arg137Hisp.R137HQ5VZK9protein_codingdeleterious(0.01)probably_damaging(0.998)TCGA-D8-A27W-01Breastbreast invasive carcinomaFemale<65III/IVChemotherapydoxorubicine+cyclophosphamideSD
CARMIL1SNVMissense_Mutationc.1496N>Tp.Ser499Phep.S499FQ5VZK9protein_codingtolerated(0.12)probably_damaging(0.987)TCGA-E2-A10C-01Breastbreast invasive carcinomaFemale<65I/IIChemotherapycytoxanSD
CARMIL1SNVMissense_Mutationnovelc.3268N>Ap.Glu1090Lysp.E1090KQ5VZK9protein_codingdeleterious_low_confidence(0.03)benign(0.092)TCGA-E9-A22E-01Breastbreast invasive carcinomaFemale<65III/IVChemotherapycyclophosphaneSD
CARMIL1SNVMissense_Mutationc.3269N>Tp.Glu1090Valp.E1090VQ5VZK9protein_codingdeleterious_low_confidence(0.01)benign(0.125)TCGA-E9-A22E-01Breastbreast invasive carcinomaFemale<65III/IVChemotherapycyclophosphaneSD
CARMIL1SNVMissense_Mutationc.3402N>Tp.Glu1134Aspp.E1134DQ5VZK9protein_codingtolerated_low_confidence(0.12)benign(0.009)TCGA-E9-A22E-01Breastbreast invasive carcinomaFemale<65III/IVChemotherapycyclophosphaneSD
CARMIL1SNVMissense_Mutationrs767321872c.3466C>Tp.Arg1156Trpp.R1156WQ5VZK9protein_codingdeleterious_low_confidence(0.03)probably_damaging(0.969)TCGA-GI-A2C8-01Breastbreast invasive carcinomaFemale<65III/IVUnspecificAdriamycinSD
CARMIL1SNVMissense_Mutationnovelc.3489N>Tp.Met1163Ilep.M1163IQ5VZK9protein_codingdeleterious_low_confidence(0)probably_damaging(0.958)TCGA-LL-A5YN-01Breastbreast invasive carcinomaFemale<65I/IIChemotherapycarboplatinSD
Page: 1 2 3 4 5 6 7 8 9 10 11 12 13 14 15 

Top

Related drugs of malignant transformation related genes

check buttonIdentification of chemicals and drugs interact with genes involved in malignant transfromation
(DGIdb 4.0)
Entrez IDSymbolCategoryInteraction TypesDrug Claim NameDrug NamePMIDs
Page: 1