
|
|||||
|
 | |
| |
| |
| |
| |
| |
|
Gene: ATP5IF1 |
Gene summary for ATP5IF1 |
| Gene information | Species | Human | Gene symbol | ATP5IF1 | Gene ID | 93974 |
| Gene name | ATP synthase inhibitory factor subunit 1 | |
| Gene Alias | ATPI | |
| Cytomap | 1p35.3 | |
| Gene Type | protein-coding | GO ID | GO:0000422 | UniProtAcc | Q9UII2 |
Top |
Malignant transformation analysis |
| Identification of the aberrant gene expression in precancerous and cancerous lesions by comparing the gene expression of stem-like cells in diseased tissues with normal stem cells |
| Entrez ID | Symbol | Replicates | Species | Organ | Tissue | Adj P-value | Log2FC | Malignancy |
| 93974 | ATP5IF1 | GSM4909281 | Human | Breast | IDC | 3.19e-19 | 5.79e-01 | 0.21 |
| 93974 | ATP5IF1 | GSM4909282 | Human | Breast | IDC | 3.24e-49 | 8.97e-01 | -0.0288 |
| 93974 | ATP5IF1 | GSM4909285 | Human | Breast | IDC | 1.69e-21 | 5.83e-01 | 0.21 |
| 93974 | ATP5IF1 | GSM4909286 | Human | Breast | IDC | 9.30e-08 | 2.33e-02 | 0.1081 |
| 93974 | ATP5IF1 | GSM4909287 | Human | Breast | IDC | 1.71e-10 | 4.68e-01 | 0.2057 |
| 93974 | ATP5IF1 | GSM4909289 | Human | Breast | IDC | 6.70e-07 | 6.48e-01 | 0.1064 |
| 93974 | ATP5IF1 | GSM4909290 | Human | Breast | IDC | 1.32e-26 | 7.32e-01 | 0.2096 |
| 93974 | ATP5IF1 | GSM4909292 | Human | Breast | IDC | 2.66e-02 | 5.71e-01 | 0.1236 |
| 93974 | ATP5IF1 | GSM4909293 | Human | Breast | IDC | 8.25e-11 | 3.51e-01 | 0.1581 |
| 93974 | ATP5IF1 | GSM4909294 | Human | Breast | IDC | 6.68e-18 | 6.23e-01 | 0.2022 |
| 93974 | ATP5IF1 | GSM4909296 | Human | Breast | IDC | 6.28e-38 | 8.52e-01 | 0.1524 |
| 93974 | ATP5IF1 | GSM4909297 | Human | Breast | IDC | 4.53e-10 | 2.99e-01 | 0.1517 |
| 93974 | ATP5IF1 | GSM4909298 | Human | Breast | IDC | 9.42e-09 | 3.36e-01 | 0.1551 |
| 93974 | ATP5IF1 | GSM4909299 | Human | Breast | IDC | 1.06e-05 | 4.00e-01 | 0.035 |
| 93974 | ATP5IF1 | GSM4909301 | Human | Breast | IDC | 3.92e-04 | 3.79e-01 | 0.1577 |
| 93974 | ATP5IF1 | GSM4909302 | Human | Breast | IDC | 3.84e-13 | 4.95e-01 | 0.1545 |
| 93974 | ATP5IF1 | GSM4909303 | Human | Breast | IDC | 2.10e-03 | 4.68e-01 | 0.0438 |
| 93974 | ATP5IF1 | GSM4909304 | Human | Breast | IDC | 1.75e-37 | 7.55e-01 | 0.1636 |
| 93974 | ATP5IF1 | GSM4909305 | Human | Breast | IDC | 1.96e-12 | 4.67e-01 | 0.0436 |
| 93974 | ATP5IF1 | GSM4909306 | Human | Breast | IDC | 2.25e-12 | 5.06e-01 | 0.1564 |
| Page: 1 2 3 4 5 6 7 8 9 10 11 12 |
| Tissue | Expression Dynamics | Abbreviation |
| Breast | 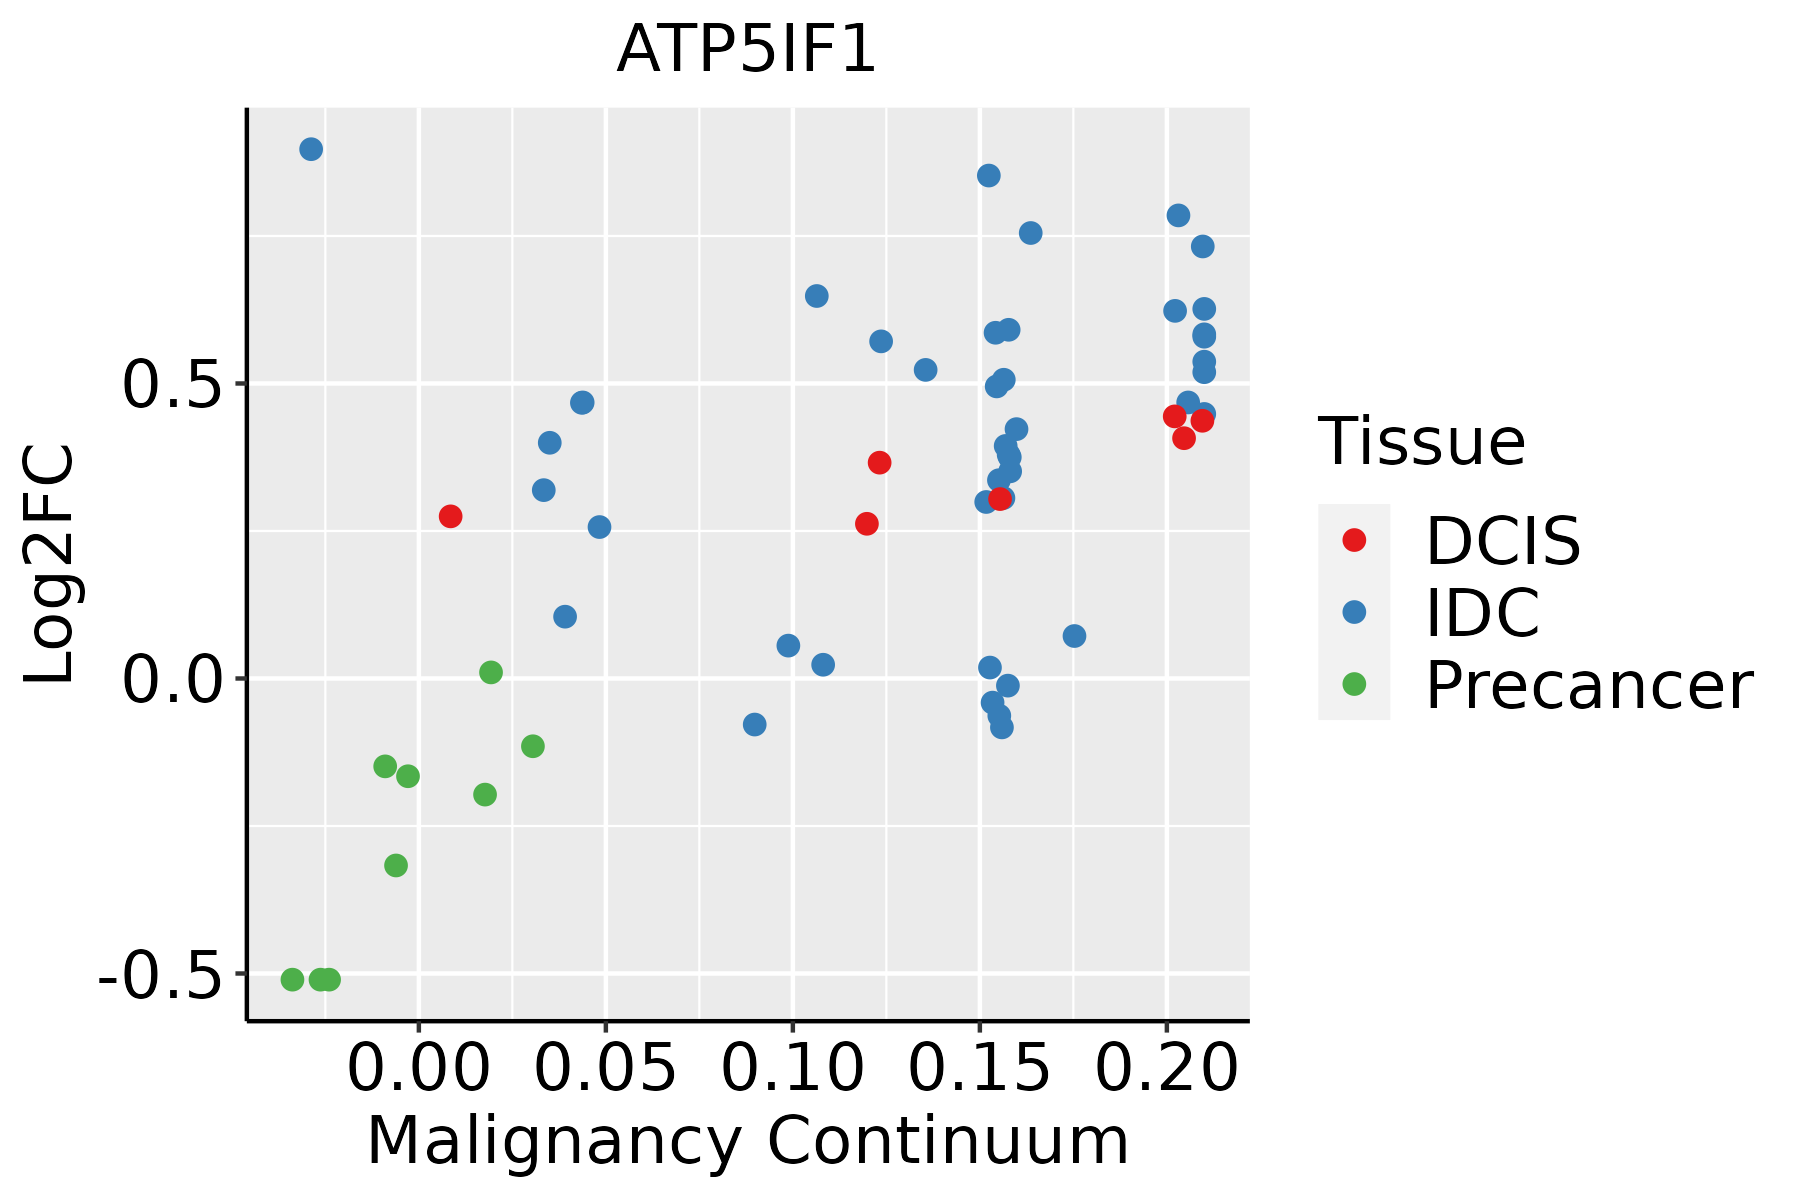 | IDC: Invasive ductal carcinoma |
| DCIS: Ductal carcinoma in situ | ||
| Precancer(BRCA1-mut): Precancerous lesion from BRCA1 mutation carriers | ||
| Cervix | 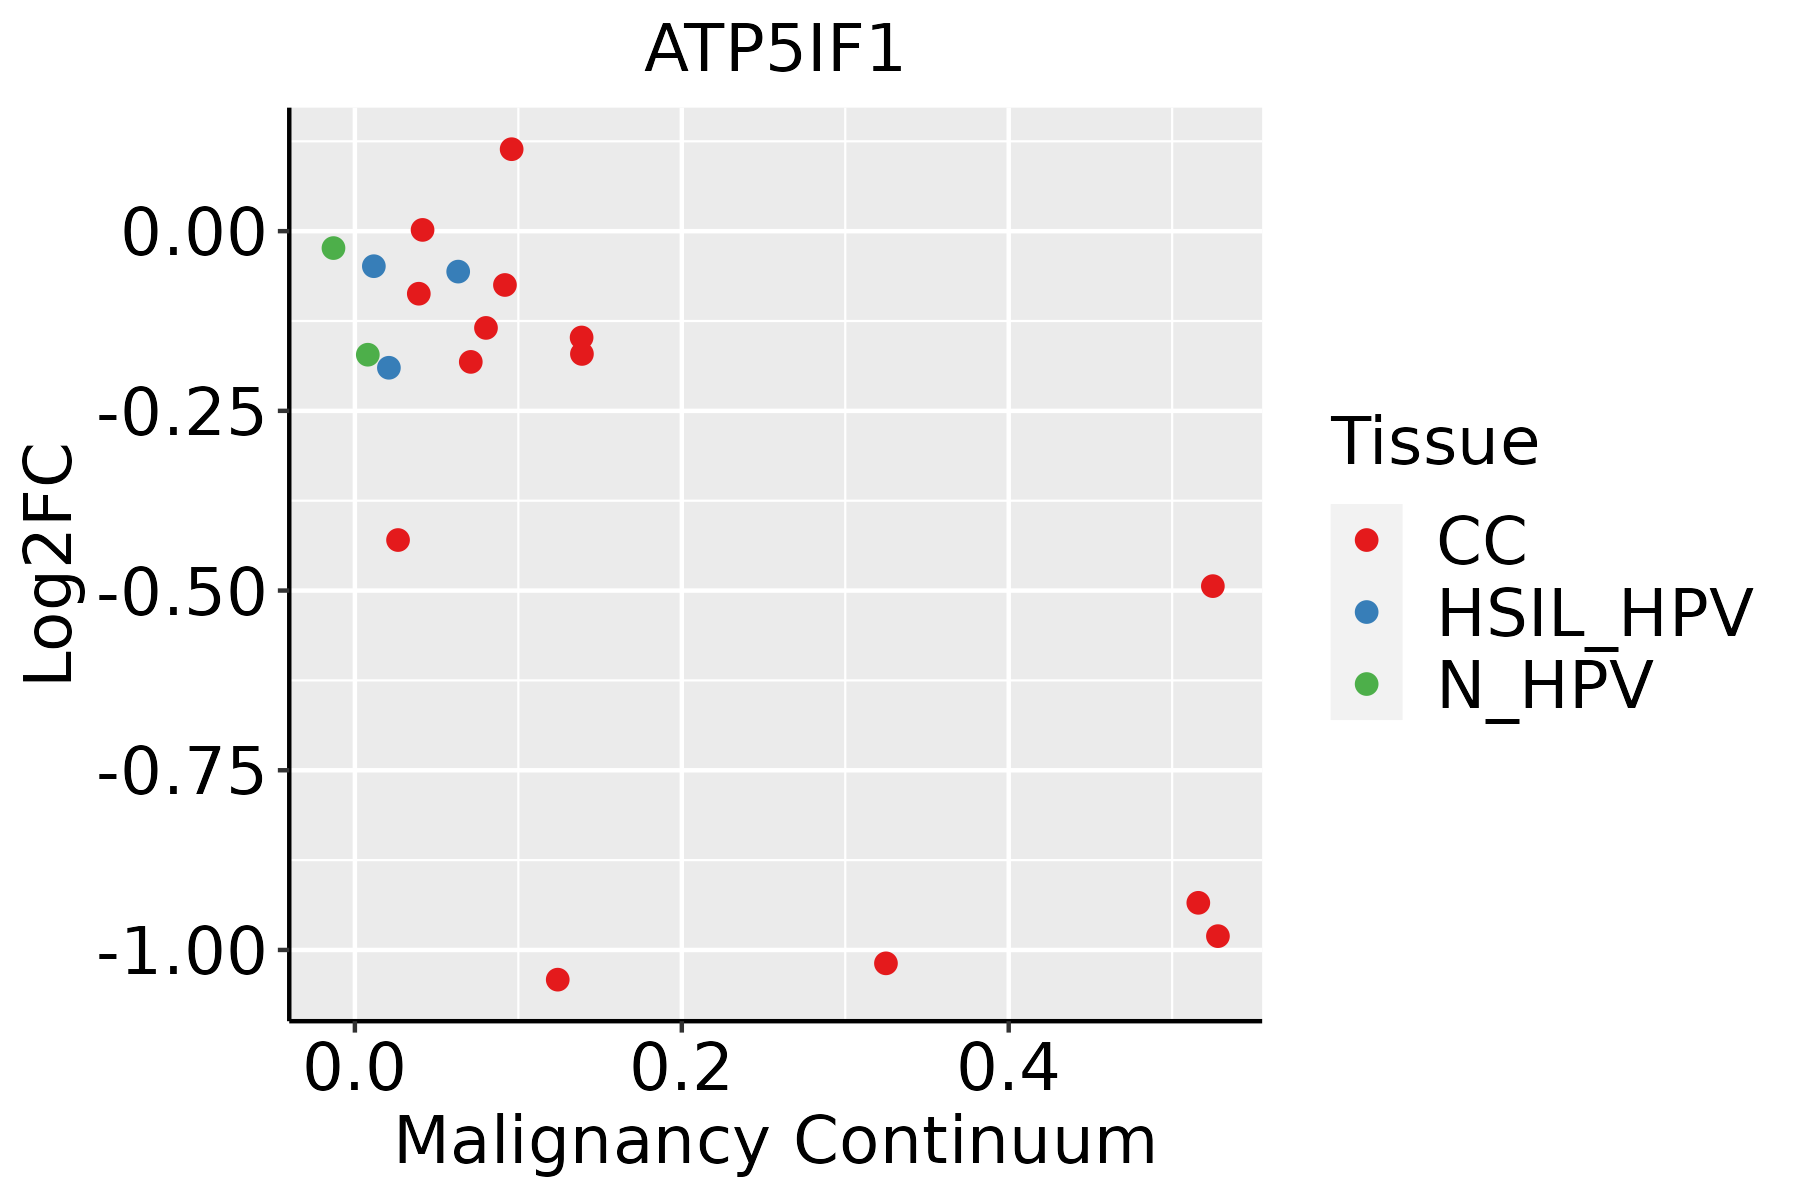 | CC: Cervix cancer |
| HSIL_HPV: HPV-infected high-grade squamous intraepithelial lesions | ||
| N_HPV: HPV-infected normal cervix | ||
| Colorectum (GSE201348) |  | FAP: Familial adenomatous polyposis |
| CRC: Colorectal cancer | ||
| Colorectum (HTA11) |  | AD: Adenomas |
| SER: Sessile serrated lesions | ||
| MSI-H: Microsatellite-high colorectal cancer | ||
| MSS: Microsatellite stable colorectal cancer | ||
| Endometrium |  | AEH: Atypical endometrial hyperplasia |
| EEC: Endometrioid Cancer | ||
| Esophagus | 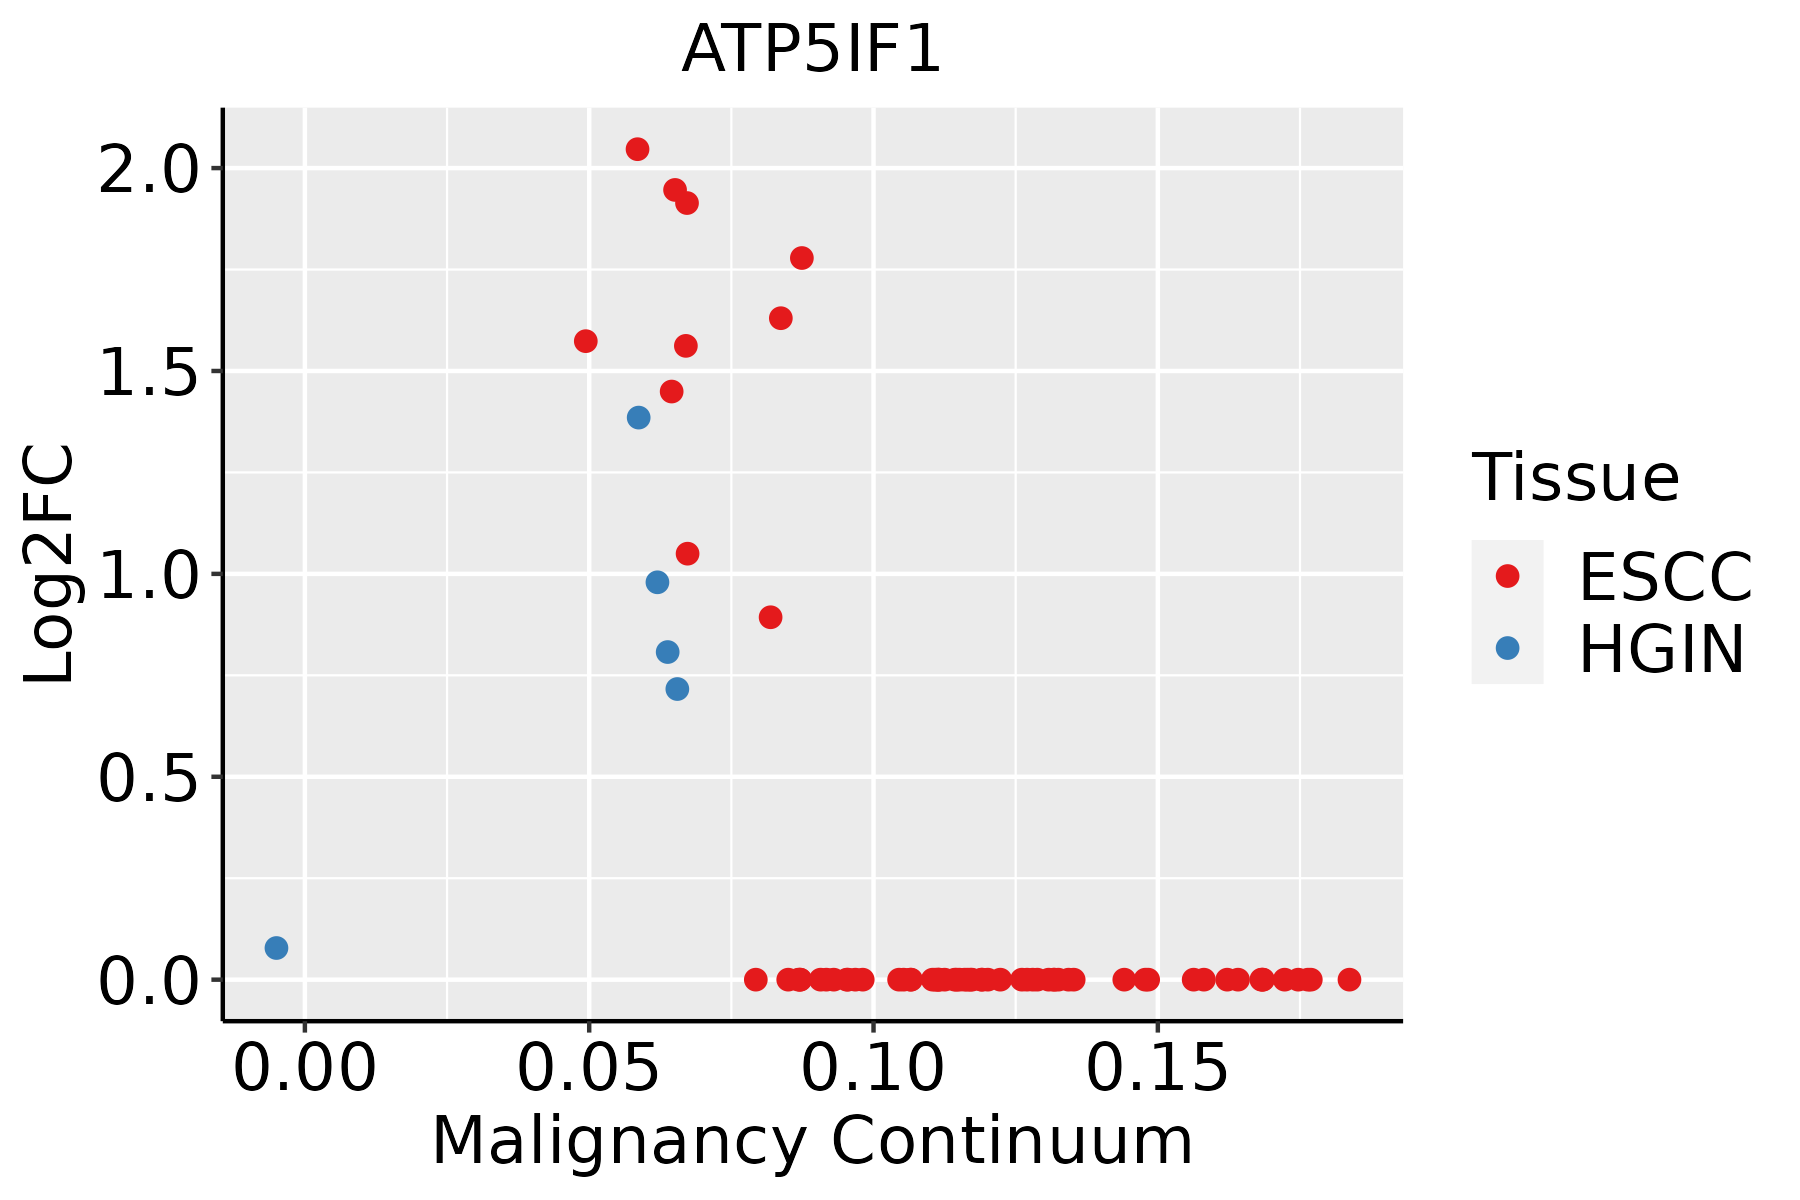 | ESCC: Esophageal squamous cell carcinoma |
| HGIN: High-grade intraepithelial neoplasias | ||
| LGIN: Low-grade intraepithelial neoplasias | ||
| GC |  | CAG: Chronic atrophic gastritis |
| CAG with IM: Chronic atrophic gastritis with intestinal metaplasia | ||
| CSG: Chronic superficial gastritis | ||
| GC: Gastric cancer | ||
| SIM: Severe intestinal metaplasia | ||
| WIM: Wild intestinal metaplasia | ||
| Liver | 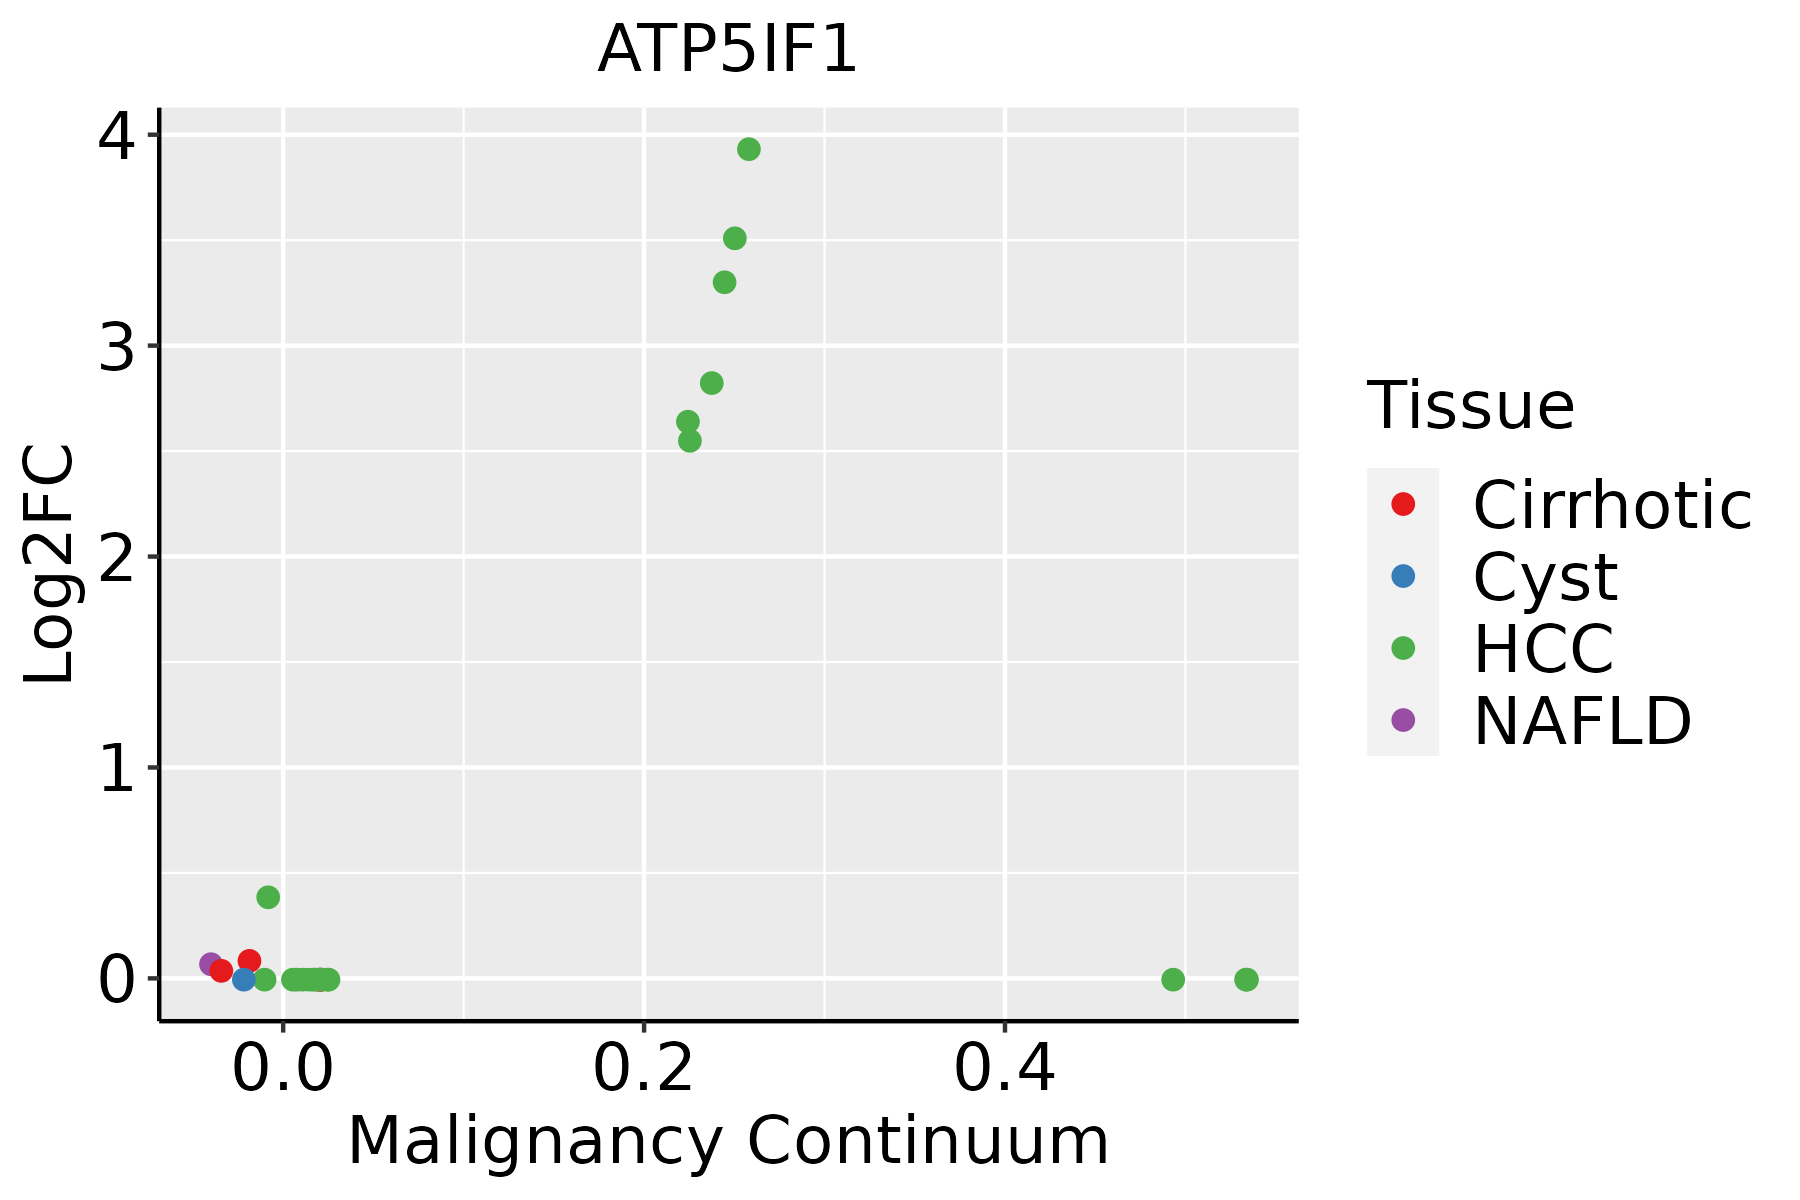 | HCC: Hepatocellular carcinoma |
| NAFLD: Non-alcoholic fatty liver disease | ||
| Lung | 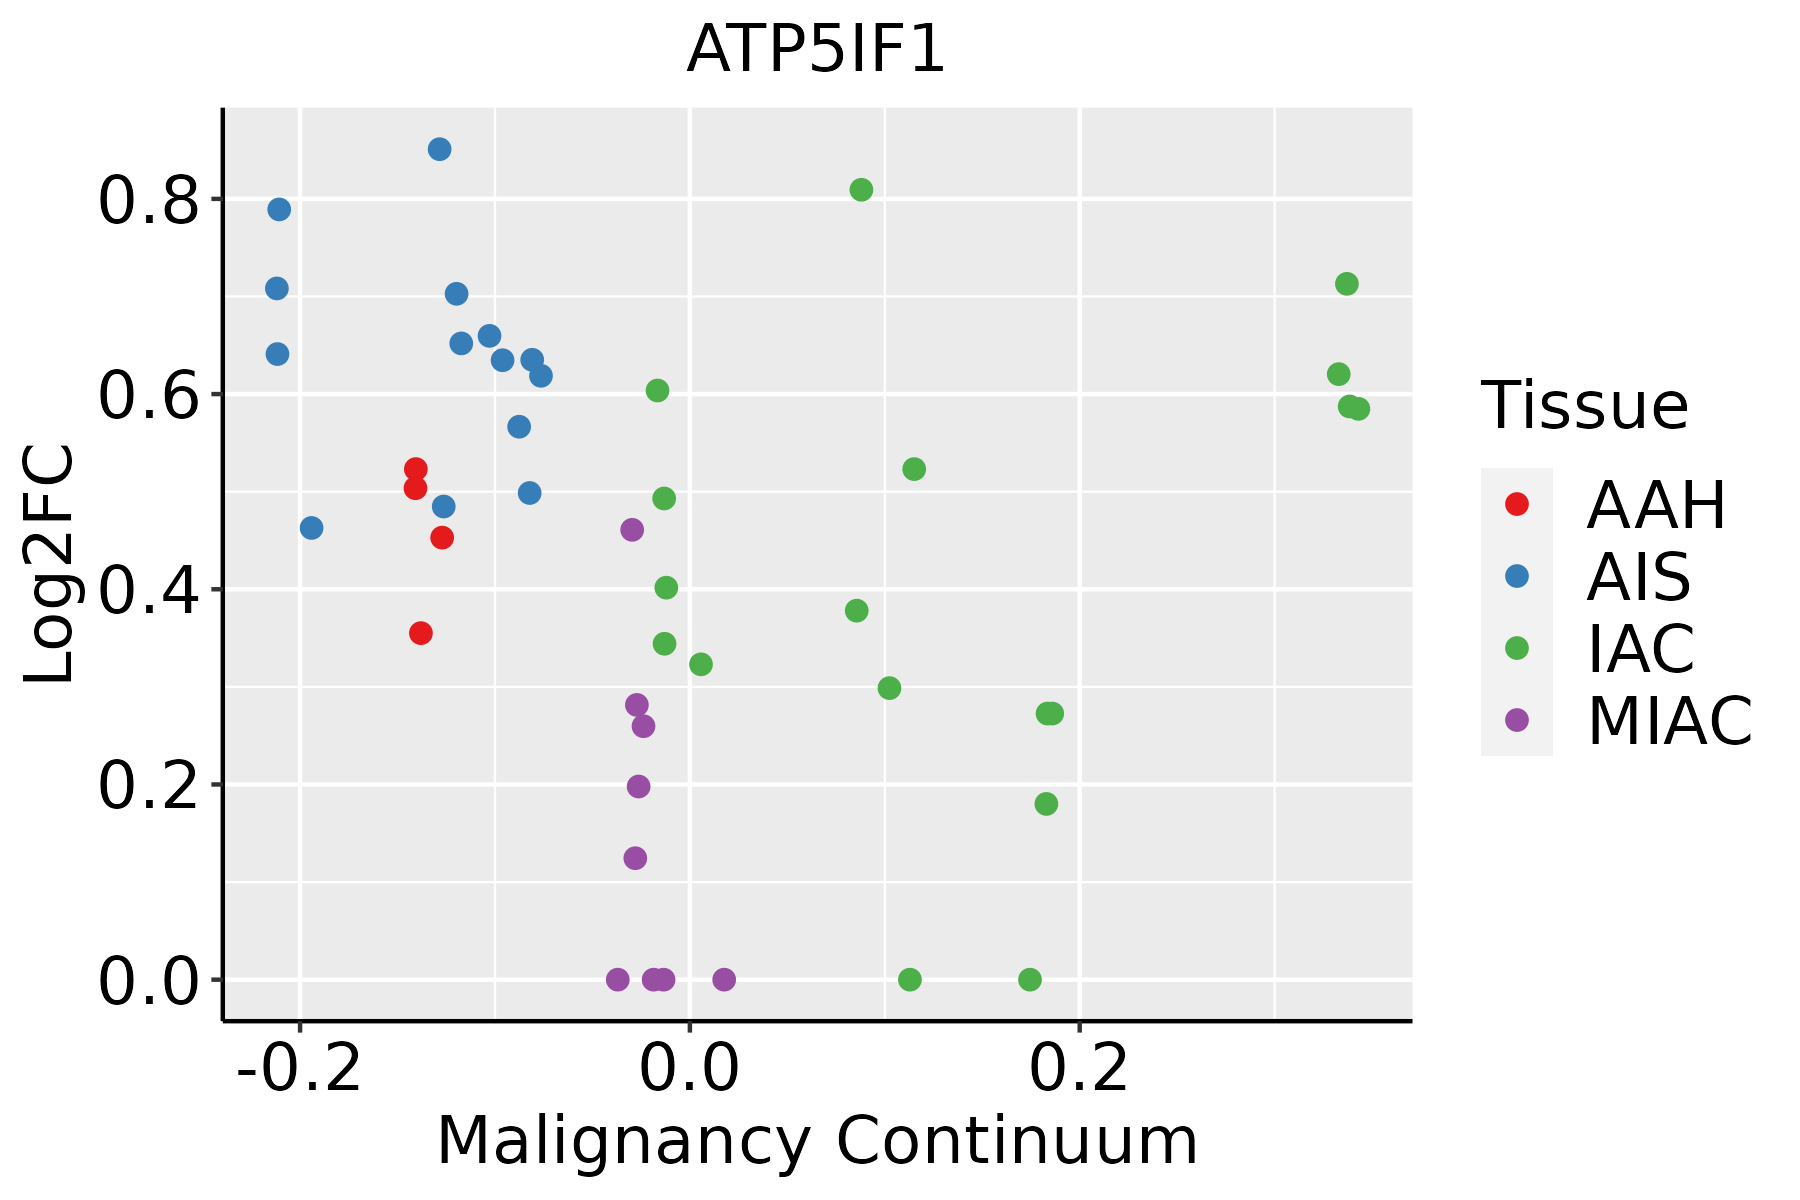 | AAH: Atypical adenomatous hyperplasia |
| AIS: Adenocarcinoma in situ | ||
| IAC: Invasive lung adenocarcinoma | ||
| MIA: Minimally invasive adenocarcinoma | ||
| Prostate |  | BPH: Benign Prostatic Hyperplasia |
| Skin | 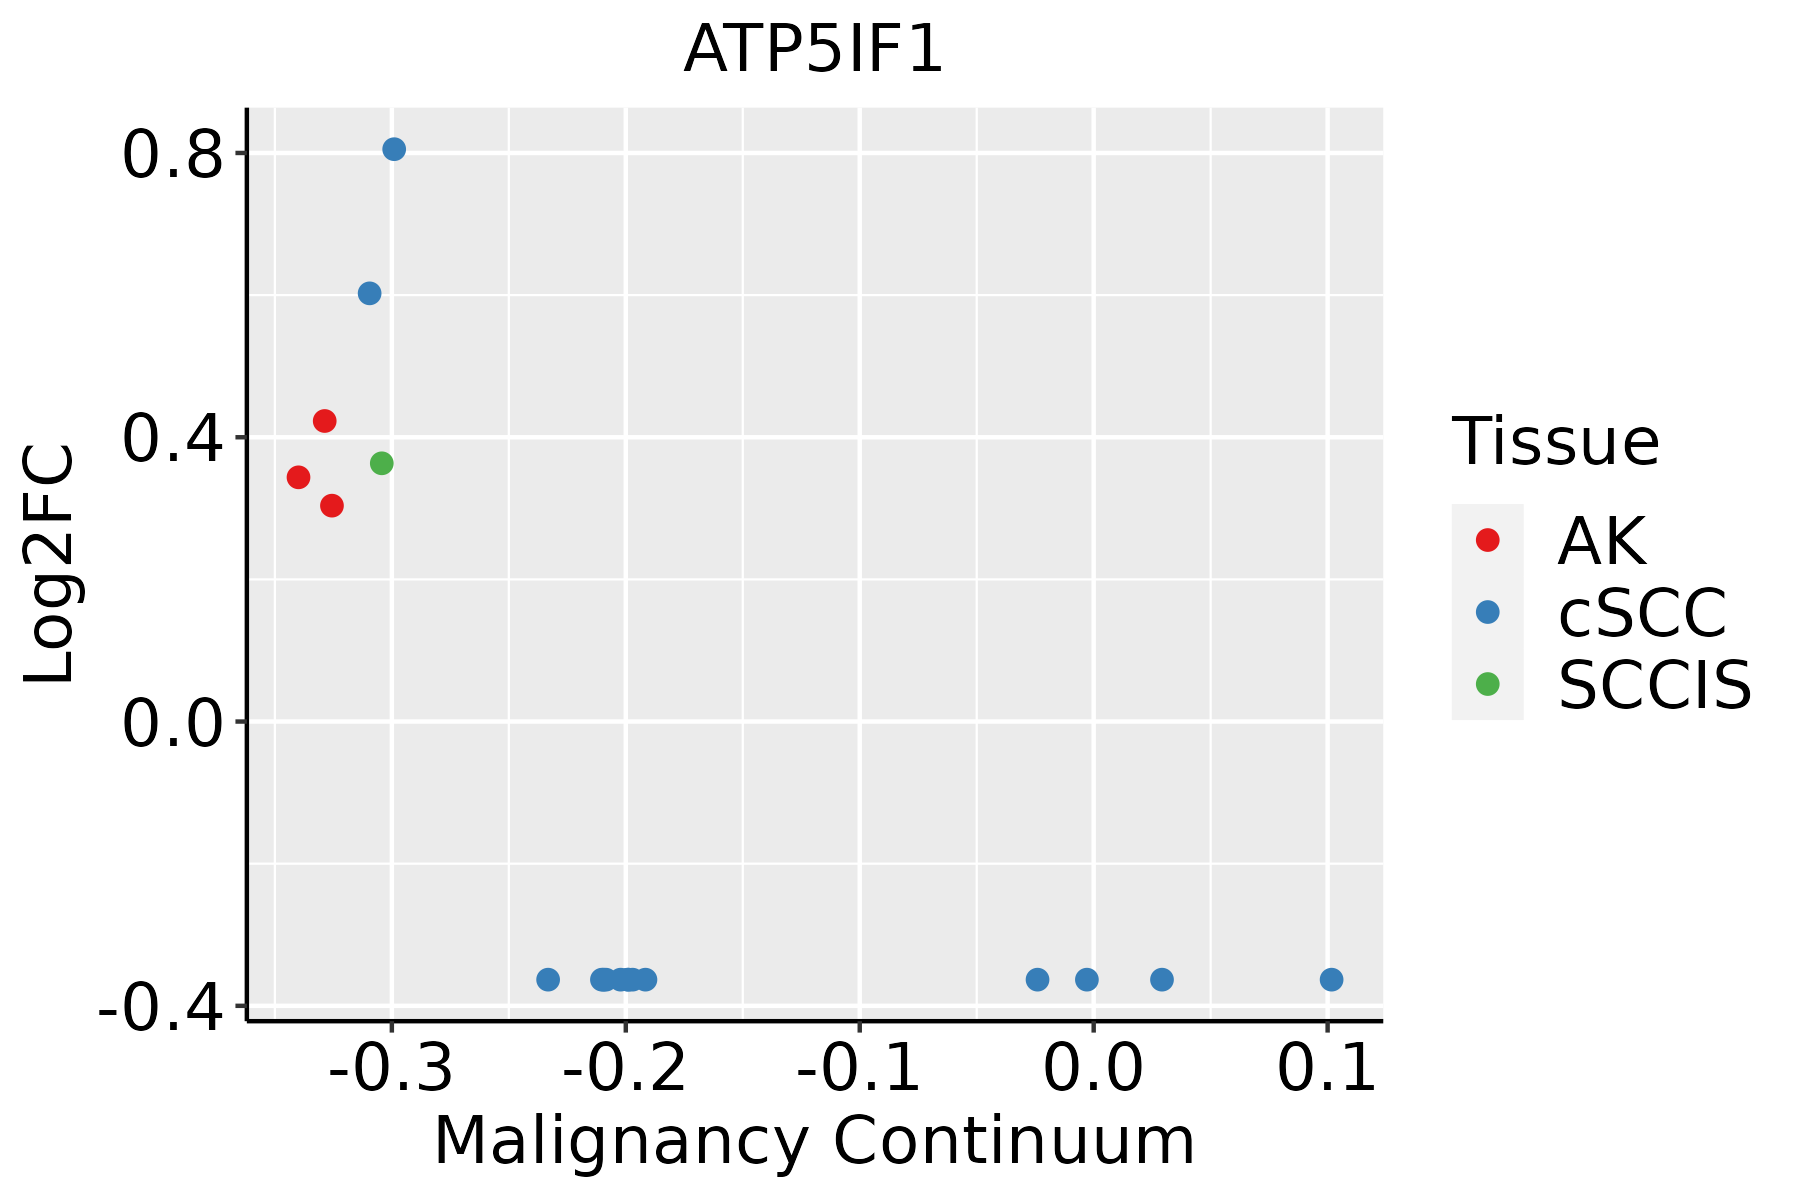 | AK: Actinic keratosis |
| cSCC: Cutaneous squamous cell carcinoma | ||
| SCCIS:squamous cell carcinoma in situ | ||
| Thyroid | 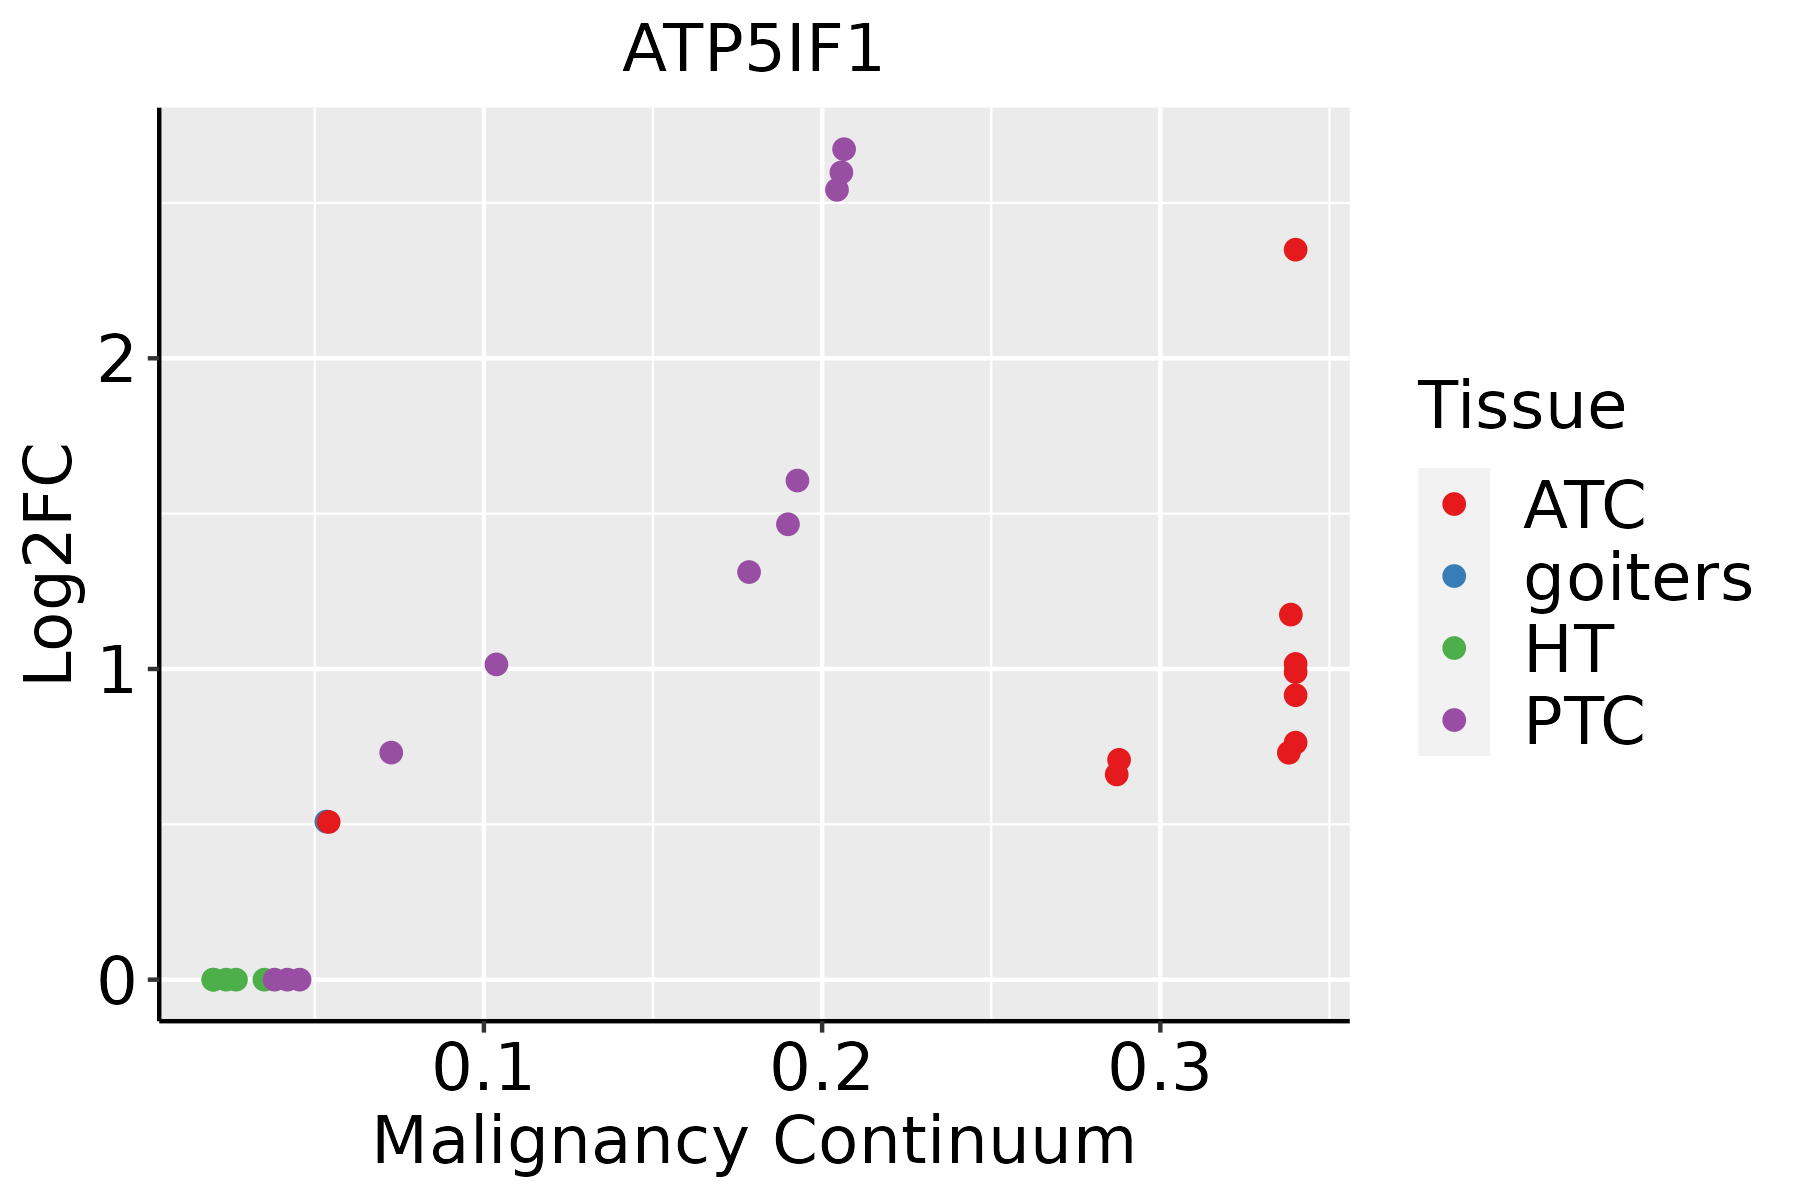 | ATC: Anaplastic thyroid cancer |
| HT: Hashimoto's thyroiditis | ||
| PTC: Papillary thyroid cancer |
| ∗log2FC in expression of this searched gene in stem-like cells from each diseased tissue sample relative to stem-like cells in normal samples in each tissue plotted against the malignancy continuum. Samples are colored based on if they are from different disease stage. |
Top |
Malignant transformation related pathway analysis |
| Find out the enriched GO biological processes and KEGG pathways involved in transition from healthy to precancer to cancer |
| Tissue | Disease Stage | Enriched GO biological Processes |
| Colorectum | AD |  |
| Colorectum | SER |  |
| Colorectum | MSS |  |
| Colorectum | MSI-H |  |
| Colorectum | FAP |  |
| ∗Top 15 enriched GO BP terms are showed in the bar plot of each disease state in each tissue. Each row represents a significant GO biological process which is colored according to the -log10(p.adjust). |
| Page: 1 2 3 4 5 6 7 8 9 |
| GO ID | Tissue | Disease Stage | Description | Gene Ratio | Bg Ratio | pvalue | p.adjust | Count |
| GO:004586232 | Lung | MIAC | positive regulation of proteolysis | 34/967 | 372/18723 | 9.33e-04 | 1.98e-02 | 34 |
| GO:00987801 | Lung | MIAC | response to mitochondrial depolarisation | 5/967 | 19/18723 | 2.30e-03 | 3.46e-02 | 5 |
| GO:19049251 | Lung | MIAC | positive regulation of autophagy of mitochondrion in response to mitochondrial depolarization | 4/967 | 13/18723 | 3.47e-03 | 4.43e-02 | 4 |
| GO:004603418 | Prostate | BPH | ATP metabolic process | 120/3107 | 277/18723 | 4.78e-26 | 1.48e-22 | 120 |
| GO:004217618 | Prostate | BPH | regulation of protein catabolic process | 139/3107 | 391/18723 | 3.71e-20 | 3.28e-17 | 139 |
| GO:000609116 | Prostate | BPH | generation of precursor metabolites and energy | 161/3107 | 490/18723 | 3.05e-19 | 1.45e-16 | 161 |
| GO:007259416 | Prostate | BPH | establishment of protein localization to organelle | 142/3107 | 422/18723 | 4.01e-18 | 1.31e-15 | 142 |
| GO:000989618 | Prostate | BPH | positive regulation of catabolic process | 156/3107 | 492/18723 | 4.50e-17 | 1.11e-14 | 156 |
| GO:003133118 | Prostate | BPH | positive regulation of cellular catabolic process | 135/3107 | 427/18723 | 7.82e-15 | 1.05e-12 | 135 |
| GO:190336218 | Prostate | BPH | regulation of cellular protein catabolic process | 93/3107 | 255/18723 | 1.06e-14 | 1.40e-12 | 93 |
| GO:004586218 | Prostate | BPH | positive regulation of proteolysis | 121/3107 | 372/18723 | 2.05e-14 | 2.44e-12 | 121 |
| GO:190305018 | Prostate | BPH | regulation of proteolysis involved in cellular protein catabolic process | 80/3107 | 221/18723 | 1.20e-12 | 1.02e-10 | 80 |
| GO:004573218 | Prostate | BPH | positive regulation of protein catabolic process | 82/3107 | 231/18723 | 2.08e-12 | 1.72e-10 | 82 |
| GO:000660518 | Prostate | BPH | protein targeting | 102/3107 | 314/18723 | 2.51e-12 | 2.05e-10 | 102 |
| GO:003238610 | Prostate | BPH | regulation of intracellular transport | 106/3107 | 337/18723 | 8.77e-12 | 6.70e-10 | 106 |
| GO:003009918 | Prostate | BPH | myeloid cell differentiation | 115/3107 | 381/18723 | 2.22e-11 | 1.51e-09 | 115 |
| GO:003315716 | Prostate | BPH | regulation of intracellular protein transport | 76/3107 | 229/18723 | 5.05e-10 | 2.56e-08 | 76 |
| GO:190336418 | Prostate | BPH | positive regulation of cellular protein catabolic process | 57/3107 | 155/18723 | 1.01e-09 | 4.59e-08 | 57 |
| GO:002241117 | Prostate | BPH | cellular component disassembly | 121/3107 | 443/18723 | 6.34e-09 | 2.25e-07 | 121 |
| GO:000683916 | Prostate | BPH | mitochondrial transport | 79/3107 | 254/18723 | 6.77e-09 | 2.38e-07 | 79 |
| Page: 1 2 3 4 5 6 7 8 9 10 11 12 13 14 15 16 17 18 19 20 21 22 23 24 25 26 27 28 29 30 31 32 33 34 35 36 37 38 39 40 41 42 43 44 45 46 47 48 49 50 51 52 53 54 55 |
| Pathway ID | Tissue | Disease Stage | Description | Gene Ratio | Bg Ratio | pvalue | p.adjust | qvalue | Count |
| Page: 1 |
Top |
Cell-cell communication analysis |
| Identification of potential cell-cell interactions between two cell types and their ligand-receptor pairs for different disease states |
| Ligand | Receptor | LRpair | Pathway | Tissue | Disease Stage |
| Page: 1 |
Top |
Single-cell gene regulatory network inference analysis |
| Find out the significant the regulons (TFs) and the target genes of each regulon across cell types for different disease states |
| TF | Cell Type | Tissue | Disease Stage | Target Gene | RSS | Regulon Activity |
| ∗The dot plots of a searched regulon are shown for all cell subpopulations in each disease state of each tissue based on the regulon specific score inferred using pySCENIC and by calculating the average expression. |
| Page: 1 |
Top |
Somatic mutation of malignant transformation related genes |
| Annotation of somatic variants for genes involved in malignant transformation |
| Hugo Symbol | Variant Class | Variant Classification | dbSNP RS | HGVSc | HGVSp | HGVSp Short | SWISSPROT | BIOTYPE | SIFT | PolyPhen | Tumor Sample Barcode | Tissue | Histology | Sex | Age | Stage | Therapy Types | Drugs | Outcome |
| Page: 1 |
Top |
Related drugs of malignant transformation related genes |
| Identification of chemicals and drugs interact with genes involved in malignant transfromation |
| (DGIdb 4.0) |
| Entrez ID | Symbol | Category | Interaction Types | Drug Claim Name | Drug Name | PMIDs |
| Page: 1 |

Copyright 2023-Present -The University of Texas Health Science Center at Houston |