
|
|||||
|
 | |
| |
| |
| |
| |
| |
|
Gene: ARFGEF1 |
Gene summary for ARFGEF1 |
| Gene information | Species | Human | Gene symbol | ARFGEF1 | Gene ID | 10565 |
| Gene name | ADP ribosylation factor guanine nucleotide exchange factor 1 | |
| Gene Alias | ARFGEP1 | |
| Cytomap | 8q13.2 | |
| Gene Type | protein-coding | GO ID | GO:0006464 | UniProtAcc | A0A024R7X0 |
Top |
Malignant transformation analysis |
| Identification of the aberrant gene expression in precancerous and cancerous lesions by comparing the gene expression of stem-like cells in diseased tissues with normal stem cells |
| Entrez ID | Symbol | Replicates | Species | Organ | Tissue | Adj P-value | Log2FC | Malignancy |
| 10565 | ARFGEF1 | CCI_1 | Human | Cervix | CC | 1.77e-04 | 7.29e-01 | 0.528 |
| 10565 | ARFGEF1 | CCI_2 | Human | Cervix | CC | 2.50e-10 | 1.18e+00 | 0.5249 |
| 10565 | ARFGEF1 | CCI_3 | Human | Cervix | CC | 7.27e-08 | 8.20e-01 | 0.516 |
| 10565 | ARFGEF1 | HTA11_3410_2000001011 | Human | Colorectum | AD | 7.19e-30 | -7.61e-01 | 0.0155 |
| 10565 | ARFGEF1 | HTA11_2487_2000001011 | Human | Colorectum | SER | 2.79e-04 | -4.77e-01 | -0.1808 |
| 10565 | ARFGEF1 | HTA11_2951_2000001011 | Human | Colorectum | AD | 3.03e-03 | -7.50e-01 | 0.0216 |
| 10565 | ARFGEF1 | HTA11_3361_2000001011 | Human | Colorectum | AD | 9.48e-09 | -6.77e-01 | -0.1207 |
| 10565 | ARFGEF1 | HTA11_696_2000001011 | Human | Colorectum | AD | 2.62e-07 | -3.86e-01 | -0.1464 |
| 10565 | ARFGEF1 | HTA11_866_2000001011 | Human | Colorectum | AD | 1.72e-03 | -3.16e-01 | -0.1001 |
| 10565 | ARFGEF1 | HTA11_5216_2000001011 | Human | Colorectum | SER | 3.37e-05 | -8.05e-01 | -0.1462 |
| 10565 | ARFGEF1 | HTA11_866_3004761011 | Human | Colorectum | AD | 8.88e-16 | -6.56e-01 | 0.096 |
| 10565 | ARFGEF1 | HTA11_8622_2000001021 | Human | Colorectum | SER | 6.84e-03 | -6.11e-01 | 0.0528 |
| 10565 | ARFGEF1 | HTA11_10711_2000001011 | Human | Colorectum | AD | 2.37e-07 | -5.04e-01 | 0.0338 |
| 10565 | ARFGEF1 | HTA11_7696_3000711011 | Human | Colorectum | AD | 3.01e-15 | -5.25e-01 | 0.0674 |
| 10565 | ARFGEF1 | HTA11_11156_2000001011 | Human | Colorectum | AD | 1.60e-02 | -8.14e-01 | 0.0397 |
| 10565 | ARFGEF1 | HTA11_6818_2000001021 | Human | Colorectum | AD | 7.72e-06 | -5.38e-01 | 0.0588 |
| 10565 | ARFGEF1 | HTA11_99999970781_79442 | Human | Colorectum | MSS | 2.10e-11 | -4.37e-01 | 0.294 |
| 10565 | ARFGEF1 | HTA11_99999973899_84307 | Human | Colorectum | MSS | 4.87e-11 | -7.90e-01 | 0.2585 |
| 10565 | ARFGEF1 | HTA11_99999974143_84620 | Human | Colorectum | MSS | 4.97e-12 | -4.47e-01 | 0.3005 |
| 10565 | ARFGEF1 | F007 | Human | Colorectum | FAP | 5.06e-04 | -2.40e-01 | 0.1176 |
| Page: 1 2 3 4 5 6 7 8 9 10 11 |
| Tissue | Expression Dynamics | Abbreviation |
| Cervix | 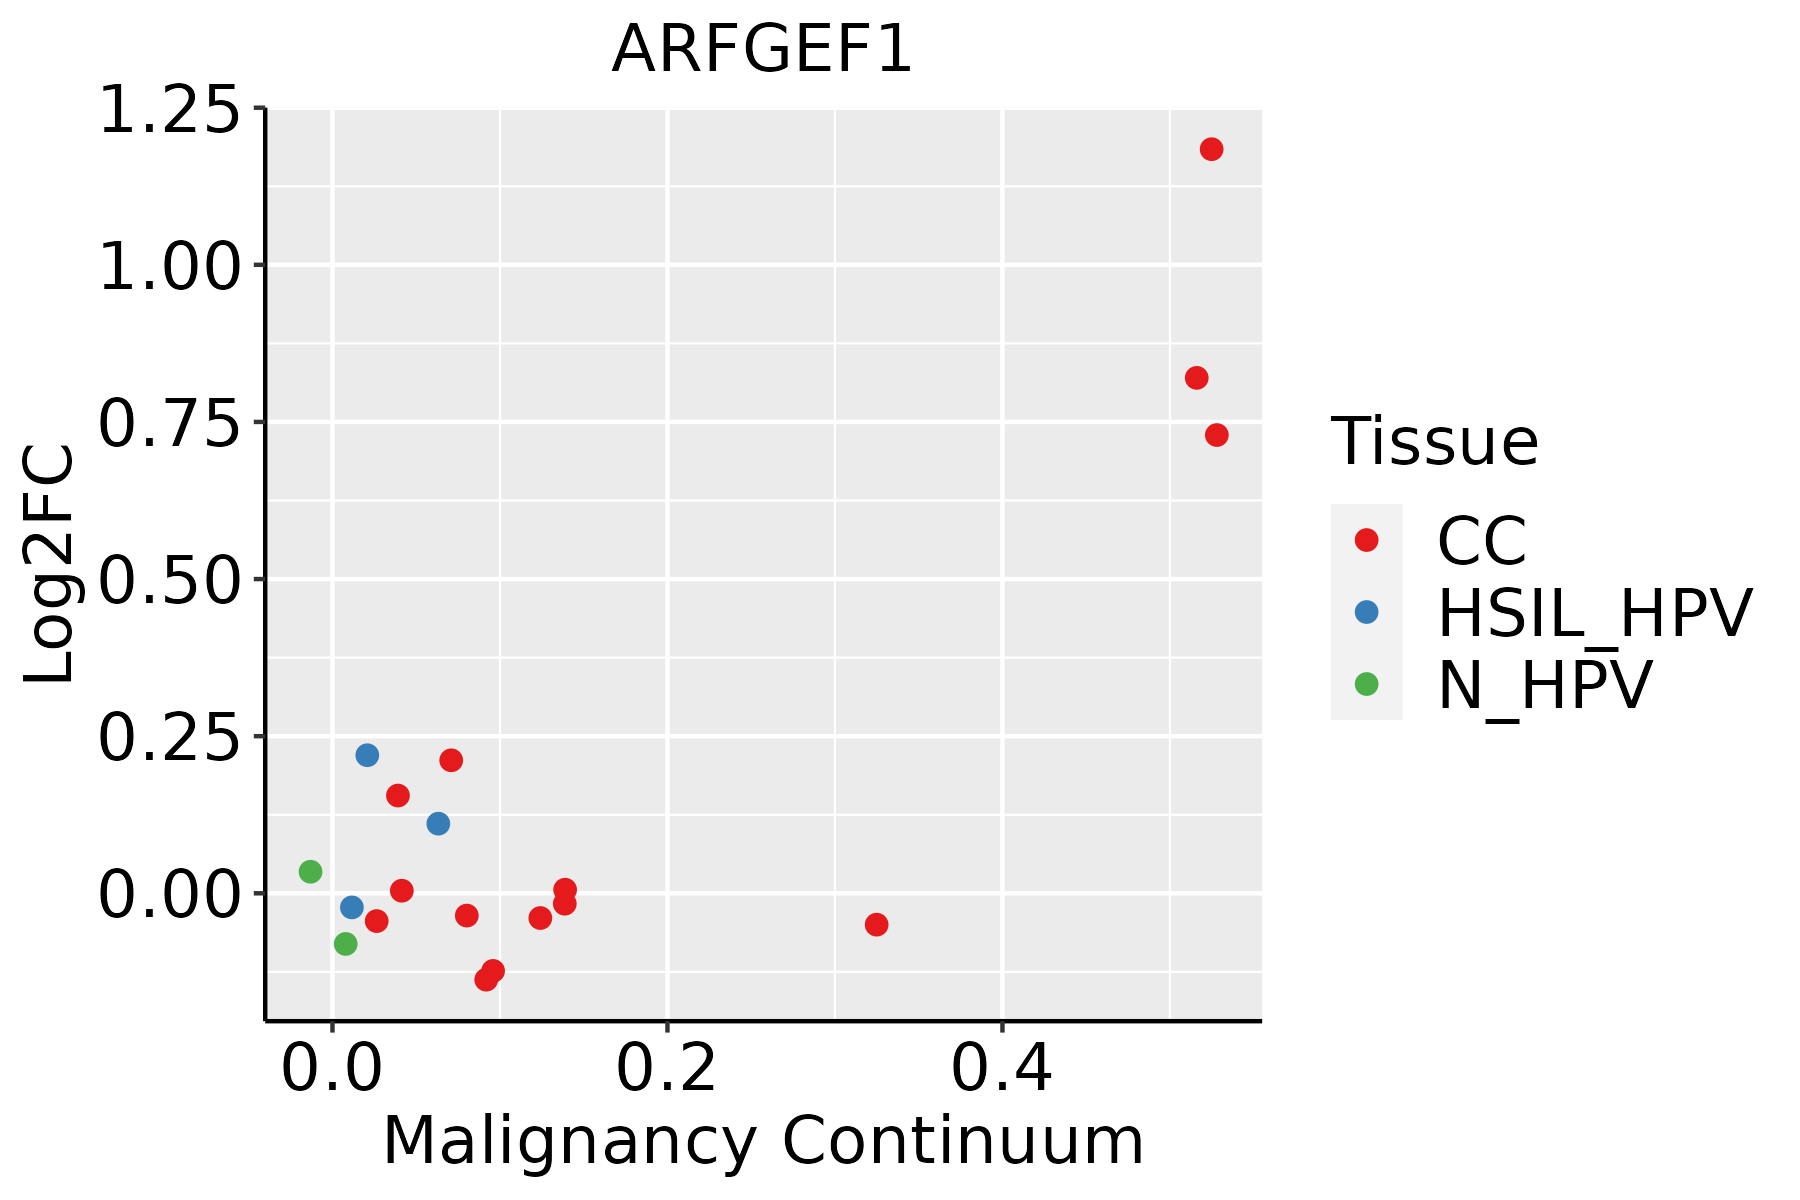 | CC: Cervix cancer |
| HSIL_HPV: HPV-infected high-grade squamous intraepithelial lesions | ||
| N_HPV: HPV-infected normal cervix | ||
| Colorectum (GSE201348) |  | FAP: Familial adenomatous polyposis |
| CRC: Colorectal cancer | ||
| Colorectum (HTA11) |  | AD: Adenomas |
| SER: Sessile serrated lesions | ||
| MSI-H: Microsatellite-high colorectal cancer | ||
| MSS: Microsatellite stable colorectal cancer | ||
| Endometrium | 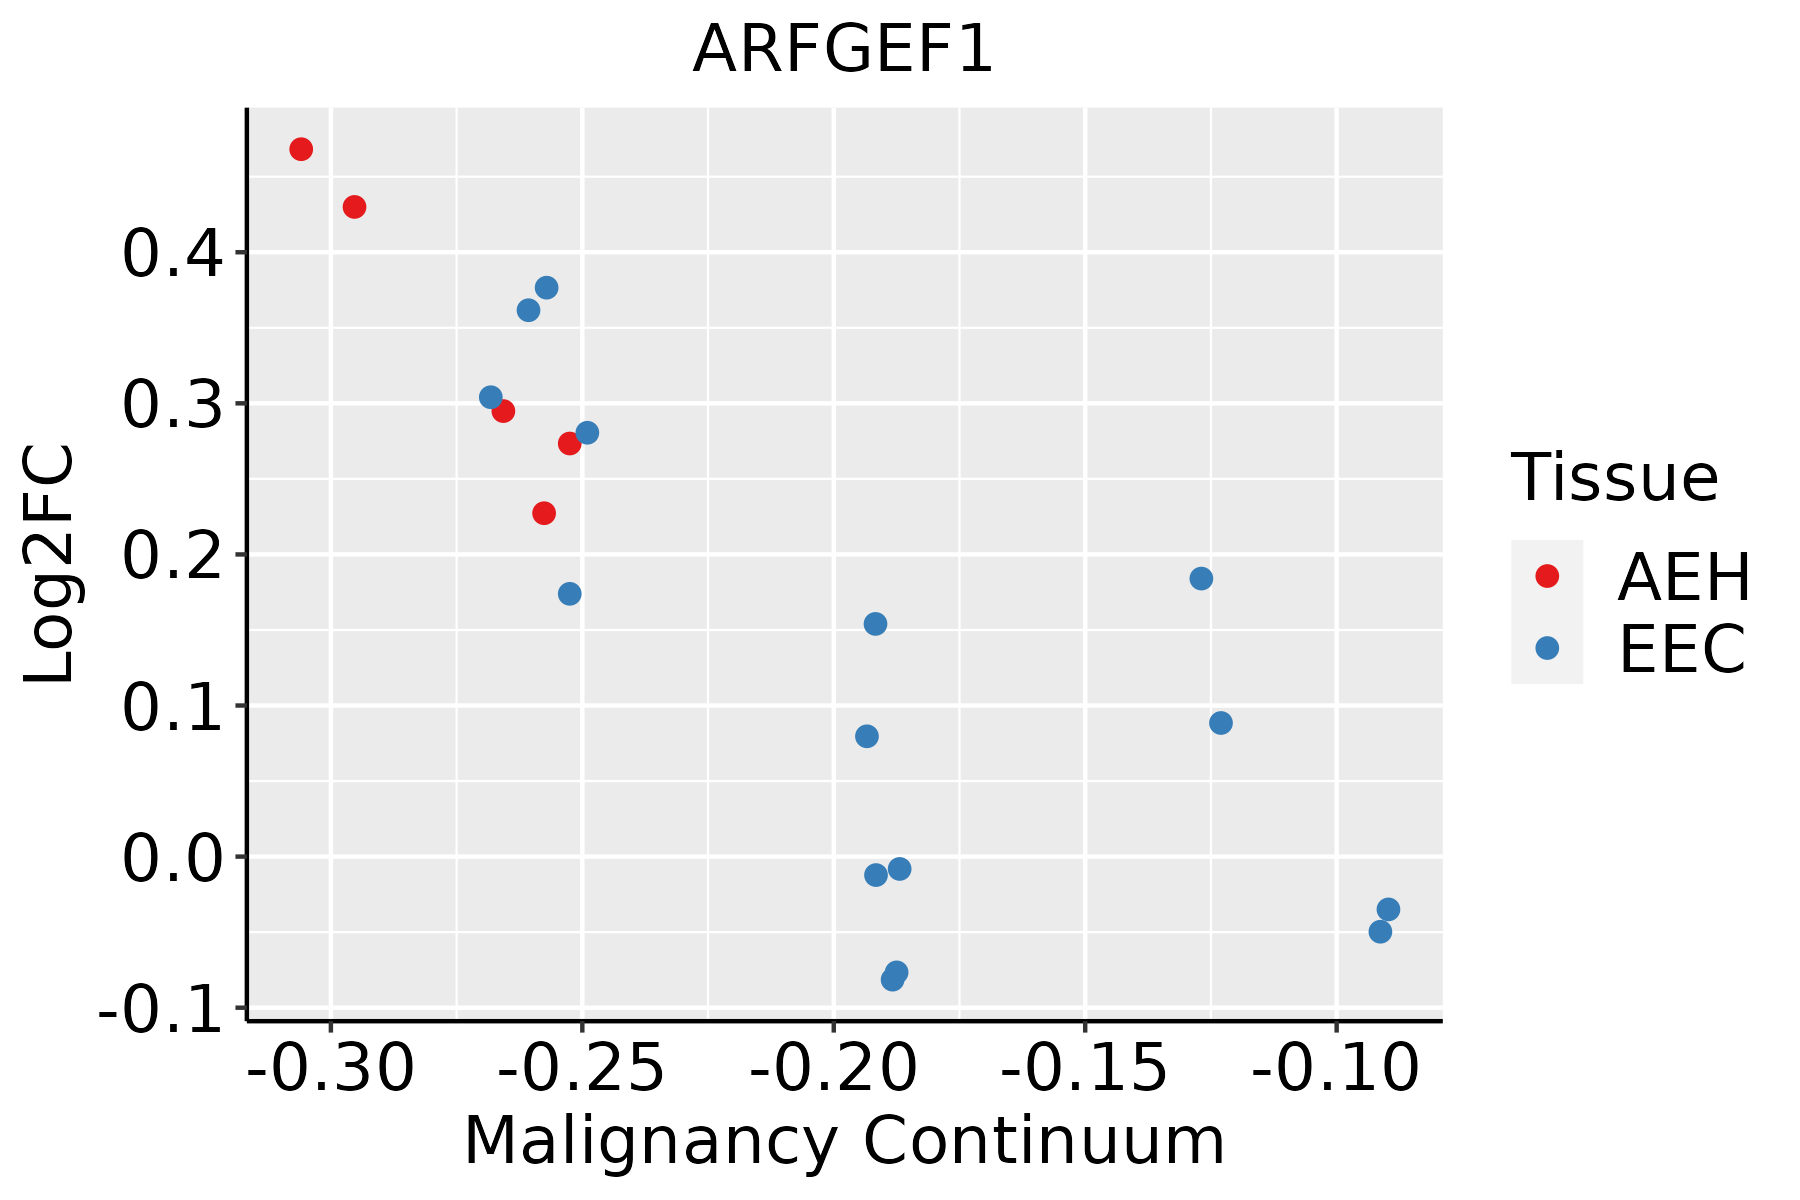 | AEH: Atypical endometrial hyperplasia |
| EEC: Endometrioid Cancer | ||
| Esophagus | 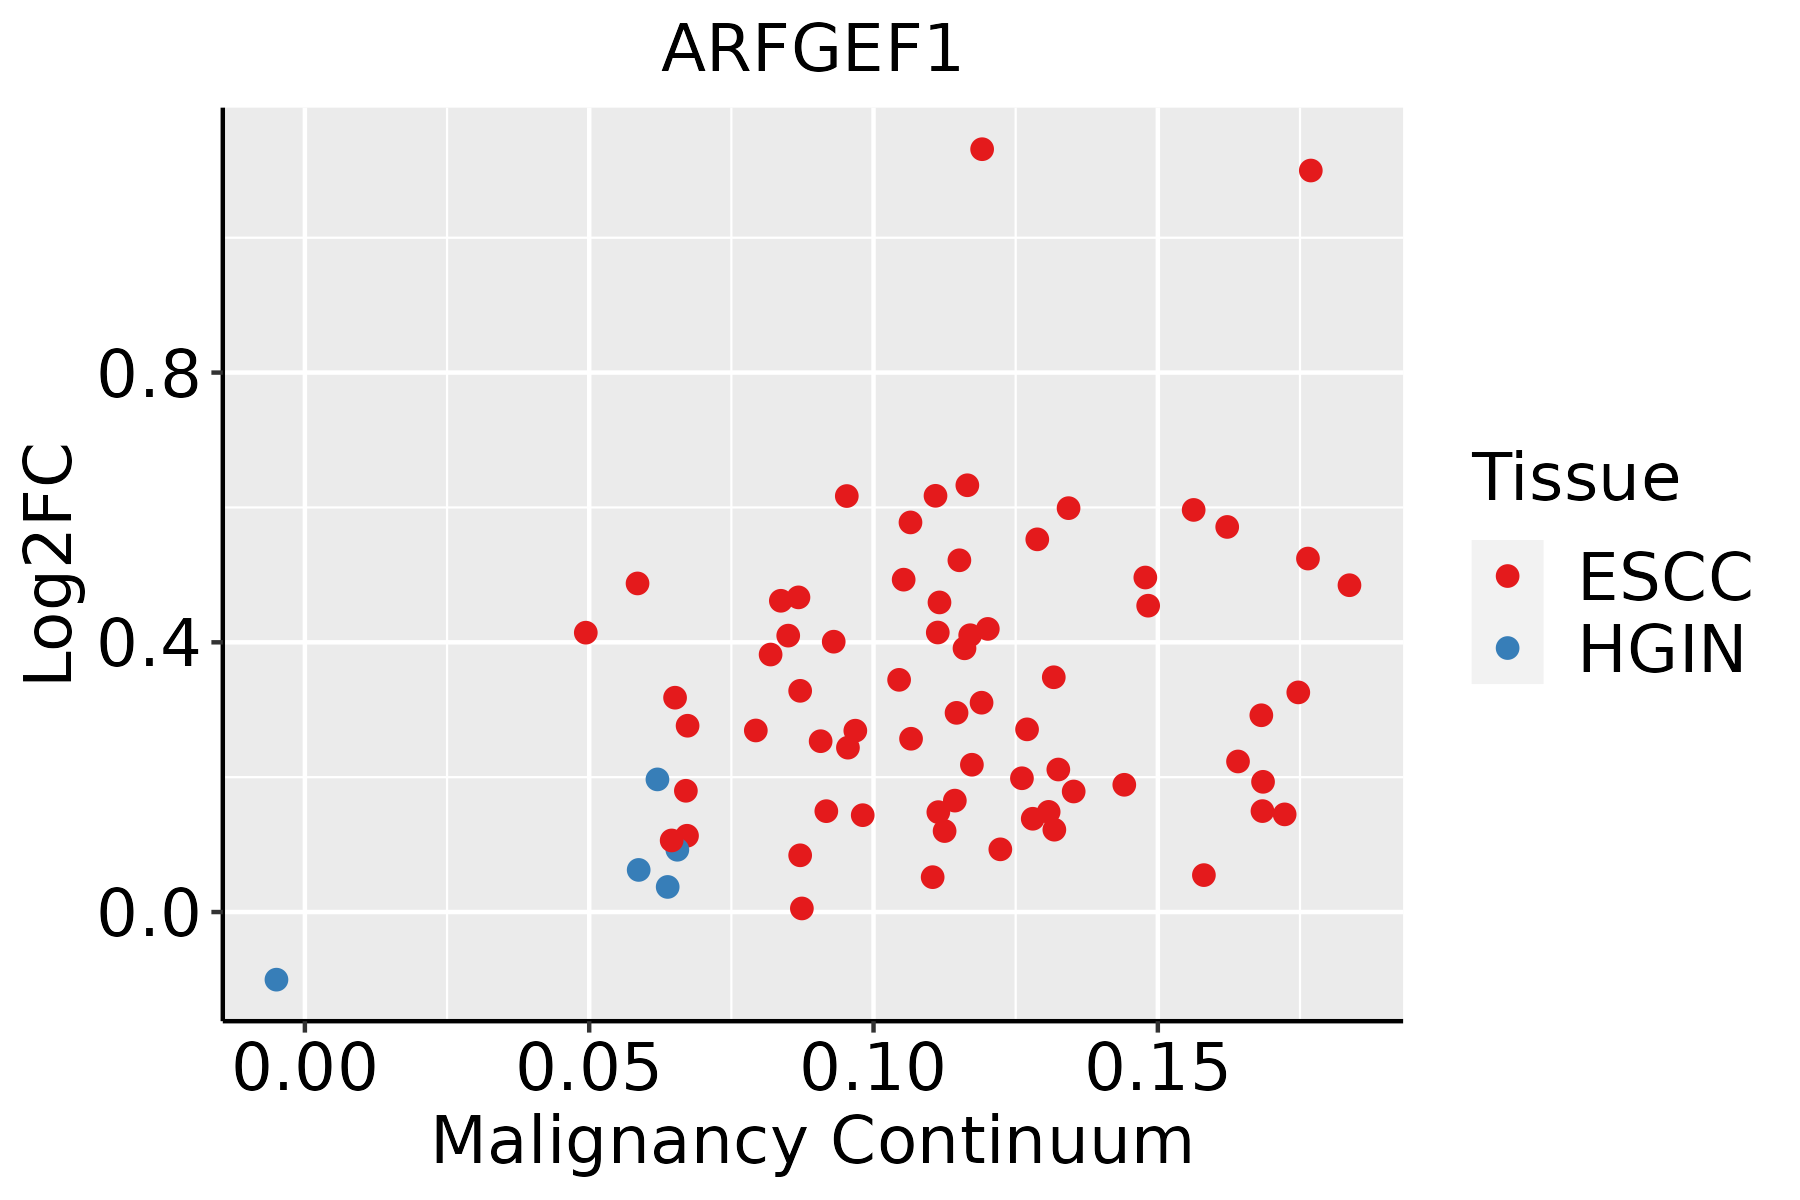 | ESCC: Esophageal squamous cell carcinoma |
| HGIN: High-grade intraepithelial neoplasias | ||
| LGIN: Low-grade intraepithelial neoplasias | ||
| Liver | 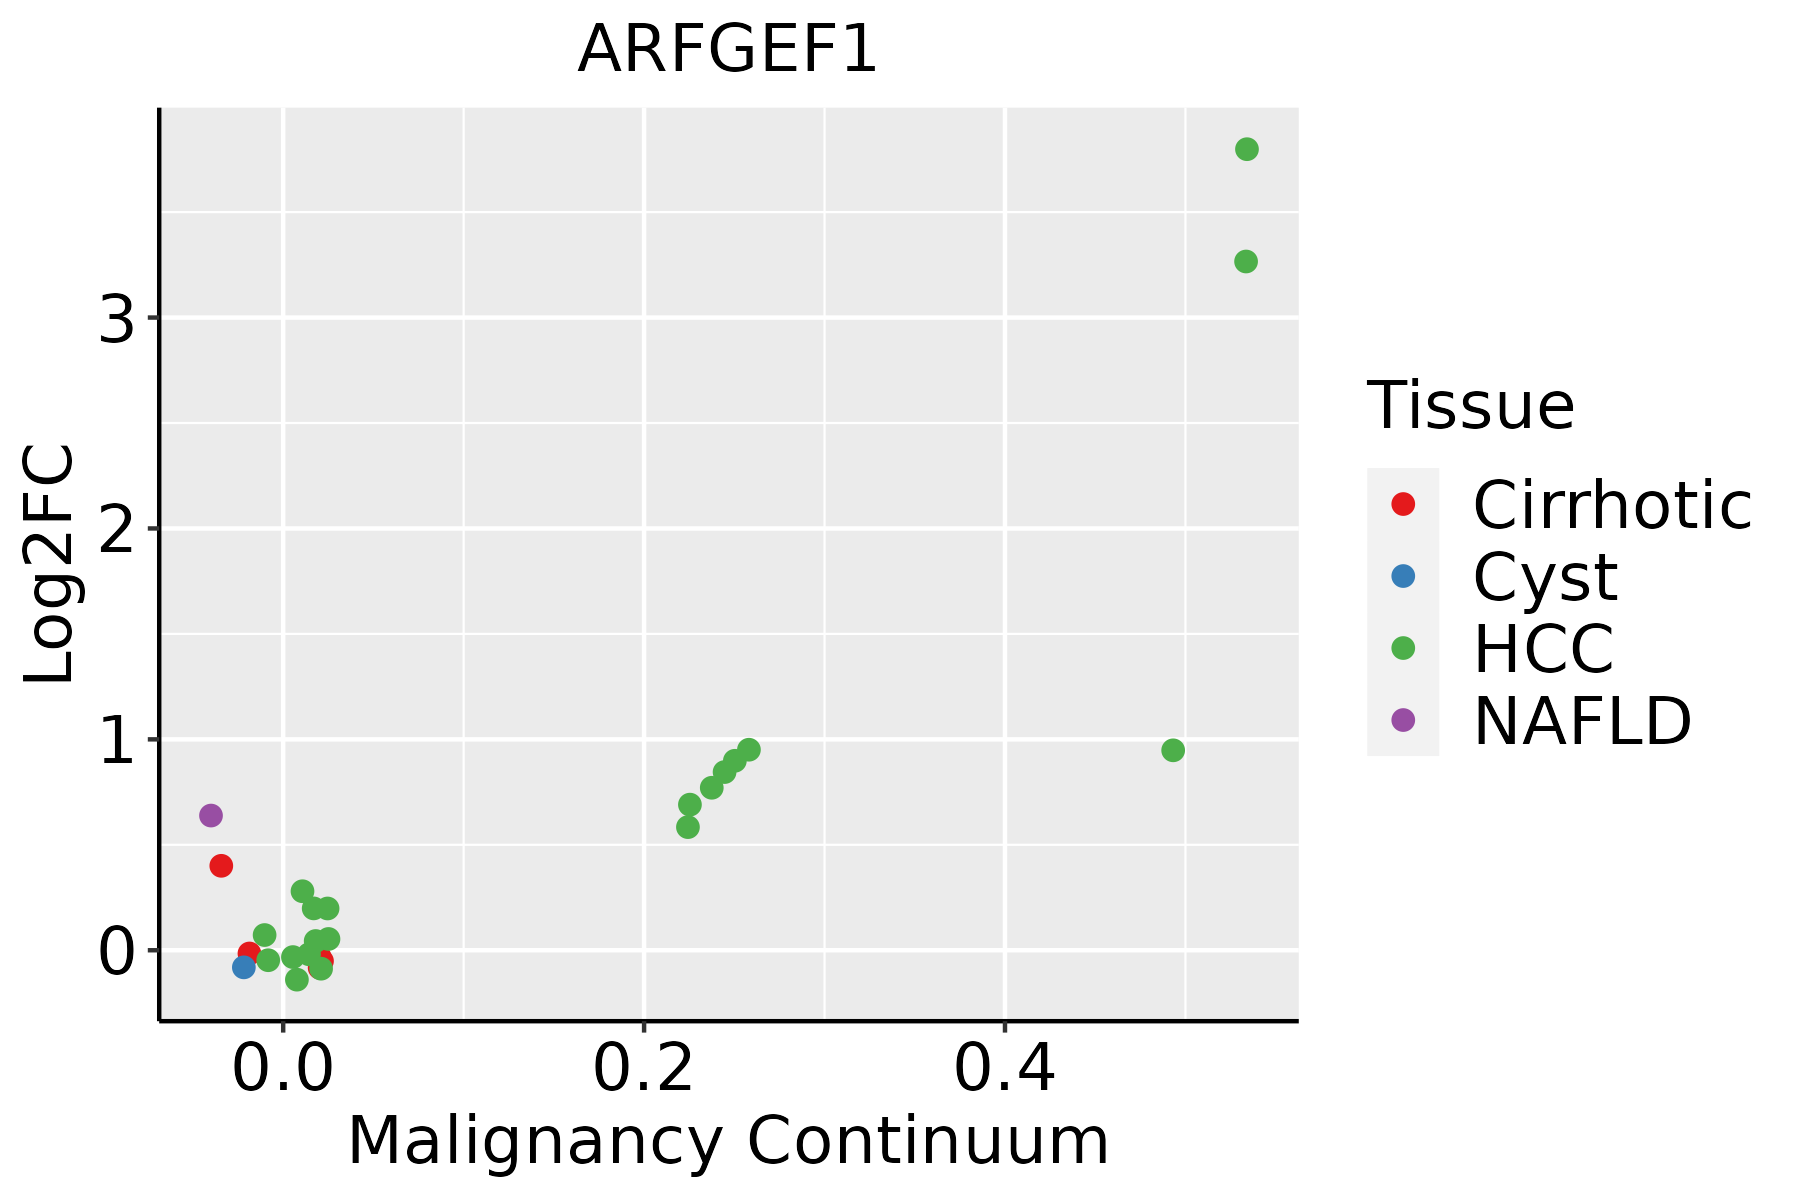 | HCC: Hepatocellular carcinoma |
| NAFLD: Non-alcoholic fatty liver disease | ||
| Lung | 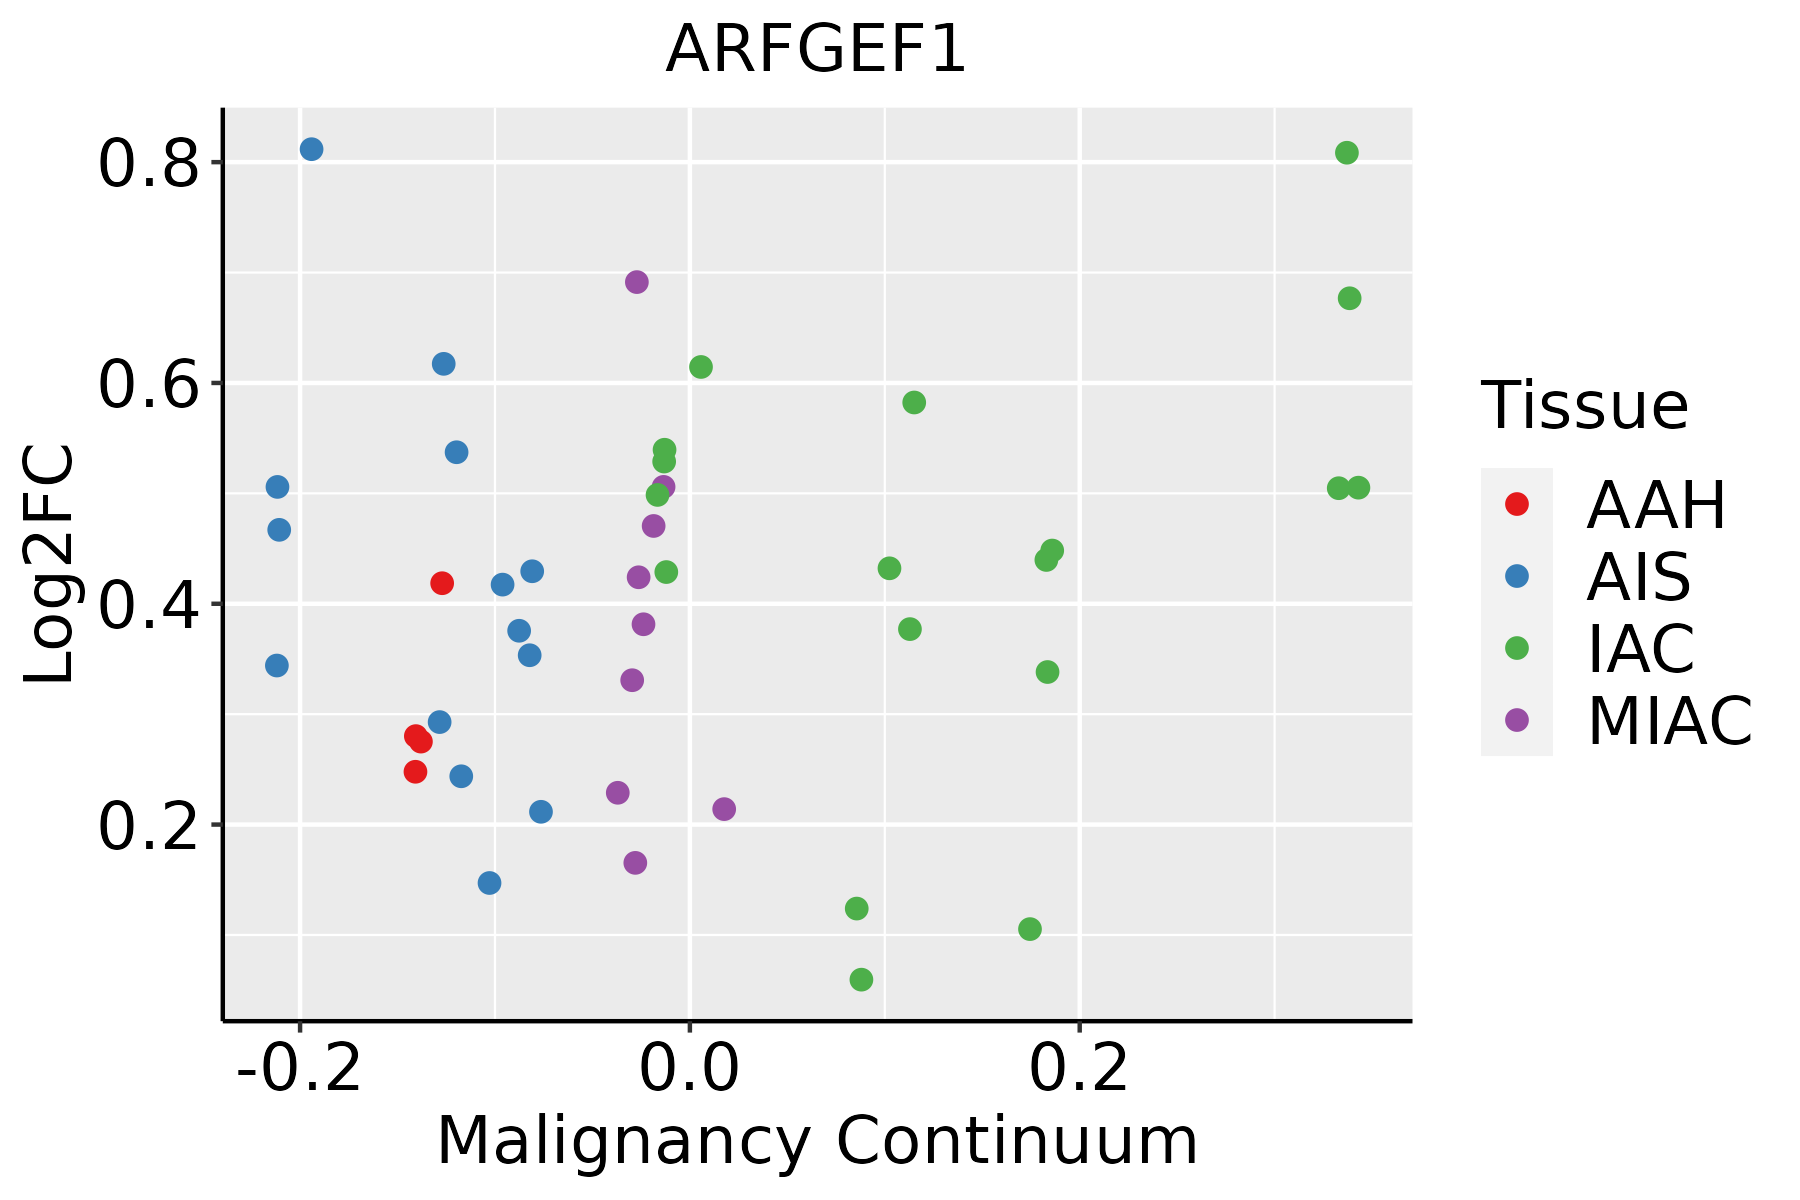 | AAH: Atypical adenomatous hyperplasia |
| AIS: Adenocarcinoma in situ | ||
| IAC: Invasive lung adenocarcinoma | ||
| MIA: Minimally invasive adenocarcinoma | ||
| Oral Cavity |  | EOLP: Erosive Oral lichen planus |
| LP: leukoplakia | ||
| NEOLP: Non-erosive oral lichen planus | ||
| OSCC: Oral squamous cell carcinoma | ||
| Prostate | 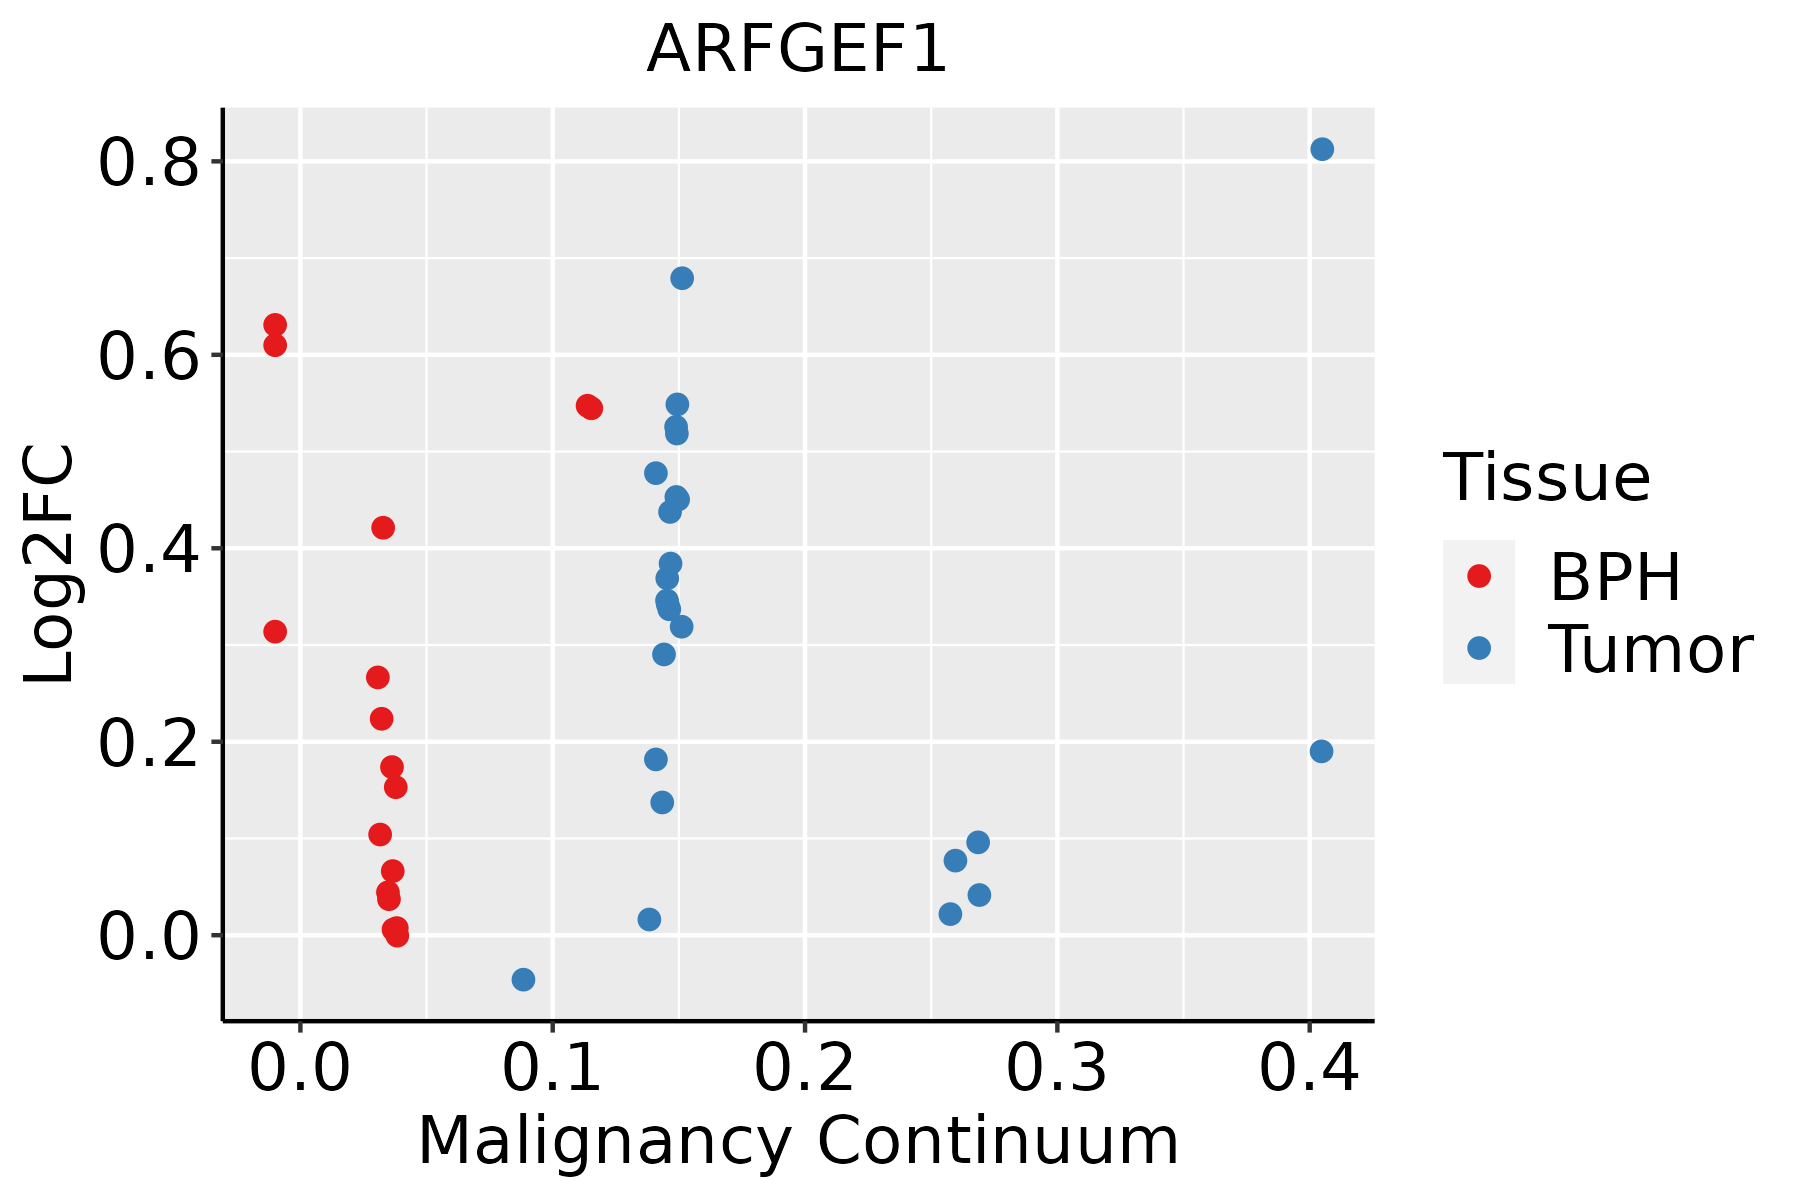 | BPH: Benign Prostatic Hyperplasia |
| Skin | 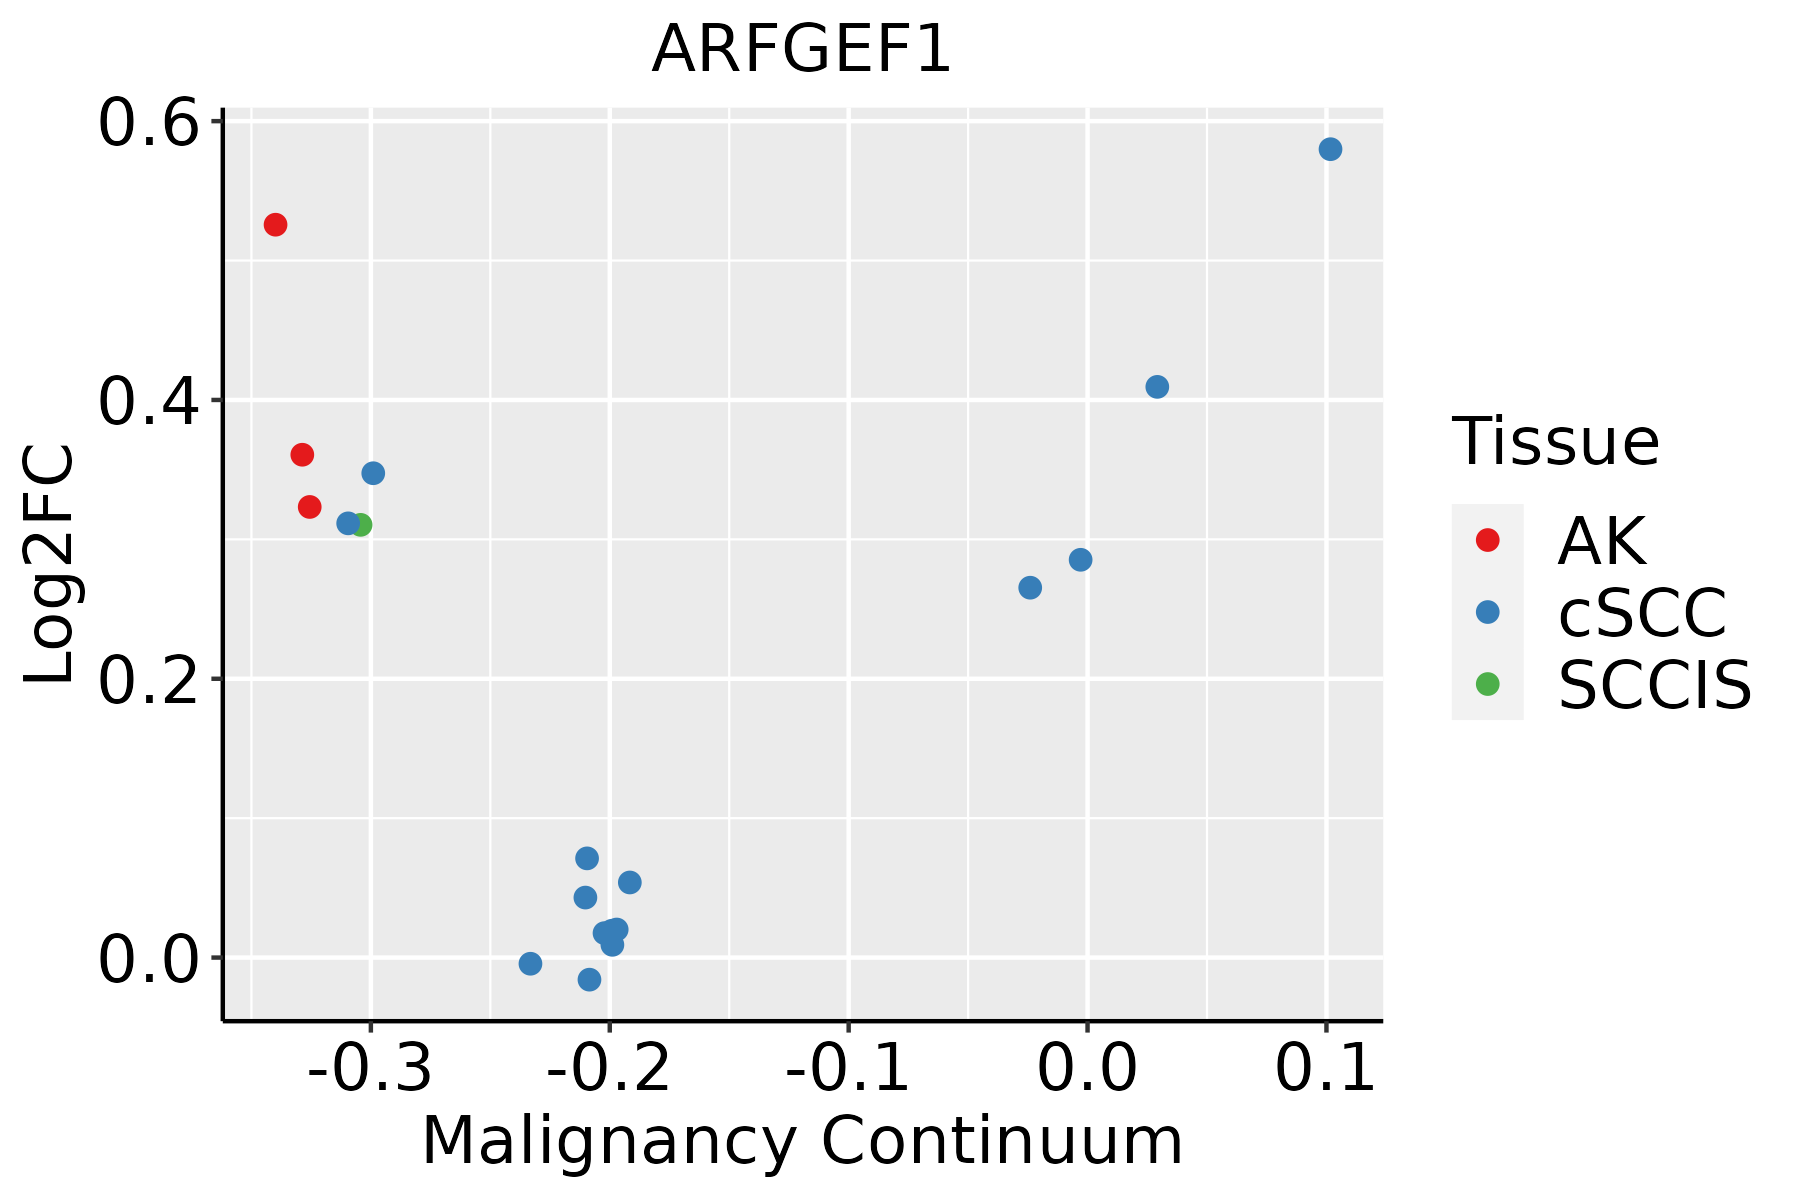 | AK: Actinic keratosis |
| cSCC: Cutaneous squamous cell carcinoma | ||
| SCCIS:squamous cell carcinoma in situ | ||
| Thyroid |  | ATC: Anaplastic thyroid cancer |
| HT: Hashimoto's thyroiditis | ||
| PTC: Papillary thyroid cancer |
| ∗log2FC in expression of this searched gene in stem-like cells from each diseased tissue sample relative to stem-like cells in normal samples in each tissue plotted against the malignancy continuum. Samples are colored based on if they are from different disease stage. |
Top |
Malignant transformation related pathway analysis |
| Find out the enriched GO biological processes and KEGG pathways involved in transition from healthy to precancer to cancer |
| Tissue | Disease Stage | Enriched GO biological Processes |
| Colorectum | AD |  |
| Colorectum | SER |  |
| Colorectum | MSS |  |
| Colorectum | MSI-H |  |
| Colorectum | FAP |  |
| ∗Top 15 enriched GO BP terms are showed in the bar plot of each disease state in each tissue. Each row represents a significant GO biological process which is colored according to the -log10(p.adjust). |
| Page: 1 2 3 4 5 6 7 8 9 |
| GO ID | Tissue | Disease Stage | Description | Gene Ratio | Bg Ratio | pvalue | p.adjust | Count |
| GO:003083715 | Prostate | Tumor | negative regulation of actin filament polymerization | 21/3246 | 65/18723 | 2.40e-03 | 1.35e-02 | 21 |
| GO:000703013 | Prostate | Tumor | Golgi organization | 40/3246 | 157/18723 | 6.33e-03 | 2.90e-02 | 40 |
| GO:200011414 | Prostate | Tumor | regulation of establishment of cell polarity | 9/3246 | 22/18723 | 7.96e-03 | 3.52e-02 | 9 |
| GO:004206028 | Skin | AK | wound healing | 91/1910 | 422/18723 | 2.93e-12 | 6.67e-10 | 91 |
| GO:000716326 | Skin | AK | establishment or maintenance of cell polarity | 53/1910 | 218/18723 | 1.32e-09 | 1.26e-07 | 53 |
| GO:000701528 | Skin | AK | actin filament organization | 85/1910 | 442/18723 | 5.94e-09 | 4.14e-07 | 85 |
| GO:190290328 | Skin | AK | regulation of supramolecular fiber organization | 75/1910 | 383/18723 | 2.11e-08 | 1.20e-06 | 75 |
| GO:000726516 | Skin | AK | Ras protein signal transduction | 68/1910 | 337/18723 | 2.83e-08 | 1.57e-06 | 68 |
| GO:003297028 | Skin | AK | regulation of actin filament-based process | 76/1910 | 397/18723 | 4.61e-08 | 2.37e-06 | 76 |
| GO:003001019 | Skin | AK | establishment of cell polarity | 36/1910 | 143/18723 | 2.24e-07 | 9.02e-06 | 36 |
| GO:003295628 | Skin | AK | regulation of actin cytoskeleton organization | 66/1910 | 358/18723 | 1.40e-06 | 4.26e-05 | 66 |
| GO:004325428 | Skin | AK | regulation of protein-containing complex assembly | 75/1910 | 428/18723 | 2.05e-06 | 5.98e-05 | 75 |
| GO:001063924 | Skin | AK | negative regulation of organelle organization | 64/1910 | 348/18723 | 2.19e-06 | 6.25e-05 | 64 |
| GO:005134626 | Skin | AK | negative regulation of hydrolase activity | 67/1910 | 379/18723 | 5.22e-06 | 1.21e-04 | 67 |
| GO:011005328 | Skin | AK | regulation of actin filament organization | 53/1910 | 278/18723 | 5.48e-06 | 1.26e-04 | 53 |
| GO:190290419 | Skin | AK | negative regulation of supramolecular fiber organization | 35/1910 | 167/18723 | 2.73e-05 | 4.77e-04 | 35 |
| GO:190303424 | Skin | AK | regulation of response to wounding | 35/1910 | 167/18723 | 2.73e-05 | 4.77e-04 | 35 |
| GO:005125827 | Skin | AK | protein polymerization | 53/1910 | 297/18723 | 3.74e-05 | 6.20e-04 | 53 |
| GO:006104118 | Skin | AK | regulation of wound healing | 29/1910 | 134/18723 | 7.03e-05 | 1.02e-03 | 29 |
| GO:003253524 | Skin | AK | regulation of cellular component size | 62/1910 | 383/18723 | 1.66e-04 | 1.94e-03 | 62 |
| Page: 1 2 3 4 5 6 7 8 9 10 11 12 13 14 15 16 17 18 19 20 21 22 23 24 25 26 27 28 29 30 31 32 33 34 35 36 37 38 39 40 |
| Pathway ID | Tissue | Disease Stage | Description | Gene Ratio | Bg Ratio | pvalue | p.adjust | qvalue | Count |
| hsa0414418 | Cervix | CC | Endocytosis | 64/1267 | 251/8465 | 6.97e-06 | 6.10e-05 | 3.61e-05 | 64 |
| hsa0414419 | Cervix | CC | Endocytosis | 64/1267 | 251/8465 | 6.97e-06 | 6.10e-05 | 3.61e-05 | 64 |
| hsa04144 | Colorectum | AD | Endocytosis | 111/2092 | 251/8465 | 5.95e-12 | 1.42e-10 | 9.08e-11 | 111 |
| hsa041441 | Colorectum | AD | Endocytosis | 111/2092 | 251/8465 | 5.95e-12 | 1.42e-10 | 9.08e-11 | 111 |
| hsa041442 | Colorectum | SER | Endocytosis | 81/1580 | 251/8465 | 1.14e-07 | 2.36e-06 | 1.71e-06 | 81 |
| hsa041443 | Colorectum | SER | Endocytosis | 81/1580 | 251/8465 | 1.14e-07 | 2.36e-06 | 1.71e-06 | 81 |
| hsa041444 | Colorectum | MSS | Endocytosis | 102/1875 | 251/8465 | 1.85e-11 | 4.43e-10 | 2.71e-10 | 102 |
| hsa041445 | Colorectum | MSS | Endocytosis | 102/1875 | 251/8465 | 1.85e-11 | 4.43e-10 | 2.71e-10 | 102 |
| hsa041446 | Colorectum | FAP | Endocytosis | 78/1404 | 251/8465 | 6.20e-09 | 2.96e-07 | 1.80e-07 | 78 |
| hsa041447 | Colorectum | FAP | Endocytosis | 78/1404 | 251/8465 | 6.20e-09 | 2.96e-07 | 1.80e-07 | 78 |
| hsa041448 | Colorectum | CRC | Endocytosis | 65/1091 | 251/8465 | 1.27e-08 | 1.06e-06 | 7.19e-07 | 65 |
| hsa041449 | Colorectum | CRC | Endocytosis | 65/1091 | 251/8465 | 1.27e-08 | 1.06e-06 | 7.19e-07 | 65 |
| hsa0414420 | Endometrium | AEH | Endocytosis | 56/1197 | 251/8465 | 2.58e-04 | 2.15e-03 | 1.57e-03 | 56 |
| hsa04144110 | Endometrium | AEH | Endocytosis | 56/1197 | 251/8465 | 2.58e-04 | 2.15e-03 | 1.57e-03 | 56 |
| hsa0414424 | Endometrium | EEC | Endocytosis | 57/1237 | 251/8465 | 3.34e-04 | 2.82e-03 | 2.10e-03 | 57 |
| hsa0414434 | Endometrium | EEC | Endocytosis | 57/1237 | 251/8465 | 3.34e-04 | 2.82e-03 | 2.10e-03 | 57 |
| hsa0414429 | Esophagus | HGIN | Endocytosis | 76/1383 | 251/8465 | 1.74e-08 | 3.34e-07 | 2.65e-07 | 76 |
| hsa04144113 | Esophagus | HGIN | Endocytosis | 76/1383 | 251/8465 | 1.74e-08 | 3.34e-07 | 2.65e-07 | 76 |
| hsa04144210 | Esophagus | ESCC | Endocytosis | 186/4205 | 251/8465 | 9.74e-16 | 4.66e-14 | 2.39e-14 | 186 |
| hsa0414437 | Esophagus | ESCC | Endocytosis | 186/4205 | 251/8465 | 9.74e-16 | 4.66e-14 | 2.39e-14 | 186 |
| Page: 1 2 |
Top |
Cell-cell communication analysis |
| Identification of potential cell-cell interactions between two cell types and their ligand-receptor pairs for different disease states |
| Ligand | Receptor | LRpair | Pathway | Tissue | Disease Stage |
| Page: 1 |
Top |
Single-cell gene regulatory network inference analysis |
| Find out the significant the regulons (TFs) and the target genes of each regulon across cell types for different disease states |
| TF | Cell Type | Tissue | Disease Stage | Target Gene | RSS | Regulon Activity |
| ∗The dot plots of a searched regulon are shown for all cell subpopulations in each disease state of each tissue based on the regulon specific score inferred using pySCENIC and by calculating the average expression. |
| Page: 1 |
Top |
Somatic mutation of malignant transformation related genes |
| Annotation of somatic variants for genes involved in malignant transformation |
| Hugo Symbol | Variant Class | Variant Classification | dbSNP RS | HGVSc | HGVSp | HGVSp Short | SWISSPROT | BIOTYPE | SIFT | PolyPhen | Tumor Sample Barcode | Tissue | Histology | Sex | Age | Stage | Therapy Types | Drugs | Outcome |
| ARFGEF1 | SNV | Missense_Mutation | novel | c.5458C>T | p.Arg1820Cys | p.R1820C | Q9Y6D6 | protein_coding | deleterious(0) | probably_damaging(1) | TCGA-3C-AALI-01 | Breast | breast invasive carcinoma | Female | <65 | I/II | Unspecific | Poly E | Complete Response |
| ARFGEF1 | SNV | Missense_Mutation | novel | c.3063N>C | p.Lys1021Asn | p.K1021N | Q9Y6D6 | protein_coding | deleterious(0) | probably_damaging(0.999) | TCGA-A2-A0EQ-01 | Breast | breast invasive carcinoma | Female | <65 | I/II | Chemotherapy | adriamycin | SD |
| ARFGEF1 | SNV | Missense_Mutation | c.2723G>A | p.Arg908Lys | p.R908K | Q9Y6D6 | protein_coding | tolerated(0.33) | benign(0.241) | TCGA-A2-A0ET-01 | Breast | breast invasive carcinoma | Female | <65 | III/IV | Chemotherapy | cytoxan | SD | |
| ARFGEF1 | SNV | Missense_Mutation | c.4345N>A | p.Glu1449Lys | p.E1449K | Q9Y6D6 | protein_coding | deleterious(0) | probably_damaging(0.995) | TCGA-A2-A1FV-01 | Breast | breast invasive carcinoma | Female | >=65 | I/II | Chemotherapy | cyclophosphamide | SD | |
| ARFGEF1 | SNV | Missense_Mutation | c.571N>A | p.Gln191Lys | p.Q191K | Q9Y6D6 | protein_coding | deleterious(0) | probably_damaging(0.989) | TCGA-A2-A4S3-01 | Breast | breast invasive carcinoma | Female | <65 | I/II | Unknown | Unknown | SD | |
| ARFGEF1 | SNV | Missense_Mutation | c.2710N>A | p.Glu904Lys | p.E904K | Q9Y6D6 | protein_coding | deleterious(0.03) | probably_damaging(0.999) | TCGA-A8-A08R-01 | Breast | breast invasive carcinoma | Female | <65 | I/II | Unknown | Unknown | SD | |
| ARFGEF1 | SNV | Missense_Mutation | novel | c.1879A>G | p.Ser627Gly | p.S627G | Q9Y6D6 | protein_coding | deleterious(0.03) | probably_damaging(0.996) | TCGA-A8-A09E-01 | Breast | breast invasive carcinoma | Female | >=65 | III/IV | Hormone Therapy | anastrozole | SD |
| ARFGEF1 | SNV | Missense_Mutation | c.3227N>C | p.Arg1076Thr | p.R1076T | Q9Y6D6 | protein_coding | tolerated(0.22) | benign(0.039) | TCGA-AC-A23H-01 | Breast | breast invasive carcinoma | Female | >=65 | I/II | Unknown | Unknown | PD | |
| ARFGEF1 | SNV | Missense_Mutation | rs751084276 | c.92N>G | p.Ser31Cys | p.S31C | Q9Y6D6 | protein_coding | deleterious(0.02) | possibly_damaging(0.784) | TCGA-AC-A23H-01 | Breast | breast invasive carcinoma | Female | >=65 | I/II | Unknown | Unknown | PD |
| ARFGEF1 | SNV | Missense_Mutation | c.158N>T | p.Pro53Leu | p.P53L | Q9Y6D6 | protein_coding | tolerated(0.1) | benign(0.18) | TCGA-BH-A2L8-01 | Breast | breast invasive carcinoma | Female | <65 | I/II | Chemotherapy | cytoxan | CR |
| Page: 1 2 3 4 5 6 7 8 9 10 11 12 13 14 15 16 17 18 19 20 21 22 23 24 |
Top |
Related drugs of malignant transformation related genes |
| Identification of chemicals and drugs interact with genes involved in malignant transfromation |
| (DGIdb 4.0) |
| Entrez ID | Symbol | Category | Interaction Types | Drug Claim Name | Drug Name | PMIDs |
| Page: 1 |

Copyright 2023-Present -The University of Texas Health Science Center at Houston |