
|
|||||
|
 | |
| |
| |
| |
| |
| |
|
Gene: WNK1 |
Gene summary for WNK1 |
| Gene information | Species | Human | Gene symbol | WNK1 | Gene ID | 65125 |
| Gene name | WNK lysine deficient protein kinase 1 | |
| Gene Alias | HSAN2 | |
| Cytomap | 12p13.33 | |
| Gene Type | protein-coding | GO ID | GO:0001932 | UniProtAcc | Q9H4A3 |
Top |
Malignant transformation analysis |
| Identification of the aberrant gene expression in precancerous and cancerous lesions by comparing the gene expression of stem-like cells in diseased tissues with normal stem cells |
| Entrez ID | Symbol | Replicates | Species | Organ | Tissue | Adj P-value | Log2FC | Malignancy |
| 65125 | WNK1 | CA_HPV_1 | Human | Cervix | CC | 1.54e-05 | -1.65e-01 | 0.0264 |
| 65125 | WNK1 | CA_HPV_3 | Human | Cervix | CC | 1.36e-11 | 4.07e-01 | 0.0414 |
| 65125 | WNK1 | N_HPV_2 | Human | Cervix | N_HPV | 3.04e-02 | 1.85e-01 | -0.0131 |
| 65125 | WNK1 | CCI_1 | Human | Cervix | CC | 5.31e-03 | 4.78e-01 | 0.528 |
| 65125 | WNK1 | CCI_2 | Human | Cervix | CC | 1.10e-11 | 1.71e+00 | 0.5249 |
| 65125 | WNK1 | CCI_3 | Human | Cervix | CC | 4.70e-19 | 1.53e+00 | 0.516 |
| 65125 | WNK1 | L1 | Human | Cervix | CC | 5.44e-03 | -3.17e-01 | 0.0802 |
| 65125 | WNK1 | T1 | Human | Cervix | CC | 2.33e-04 | -3.66e-01 | 0.0918 |
| 65125 | WNK1 | LZE4T | Human | Esophagus | ESCC | 1.02e-09 | 1.35e-01 | 0.0811 |
| 65125 | WNK1 | LZE7T | Human | Esophagus | ESCC | 4.65e-09 | 6.89e-01 | 0.0667 |
| 65125 | WNK1 | LZE8T | Human | Esophagus | ESCC | 6.08e-10 | 2.88e-01 | 0.067 |
| 65125 | WNK1 | LZE20T | Human | Esophagus | ESCC | 1.31e-03 | 2.63e-01 | 0.0662 |
| 65125 | WNK1 | LZE22D1 | Human | Esophagus | HGIN | 4.55e-03 | -9.79e-02 | 0.0595 |
| 65125 | WNK1 | LZE24T | Human | Esophagus | ESCC | 8.84e-13 | 4.95e-01 | 0.0596 |
| 65125 | WNK1 | LZE21T | Human | Esophagus | ESCC | 3.48e-02 | 1.70e-01 | 0.0655 |
| 65125 | WNK1 | P1T-E | Human | Esophagus | ESCC | 5.74e-05 | 5.83e-01 | 0.0875 |
| 65125 | WNK1 | P2T-E | Human | Esophagus | ESCC | 1.14e-44 | 8.58e-01 | 0.1177 |
| 65125 | WNK1 | P4T-E | Human | Esophagus | ESCC | 8.41e-33 | 9.46e-01 | 0.1323 |
| 65125 | WNK1 | P5T-E | Human | Esophagus | ESCC | 3.52e-25 | 3.63e-01 | 0.1327 |
| 65125 | WNK1 | P8T-E | Human | Esophagus | ESCC | 1.08e-27 | 5.68e-01 | 0.0889 |
| Page: 1 2 3 4 5 6 7 8 9 10 |
| Tissue | Expression Dynamics | Abbreviation |
| Cervix | 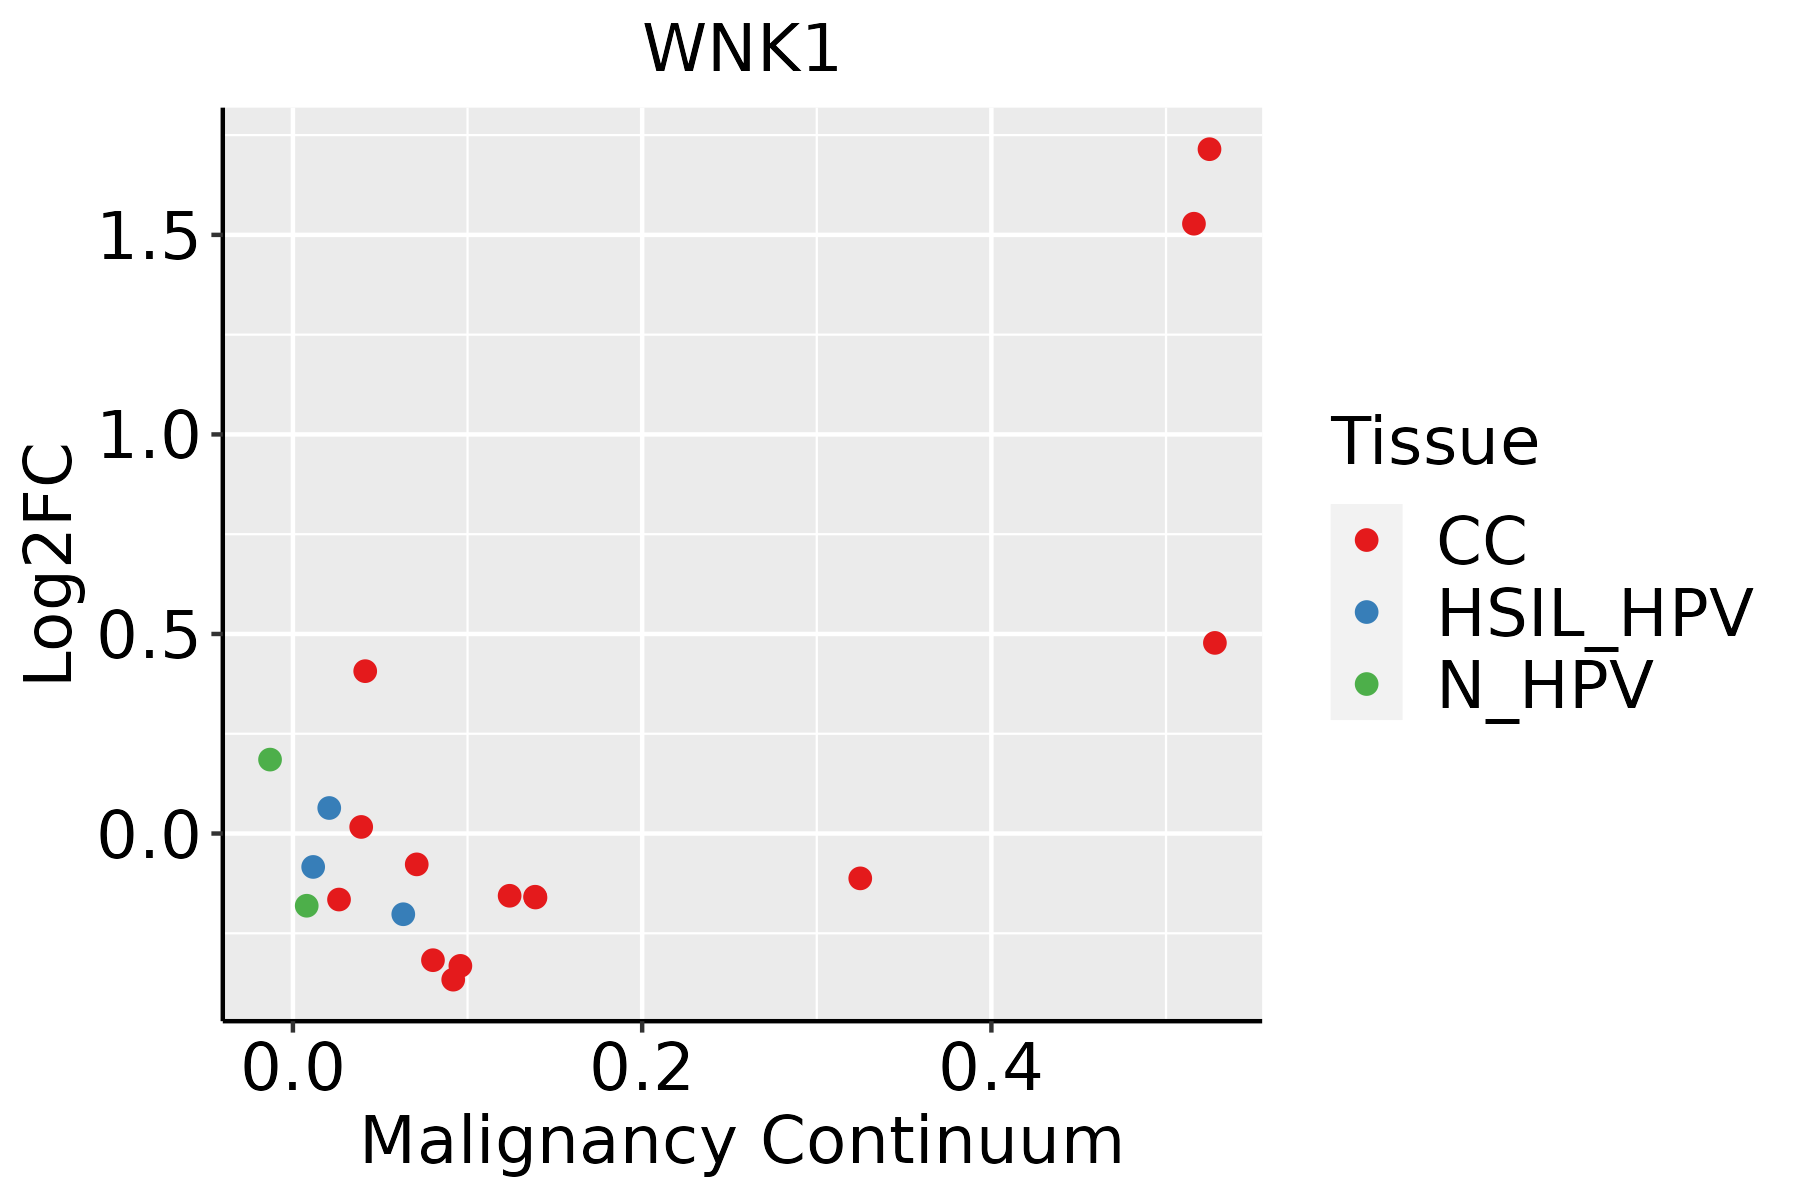 | CC: Cervix cancer |
| HSIL_HPV: HPV-infected high-grade squamous intraepithelial lesions | ||
| N_HPV: HPV-infected normal cervix | ||
| Esophagus | 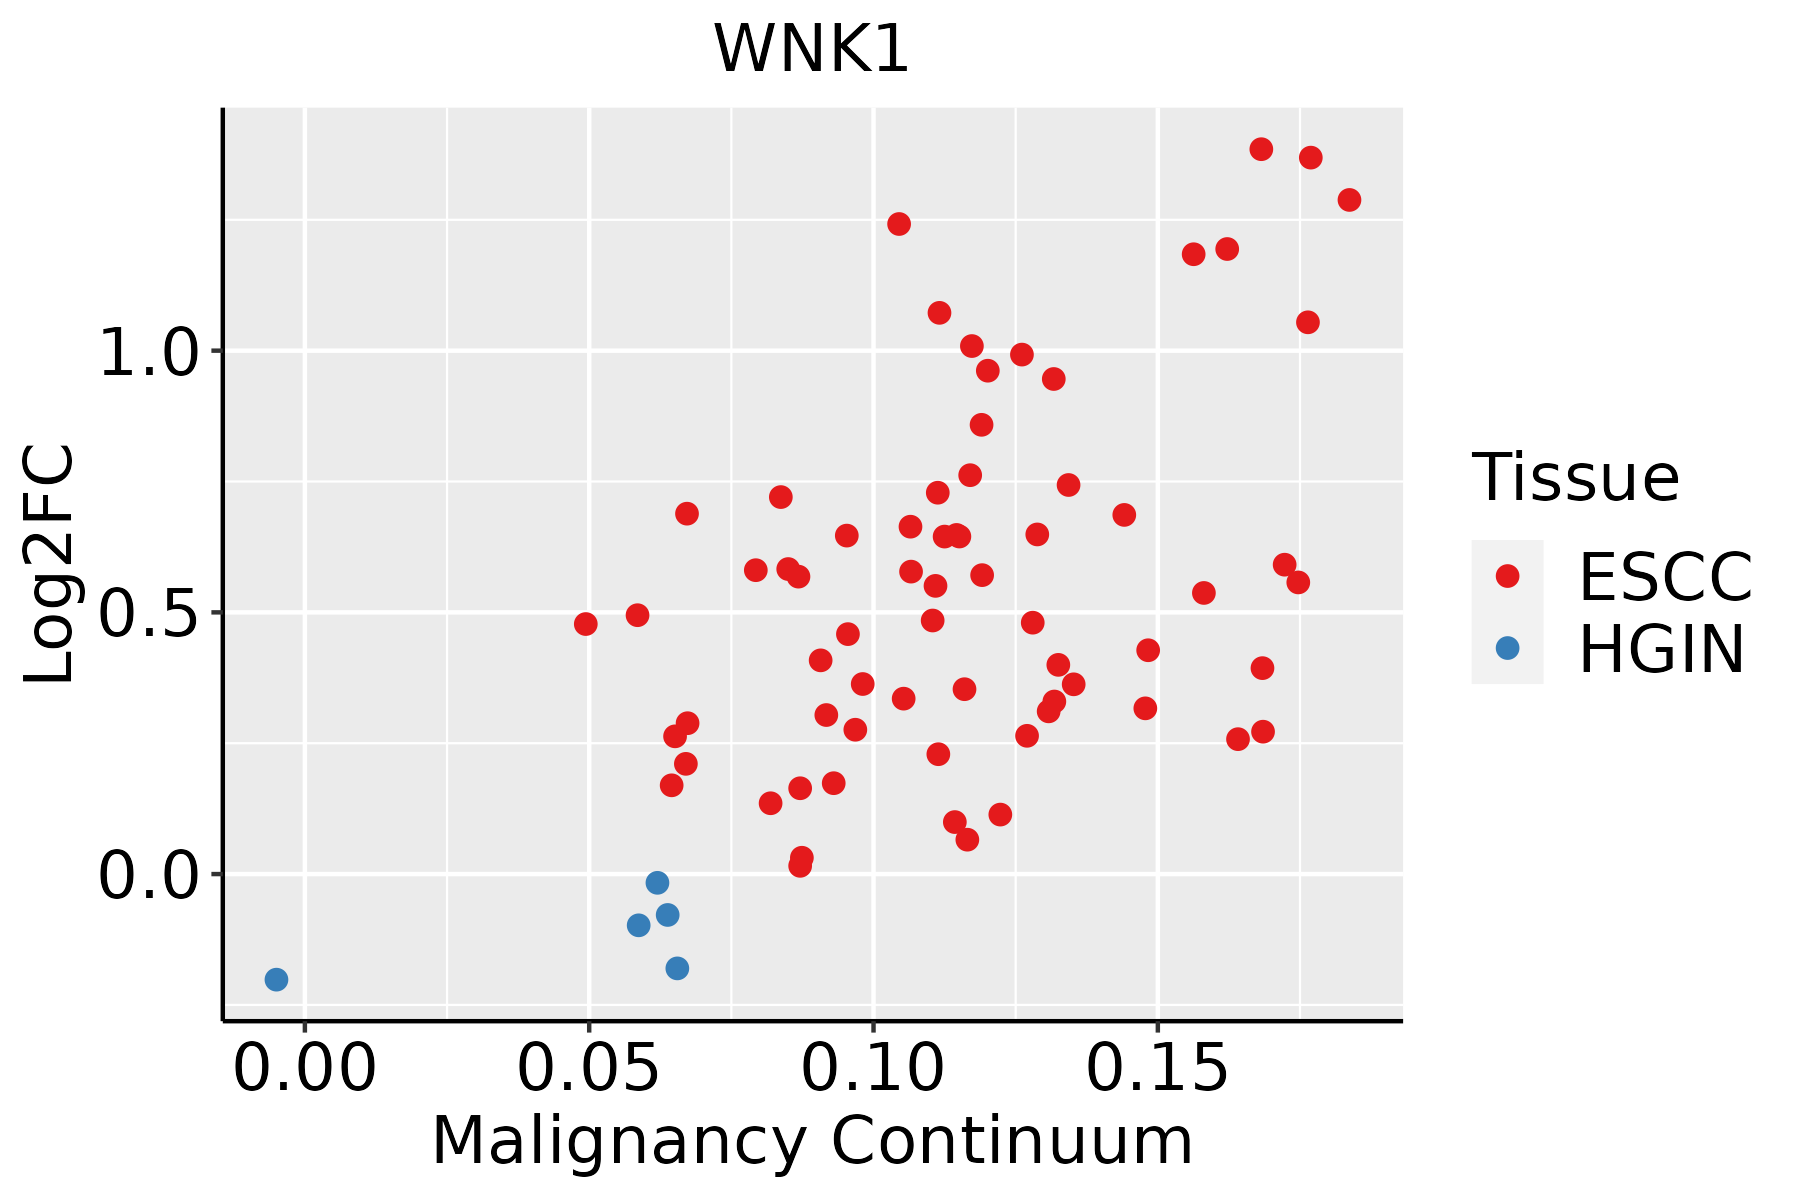 | ESCC: Esophageal squamous cell carcinoma |
| HGIN: High-grade intraepithelial neoplasias | ||
| LGIN: Low-grade intraepithelial neoplasias | ||
| Liver | 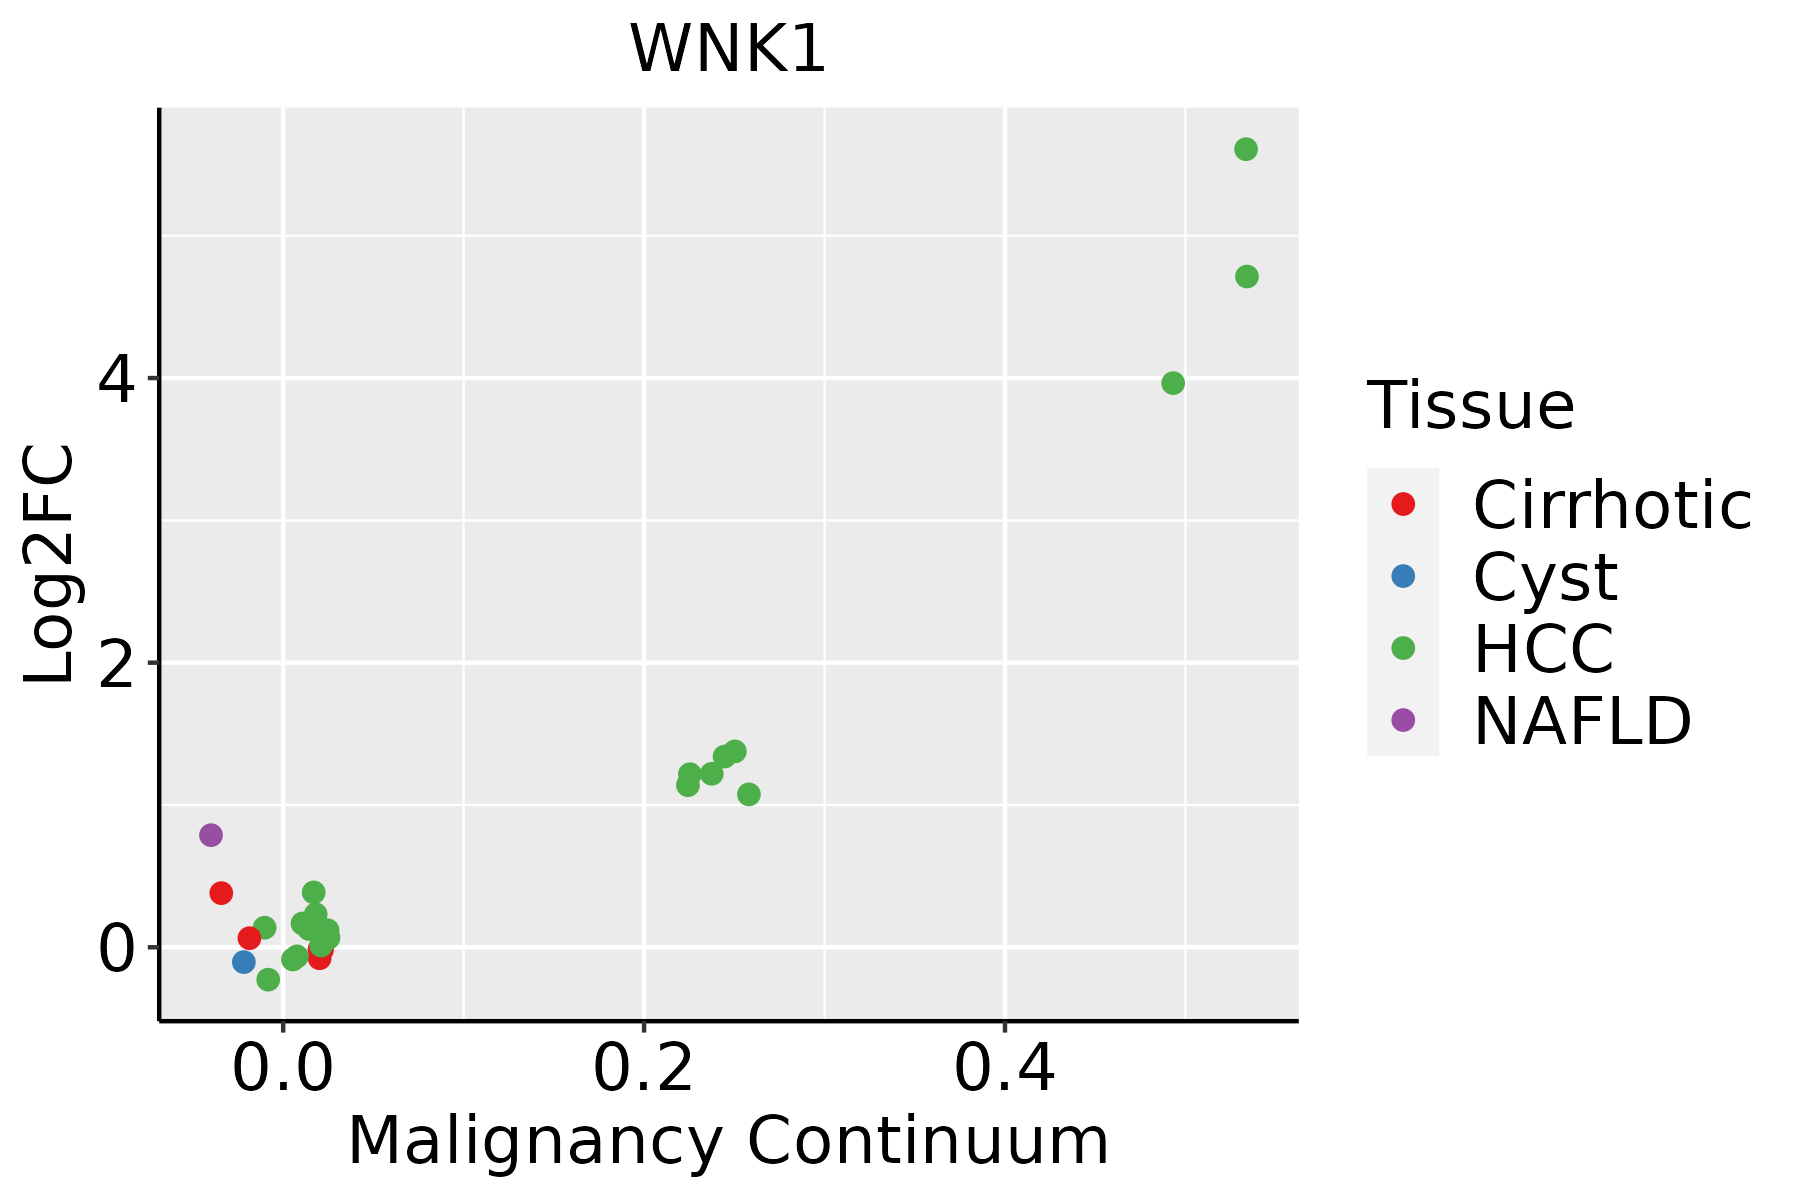 | HCC: Hepatocellular carcinoma |
| NAFLD: Non-alcoholic fatty liver disease | ||
| Lung | 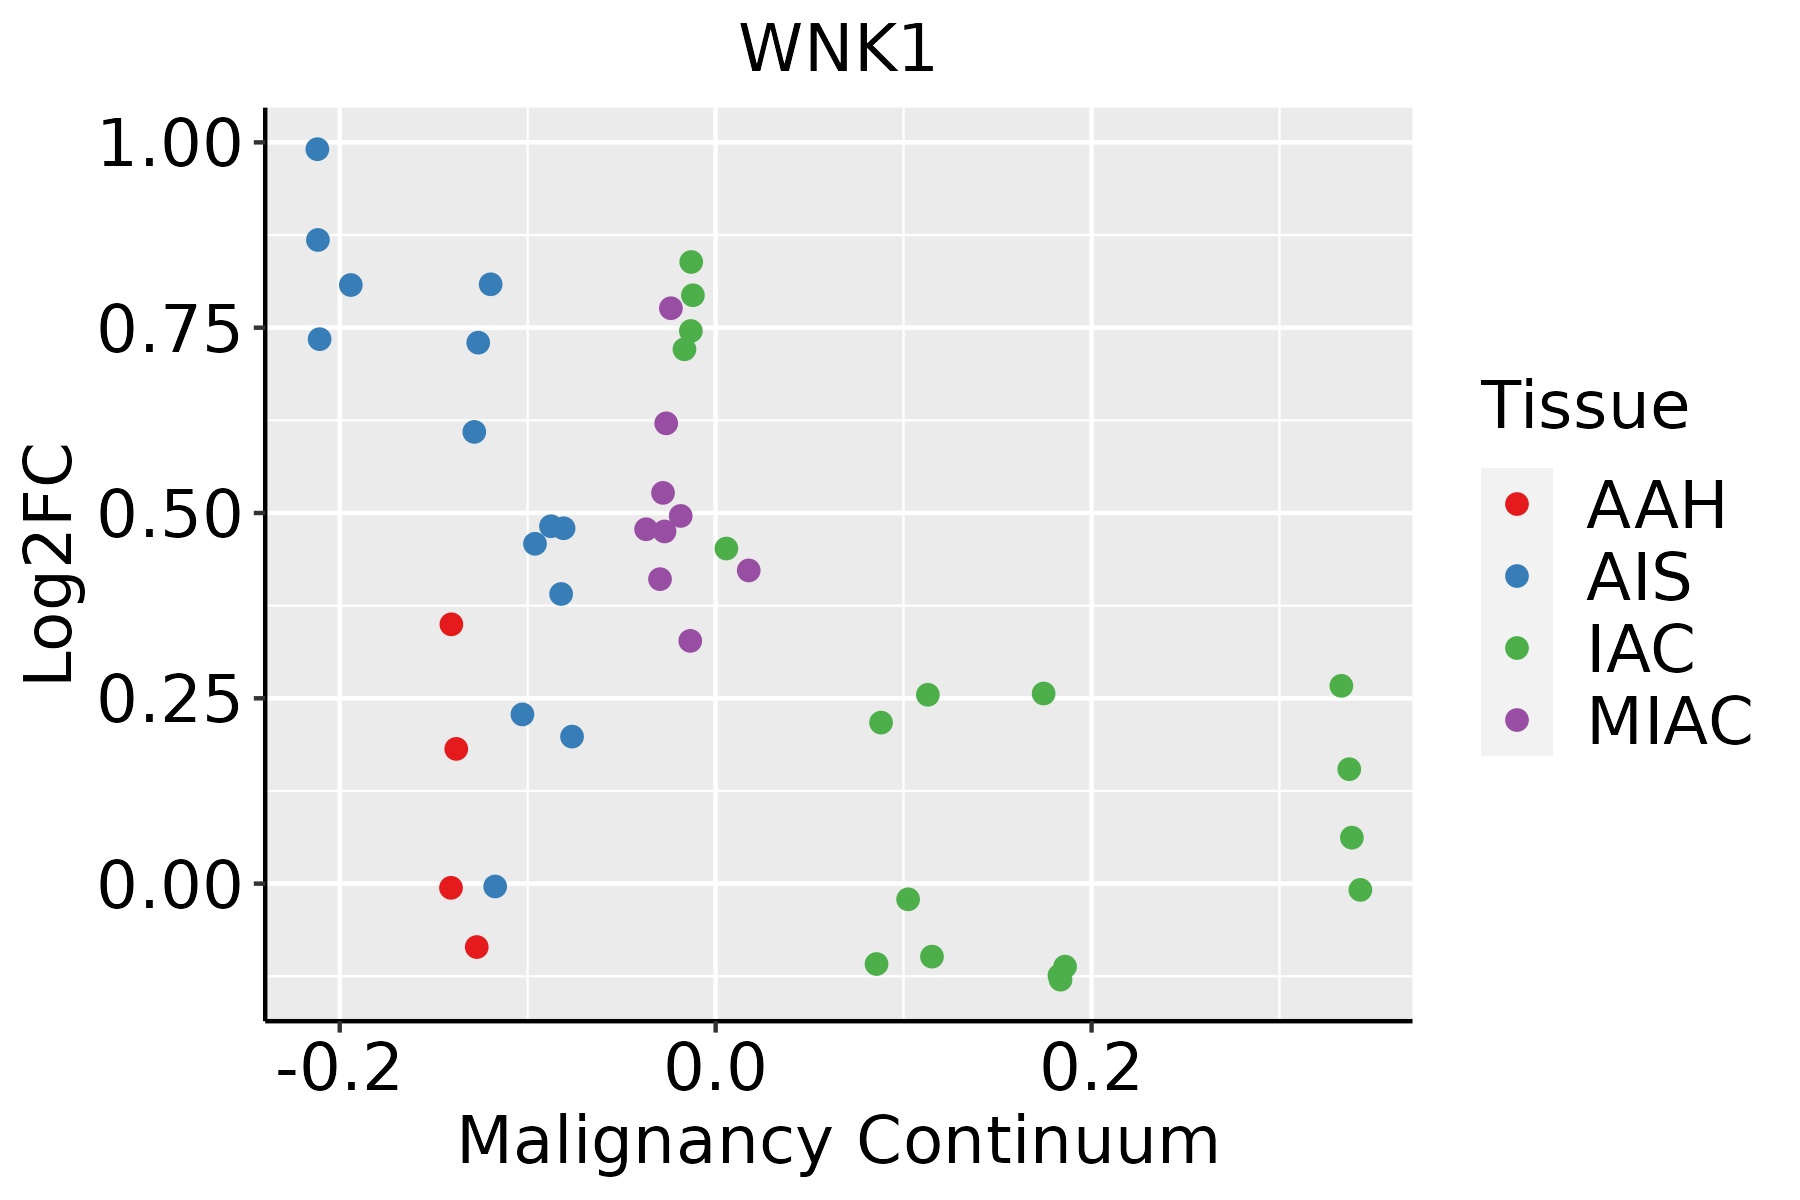 | AAH: Atypical adenomatous hyperplasia |
| AIS: Adenocarcinoma in situ | ||
| IAC: Invasive lung adenocarcinoma | ||
| MIA: Minimally invasive adenocarcinoma | ||
| Oral Cavity | 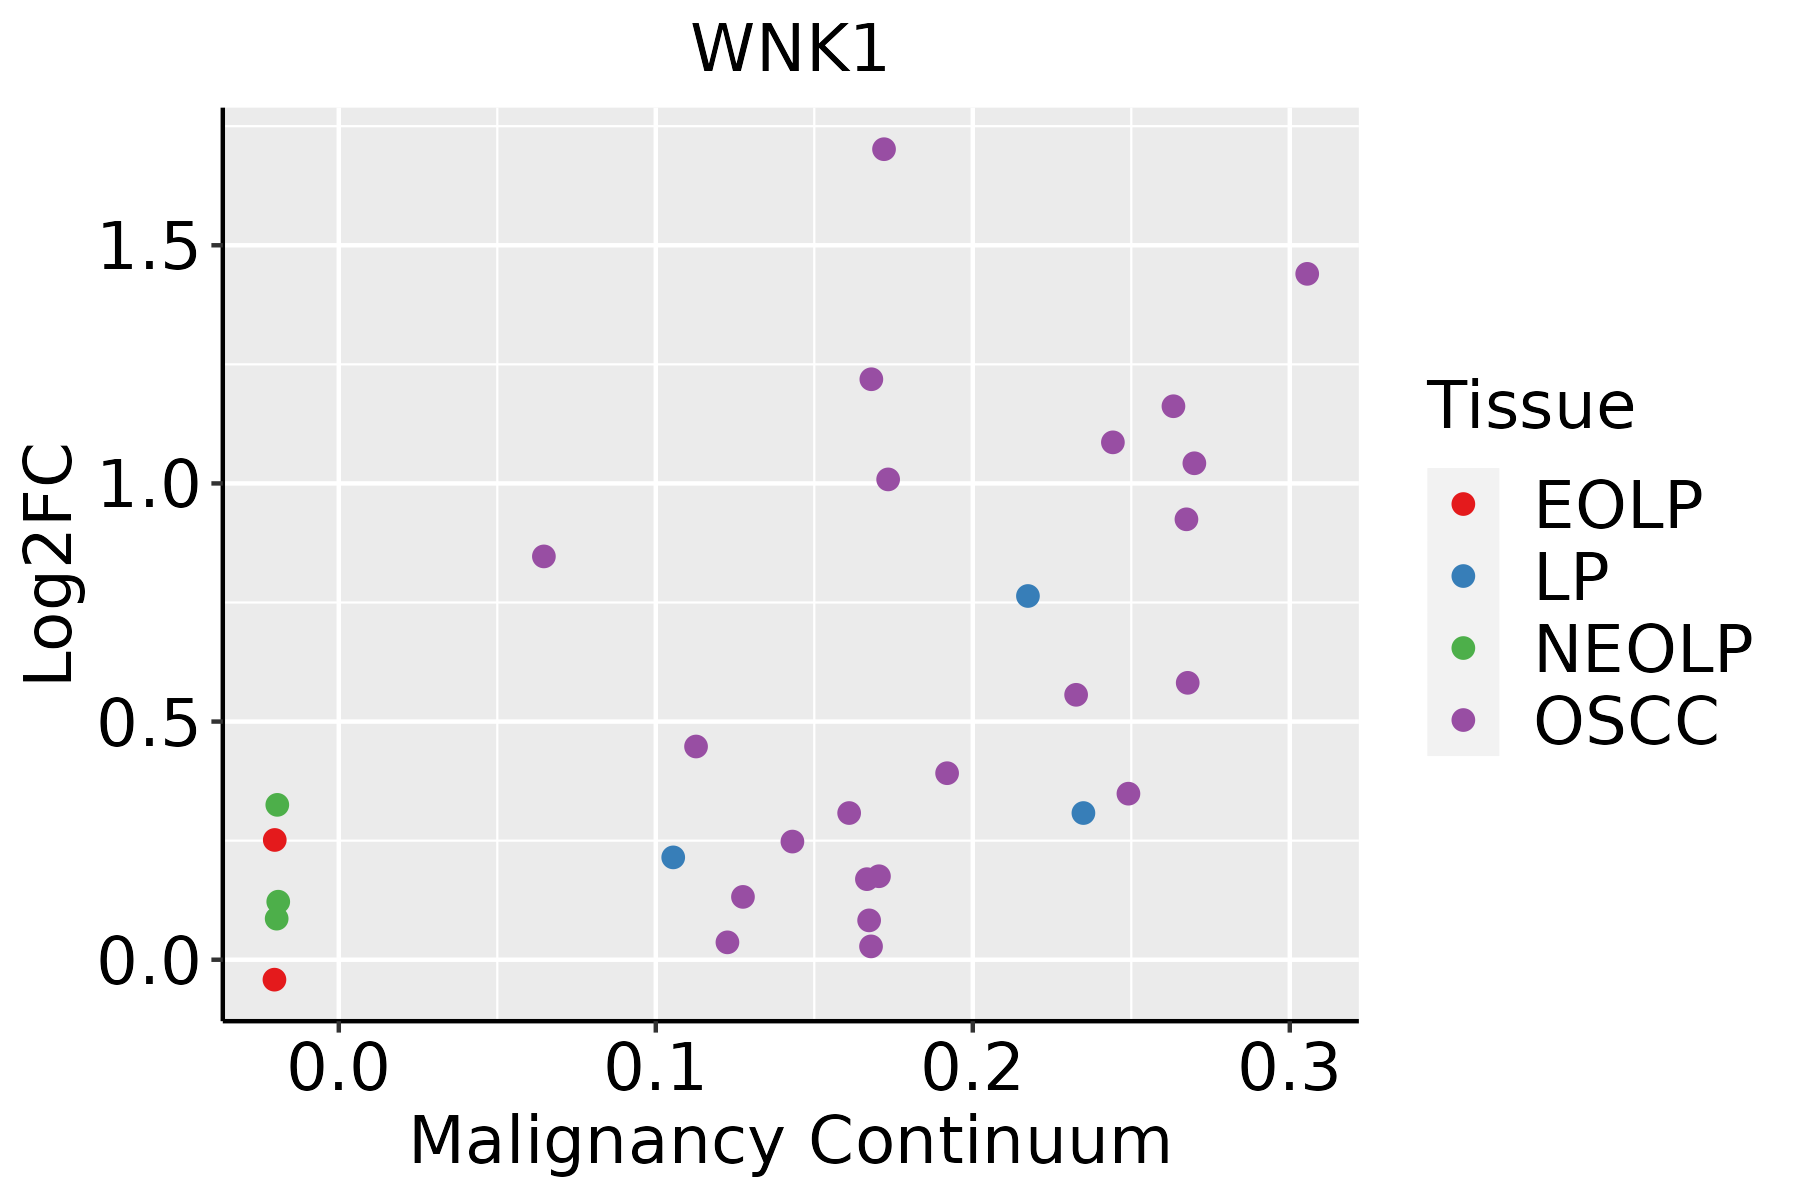 | EOLP: Erosive Oral lichen planus |
| LP: leukoplakia | ||
| NEOLP: Non-erosive oral lichen planus | ||
| OSCC: Oral squamous cell carcinoma | ||
| Prostate | 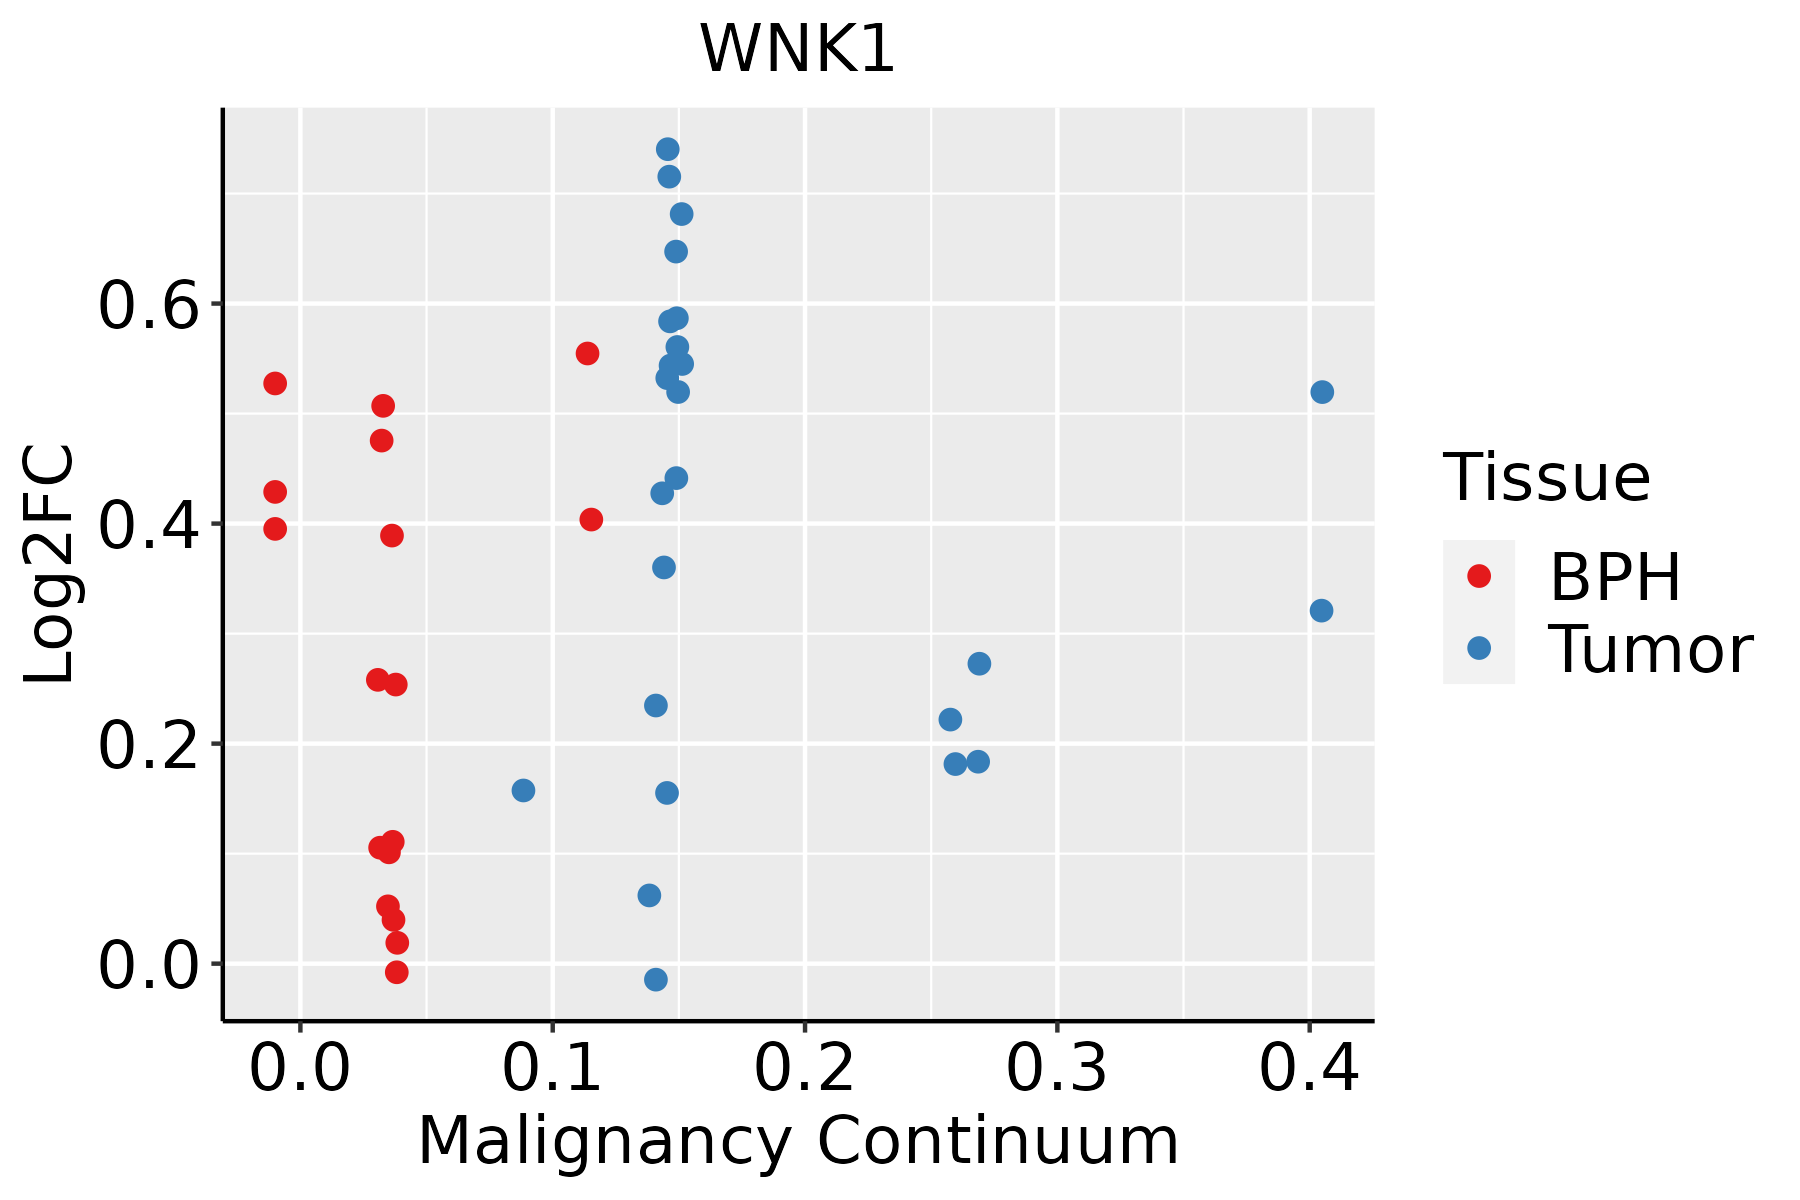 | BPH: Benign Prostatic Hyperplasia |
| Skin |  | AK: Actinic keratosis |
| cSCC: Cutaneous squamous cell carcinoma | ||
| SCCIS:squamous cell carcinoma in situ | ||
| Thyroid | 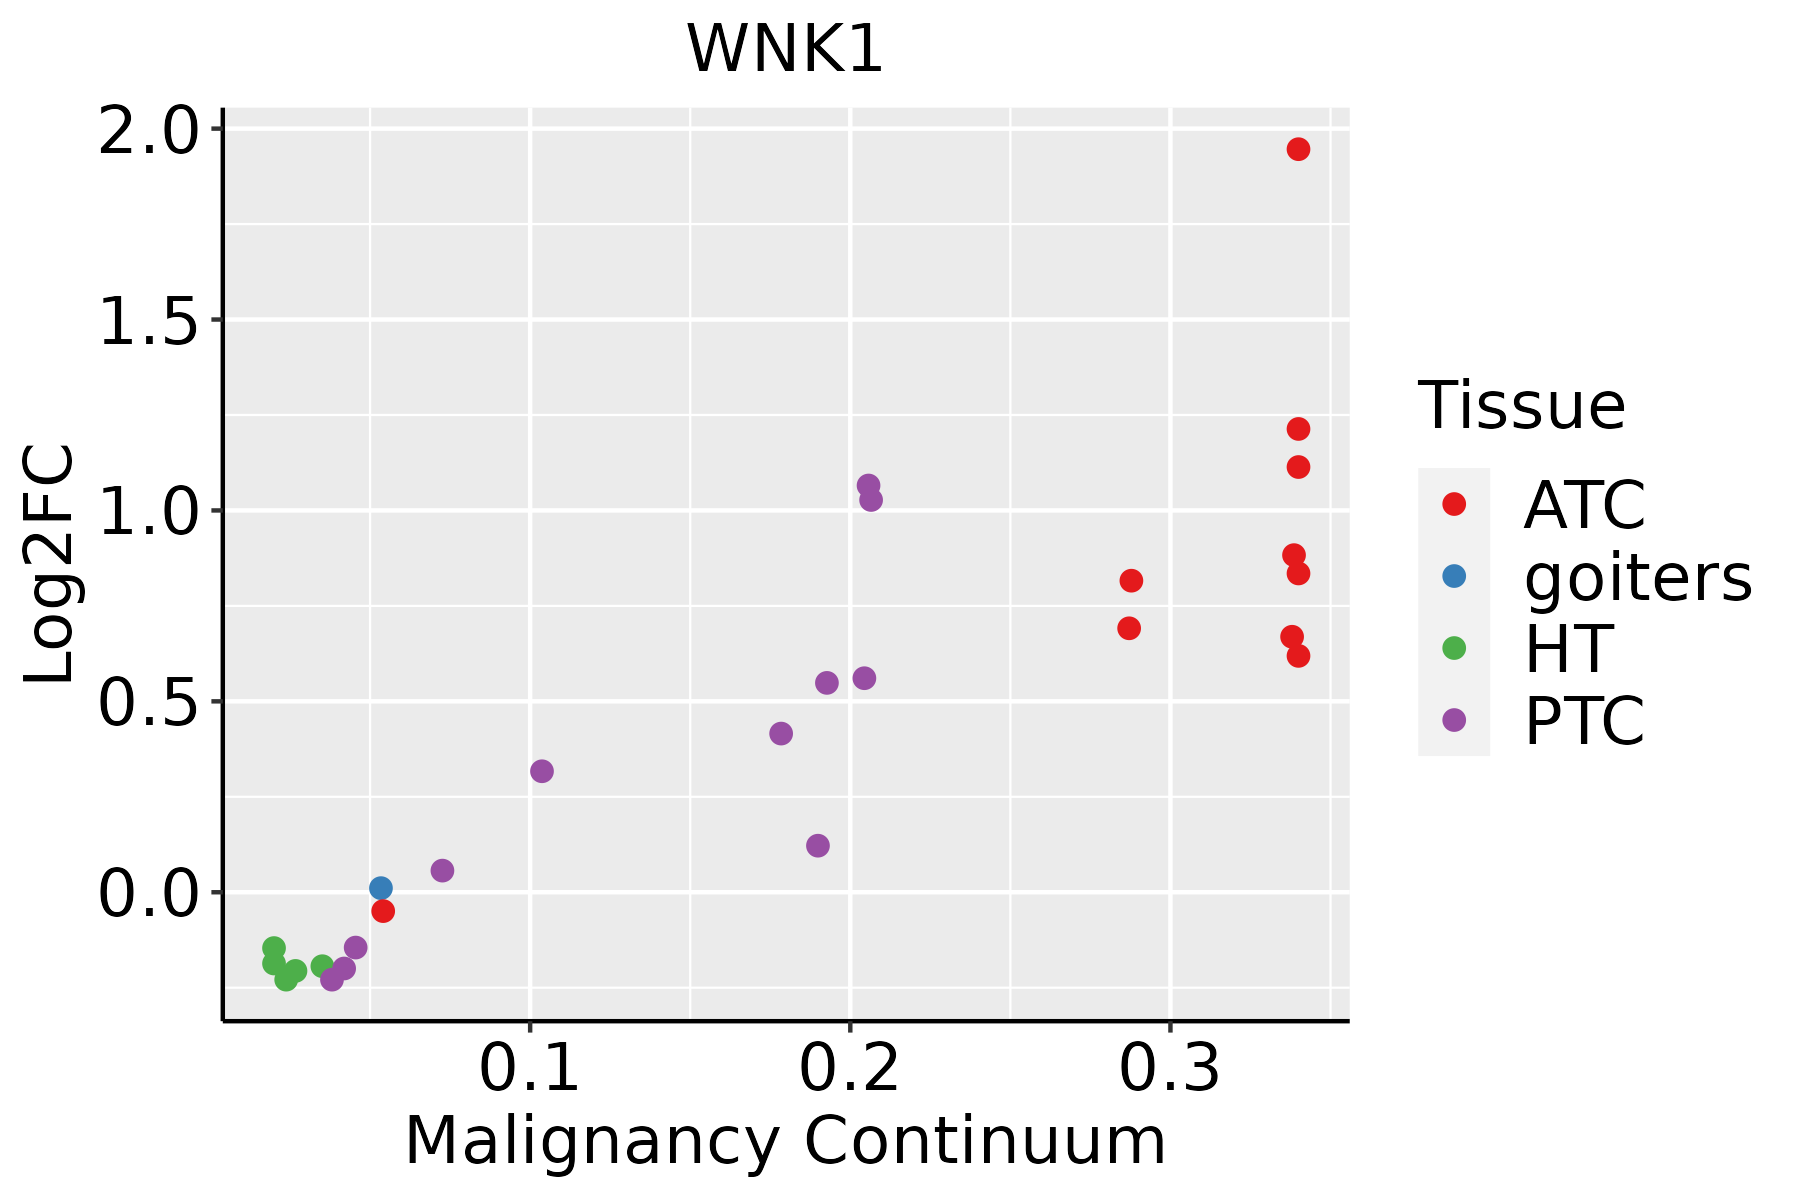 | ATC: Anaplastic thyroid cancer |
| HT: Hashimoto's thyroiditis | ||
| PTC: Papillary thyroid cancer |
| ∗log2FC in expression of this searched gene in stem-like cells from each diseased tissue sample relative to stem-like cells in normal samples in each tissue plotted against the malignancy continuum. Samples are colored based on if they are from different disease stage. |
Top |
Malignant transformation related pathway analysis |
| Find out the enriched GO biological processes and KEGG pathways involved in transition from healthy to precancer to cancer |
| Tissue | Disease Stage | Enriched GO biological Processes |
| Colorectum | AD |  |
| Colorectum | SER |  |
| Colorectum | MSS |  |
| Colorectum | MSI-H |  |
| Colorectum | FAP |  |
| ∗Top 15 enriched GO BP terms are showed in the bar plot of each disease state in each tissue. Each row represents a significant GO biological process which is colored according to the -log10(p.adjust). |
| Page: 1 2 3 4 5 6 7 8 9 |
| GO ID | Tissue | Disease Stage | Description | Gene Ratio | Bg Ratio | pvalue | p.adjust | Count |
| GO:20004064 | Skin | AK | positive regulation of T cell migration | 10/1910 | 29/18723 | 3.86e-04 | 3.70e-03 | 10 |
| GO:20004034 | Skin | AK | positive regulation of lymphocyte migration | 11/1910 | 35/18723 | 4.96e-04 | 4.58e-03 | 11 |
| GO:19016232 | Skin | AK | regulation of lymphocyte chemotaxis | 9/1910 | 25/18723 | 5.25e-04 | 4.79e-03 | 9 |
| GO:0010819 | Skin | AK | regulation of T cell chemotaxis | 7/1910 | 16/18723 | 5.66e-04 | 5.06e-03 | 7 |
| GO:00508529 | Skin | AK | T cell receptor signaling pathway | 25/1910 | 123/18723 | 5.89e-04 | 5.21e-03 | 25 |
| GO:00716748 | Skin | AK | mononuclear cell migration | 35/1910 | 196/18723 | 7.20e-04 | 6.10e-03 | 35 |
| GO:20004044 | Skin | AK | regulation of T cell migration | 12/1910 | 42/18723 | 7.34e-04 | 6.20e-03 | 12 |
| GO:00336276 | Skin | AK | cell adhesion mediated by integrin | 17/1910 | 72/18723 | 7.51e-04 | 6.32e-03 | 17 |
| GO:20004014 | Skin | AK | regulation of lymphocyte migration | 15/1910 | 61/18723 | 9.64e-04 | 7.68e-03 | 15 |
| GO:005087820 | Skin | AK | regulation of body fluid levels | 58/1910 | 379/18723 | 1.11e-03 | 8.61e-03 | 58 |
| GO:004308716 | Skin | AK | regulation of GTPase activity | 54/1910 | 348/18723 | 1.17e-03 | 8.98e-03 | 54 |
| GO:001003828 | Skin | AK | response to metal ion | 57/1910 | 373/18723 | 1.26e-03 | 9.52e-03 | 57 |
| GO:00108182 | Skin | AK | T cell chemotaxis | 9/1910 | 28/18723 | 1.34e-03 | 1.00e-02 | 9 |
| GO:004586019 | Skin | AK | positive regulation of protein kinase activity | 58/1910 | 386/18723 | 1.71e-03 | 1.20e-02 | 58 |
| GO:005134828 | Skin | AK | negative regulation of transferase activity | 43/1910 | 268/18723 | 1.85e-03 | 1.27e-02 | 43 |
| GO:00716777 | Skin | AK | positive regulation of mononuclear cell migration | 15/1910 | 65/18723 | 1.92e-03 | 1.31e-02 | 15 |
| GO:005159210 | Skin | AK | response to calcium ion | 27/1910 | 149/18723 | 2.22e-03 | 1.47e-02 | 27 |
| GO:004232625 | Skin | AK | negative regulation of phosphorylation | 57/1910 | 385/18723 | 2.61e-03 | 1.68e-02 | 57 |
| GO:00726762 | Skin | AK | lymphocyte migration | 22/1910 | 117/18723 | 3.41e-03 | 2.08e-02 | 22 |
| GO:001821016 | Skin | AK | peptidyl-threonine modification | 23/1910 | 125/18723 | 3.72e-03 | 2.22e-02 | 23 |
| Page: 1 2 3 4 5 6 7 8 9 10 11 12 13 14 15 16 17 18 19 20 21 22 23 24 25 26 27 28 29 30 31 32 33 34 35 36 37 38 39 40 41 |
| Pathway ID | Tissue | Disease Stage | Description | Gene Ratio | Bg Ratio | pvalue | p.adjust | qvalue | Count |
| Page: 1 |
Top |
Cell-cell communication analysis |
| Identification of potential cell-cell interactions between two cell types and their ligand-receptor pairs for different disease states |
| Ligand | Receptor | LRpair | Pathway | Tissue | Disease Stage |
| Page: 1 |
Top |
Single-cell gene regulatory network inference analysis |
| Find out the significant the regulons (TFs) and the target genes of each regulon across cell types for different disease states |
| TF | Cell Type | Tissue | Disease Stage | Target Gene | RSS | Regulon Activity |
| ∗The dot plots of a searched regulon are shown for all cell subpopulations in each disease state of each tissue based on the regulon specific score inferred using pySCENIC and by calculating the average expression. |
| Page: 1 |
Top |
Somatic mutation of malignant transformation related genes |
| Annotation of somatic variants for genes involved in malignant transformation |
| Hugo Symbol | Variant Class | Variant Classification | dbSNP RS | HGVSc | HGVSp | HGVSp Short | SWISSPROT | BIOTYPE | SIFT | PolyPhen | Tumor Sample Barcode | Tissue | Histology | Sex | Age | Stage | Therapy Types | Drugs | Outcome |
| WNK1 | SNV | Missense_Mutation | novel | c.3772T>C | p.Ser1258Pro | p.S1258P | Q9H4A3 | protein_coding | tolerated_low_confidence(0.91) | benign(0) | TCGA-A2-A0YM-01 | Breast | breast invasive carcinoma | Female | >=65 | I/II | Unknown | Unknown | SD |
| WNK1 | SNV | Missense_Mutation | rs756361196 | c.1726N>T | p.Arg576Trp | p.R576W | Q9H4A3 | protein_coding | deleterious(0) | probably_damaging(0.994) | TCGA-A7-A0CG-01 | Breast | breast invasive carcinoma | Female | >=65 | I/II | Unknown | Unknown | SD |
| WNK1 | SNV | Missense_Mutation | rs754884163 | c.2225A>C | p.His742Pro | p.H742P | Q9H4A3 | protein_coding | tolerated_low_confidence(0.23) | benign(0.062) | TCGA-A7-A4SB-01 | Breast | breast invasive carcinoma | Female | <65 | III/IV | Chemotherapy | docetaxel | CR |
| WNK1 | SNV | Missense_Mutation | c.2534N>A | p.Arg845His | p.R845H | Q9H4A3 | protein_coding | deleterious_low_confidence(0) | probably_damaging(0.957) | TCGA-A8-A09Z-01 | Breast | breast invasive carcinoma | Female | >=65 | I/II | Unknown | Unknown | SD | |
| WNK1 | SNV | Missense_Mutation | rs770856927 | c.5228N>T | p.Ser1743Leu | p.S1743L | Q9H4A3 | protein_coding | tolerated_low_confidence(0.07) | benign(0.077) | TCGA-A8-A0A7-01 | Breast | breast invasive carcinoma | Female | <65 | I/II | Unknown | Unknown | SD |
| WNK1 | SNV | Missense_Mutation | c.1162N>C | p.Glu388Gln | p.E388Q | Q9H4A3 | protein_coding | deleterious(0) | possibly_damaging(0.691) | TCGA-AC-A23H-01 | Breast | breast invasive carcinoma | Female | >=65 | I/II | Unknown | Unknown | PD | |
| WNK1 | SNV | Missense_Mutation | rs754884163 | c.2225A>C | p.His742Pro | p.H742P | Q9H4A3 | protein_coding | tolerated_low_confidence(0.23) | benign(0.062) | TCGA-AC-A3W5-01 | Breast | breast invasive carcinoma | Female | >=65 | I/II | Chemotherapy | docetaxel | CR |
| WNK1 | SNV | Missense_Mutation | novel | c.1121T>A | p.Leu374Gln | p.L374Q | Q9H4A3 | protein_coding | deleterious(0) | probably_damaging(0.995) | TCGA-AC-A6IV-01 | Breast | breast invasive carcinoma | Female | <65 | I/II | Unknown | Unknown | SD |
| WNK1 | SNV | Missense_Mutation | novel | c.6390N>C | p.Glu2130Asp | p.E2130D | Q9H4A3 | protein_coding | tolerated(0.08) | benign(0.437) | TCGA-AN-A046-01 | Breast | breast invasive carcinoma | Female | >=65 | I/II | Unknown | Unknown | SD |
| WNK1 | SNV | Missense_Mutation | novel | c.3457N>T | p.Pro1153Ser | p.P1153S | Q9H4A3 | protein_coding | deleterious_low_confidence(0) | probably_damaging(0.935) | TCGA-BH-A0B6-01 | Breast | breast invasive carcinoma | Female | <65 | I/II | Unknown | Unknown | SD |
| Page: 1 2 3 4 5 6 7 8 9 10 11 12 13 14 15 16 17 18 19 20 21 22 23 24 |
Top |
Related drugs of malignant transformation related genes |
| Identification of chemicals and drugs interact with genes involved in malignant transfromation |
| (DGIdb 4.0) |
| Entrez ID | Symbol | Category | Interaction Types | Drug Claim Name | Drug Name | PMIDs |
| 65125 | WNK1 | SERINE THREONINE KINASE, EXTERNAL SIDE OF PLASMA MEMBRANE, KINASE, DRUGGABLE GENOME, ENZYME | inhibitor | 252827493 | ||
| 65125 | WNK1 | SERINE THREONINE KINASE, EXTERNAL SIDE OF PLASMA MEMBRANE, KINASE, DRUGGABLE GENOME, ENZYME | hydrochlorothiazide | HYDROCHLOROTHIAZIDE | 18591455 |
| Page: 1 |

Copyright 2023-Present -The University of Texas Health Science Center at Houston |