
|
|||||
|
 | |
| |
| |
| |
| |
| |
|
Gene: PPP1R9A |
Gene summary for PPP1R9A |
| Gene information | Species | Human | Gene symbol | PPP1R9A | Gene ID | 55607 |
| Gene name | protein phosphatase 1 regulatory subunit 9A | |
| Gene Alias | NRB1 | |
| Cytomap | 7q21.3 | |
| Gene Type | protein-coding | GO ID | GO:0000902 | UniProtAcc | Q9ULJ8 |
Top |
Malignant transformation analysis |
| Identification of the aberrant gene expression in precancerous and cancerous lesions by comparing the gene expression of stem-like cells in diseased tissues with normal stem cells |
| Entrez ID | Symbol | Replicates | Species | Organ | Tissue | Adj P-value | Log2FC | Malignancy |
| 55607 | PPP1R9A | HTA11_3410_2000001011 | Human | Colorectum | AD | 4.57e-43 | -1.04e+00 | 0.0155 |
| 55607 | PPP1R9A | HTA11_2487_2000001011 | Human | Colorectum | SER | 9.62e-21 | -9.41e-01 | -0.1808 |
| 55607 | PPP1R9A | HTA11_2951_2000001011 | Human | Colorectum | AD | 1.64e-08 | -1.10e+00 | 0.0216 |
| 55607 | PPP1R9A | HTA11_1938_2000001011 | Human | Colorectum | AD | 5.97e-17 | -8.11e-01 | -0.0811 |
| 55607 | PPP1R9A | HTA11_78_2000001011 | Human | Colorectum | AD | 1.87e-03 | -5.13e-01 | -0.1088 |
| 55607 | PPP1R9A | HTA11_411_2000001011 | Human | Colorectum | SER | 9.70e-04 | -6.95e-01 | -0.2602 |
| 55607 | PPP1R9A | HTA11_2112_2000001011 | Human | Colorectum | SER | 9.28e-06 | -9.89e-01 | -0.2196 |
| 55607 | PPP1R9A | HTA11_3361_2000001011 | Human | Colorectum | AD | 3.79e-20 | -1.02e+00 | -0.1207 |
| 55607 | PPP1R9A | HTA11_83_2000001011 | Human | Colorectum | SER | 7.63e-13 | -8.61e-01 | -0.1526 |
| 55607 | PPP1R9A | HTA11_696_2000001011 | Human | Colorectum | AD | 1.06e-44 | -8.85e-01 | -0.1464 |
| 55607 | PPP1R9A | HTA11_866_2000001011 | Human | Colorectum | AD | 5.68e-30 | -8.07e-01 | -0.1001 |
| 55607 | PPP1R9A | HTA11_1391_2000001011 | Human | Colorectum | AD | 5.01e-21 | -7.86e-01 | -0.059 |
| 55607 | PPP1R9A | HTA11_2992_2000001011 | Human | Colorectum | SER | 9.24e-06 | -7.68e-01 | -0.1706 |
| 55607 | PPP1R9A | HTA11_5212_2000001011 | Human | Colorectum | AD | 1.49e-10 | -1.04e+00 | -0.2061 |
| 55607 | PPP1R9A | HTA11_5216_2000001011 | Human | Colorectum | SER | 1.04e-06 | -9.53e-01 | -0.1462 |
| 55607 | PPP1R9A | HTA11_546_2000001011 | Human | Colorectum | AD | 4.57e-06 | -7.02e-01 | -0.0842 |
| 55607 | PPP1R9A | HTA11_9341_2000001011 | Human | Colorectum | SER | 8.61e-04 | -9.77e-01 | -0.00410000000000005 |
| 55607 | PPP1R9A | HTA11_7862_2000001011 | Human | Colorectum | AD | 1.30e-07 | -7.81e-01 | -0.0179 |
| 55607 | PPP1R9A | HTA11_866_3004761011 | Human | Colorectum | AD | 3.35e-25 | -8.18e-01 | 0.096 |
| 55607 | PPP1R9A | HTA11_4255_2000001011 | Human | Colorectum | SER | 1.09e-06 | -9.25e-01 | 0.0446 |
| Page: 1 2 3 4 5 6 7 |
| Tissue | Expression Dynamics | Abbreviation |
| Colorectum (GSE201348) |  | FAP: Familial adenomatous polyposis |
| CRC: Colorectal cancer | ||
| Colorectum (HTA11) |  | AD: Adenomas |
| SER: Sessile serrated lesions | ||
| MSI-H: Microsatellite-high colorectal cancer | ||
| MSS: Microsatellite stable colorectal cancer | ||
| Endometrium | 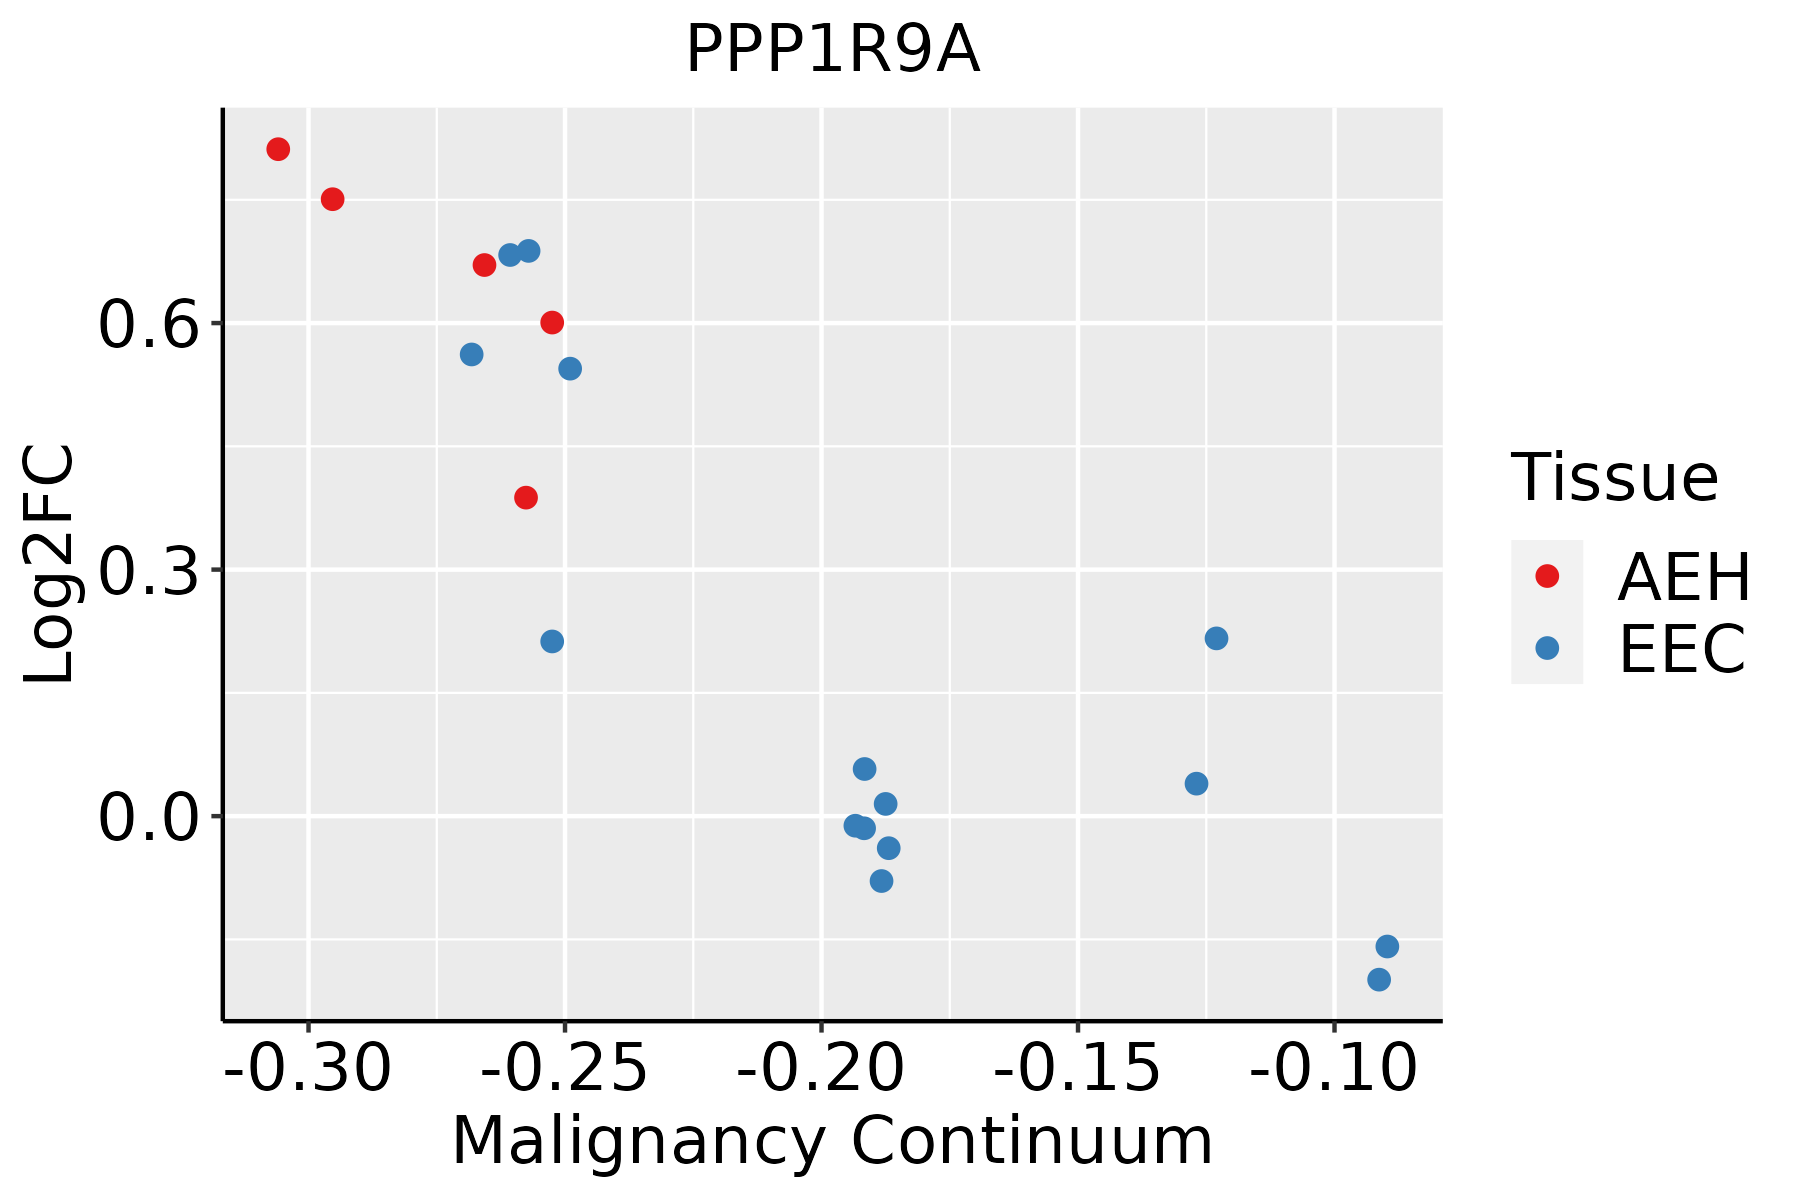 | AEH: Atypical endometrial hyperplasia |
| EEC: Endometrioid Cancer | ||
| Liver | 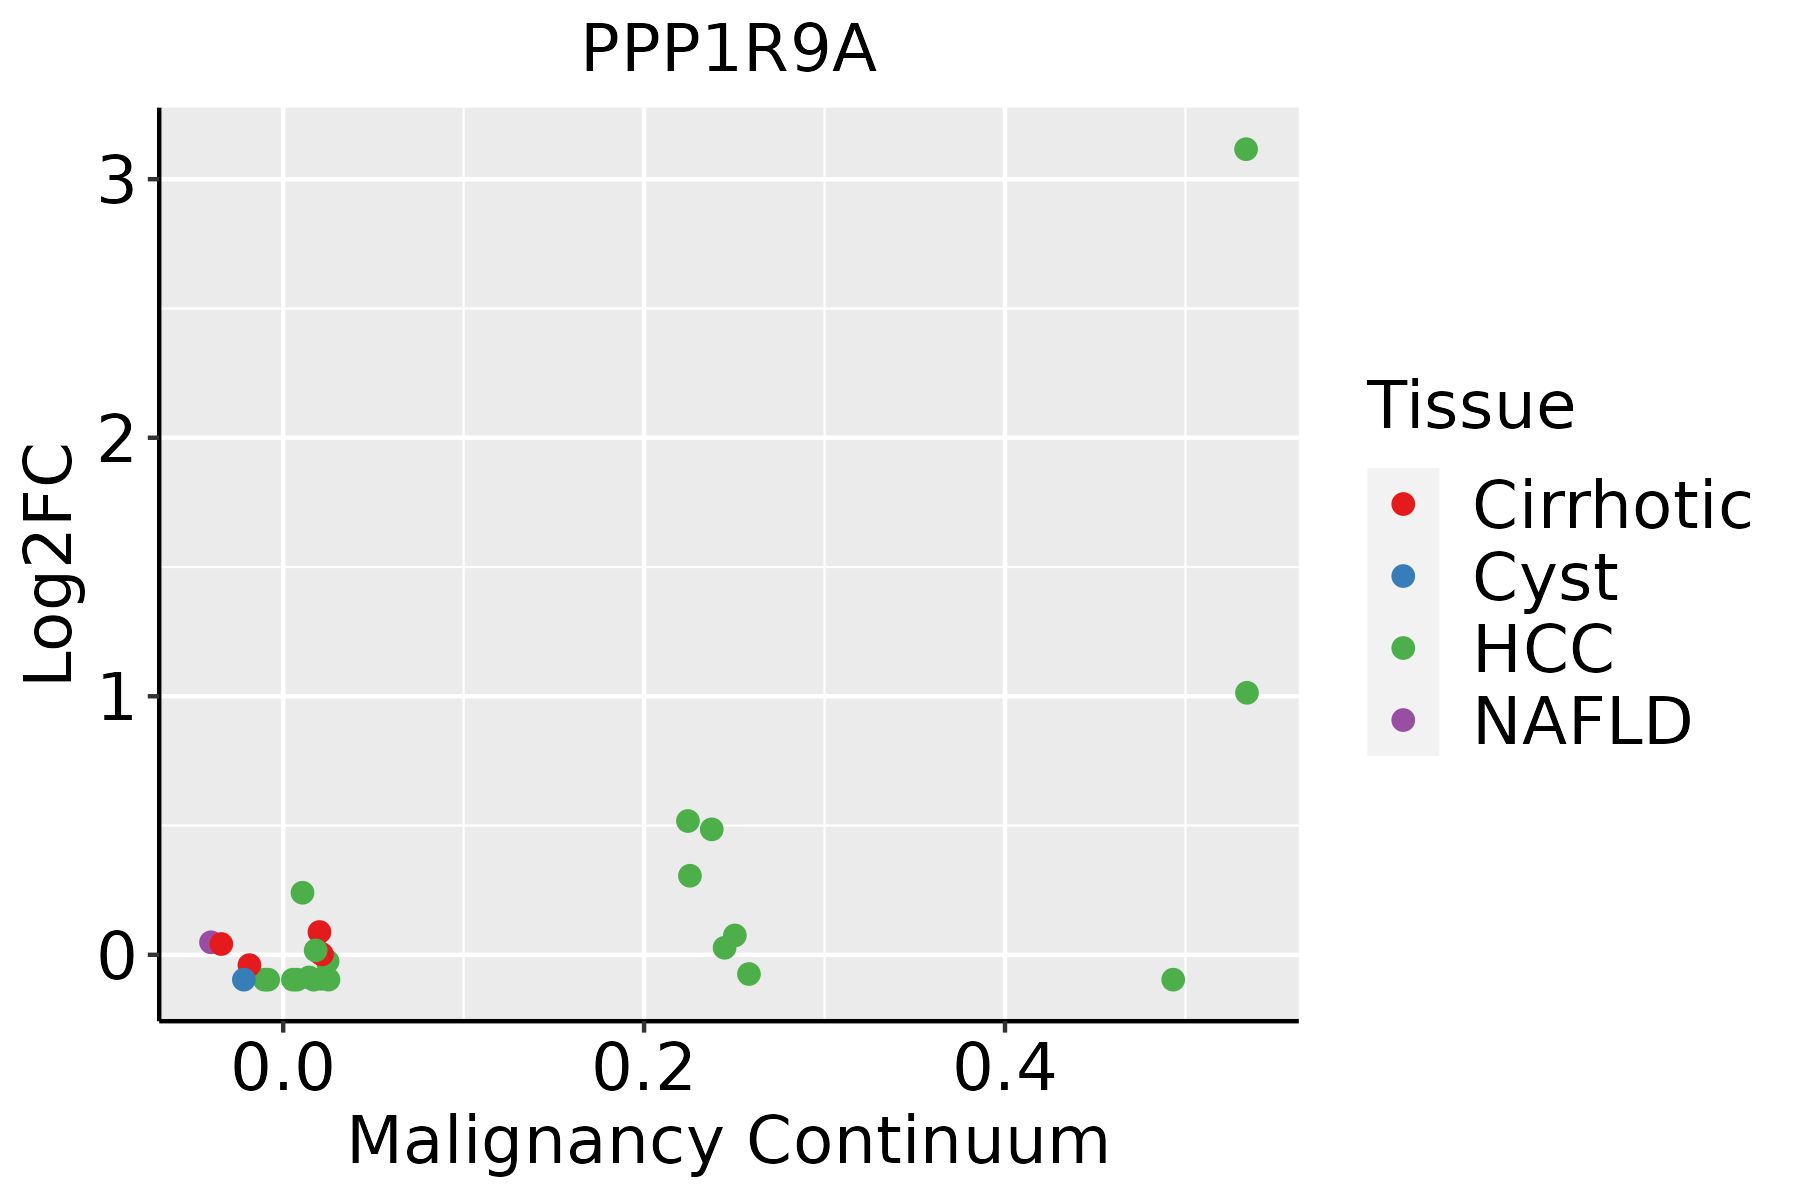 | HCC: Hepatocellular carcinoma |
| NAFLD: Non-alcoholic fatty liver disease | ||
| Lung | 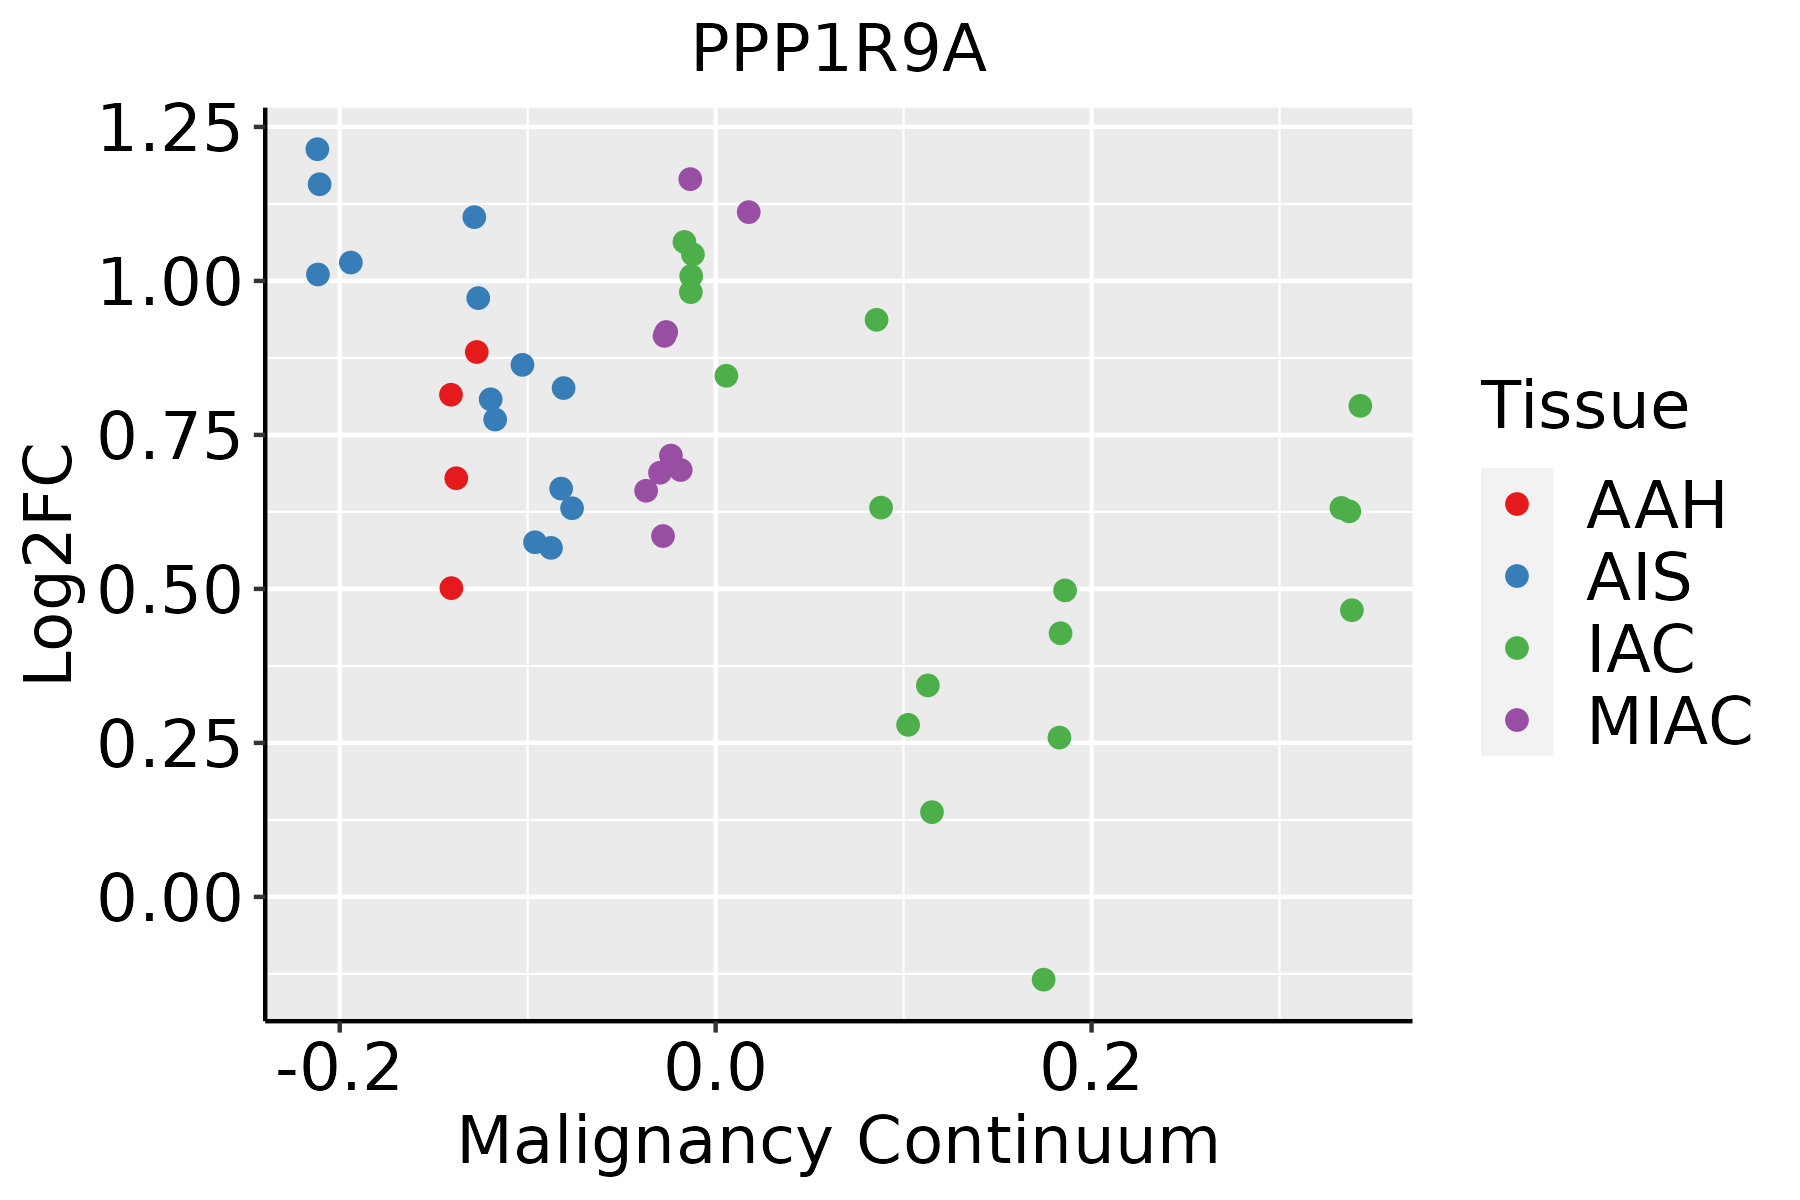 | AAH: Atypical adenomatous hyperplasia |
| AIS: Adenocarcinoma in situ | ||
| IAC: Invasive lung adenocarcinoma | ||
| MIA: Minimally invasive adenocarcinoma | ||
| Thyroid | 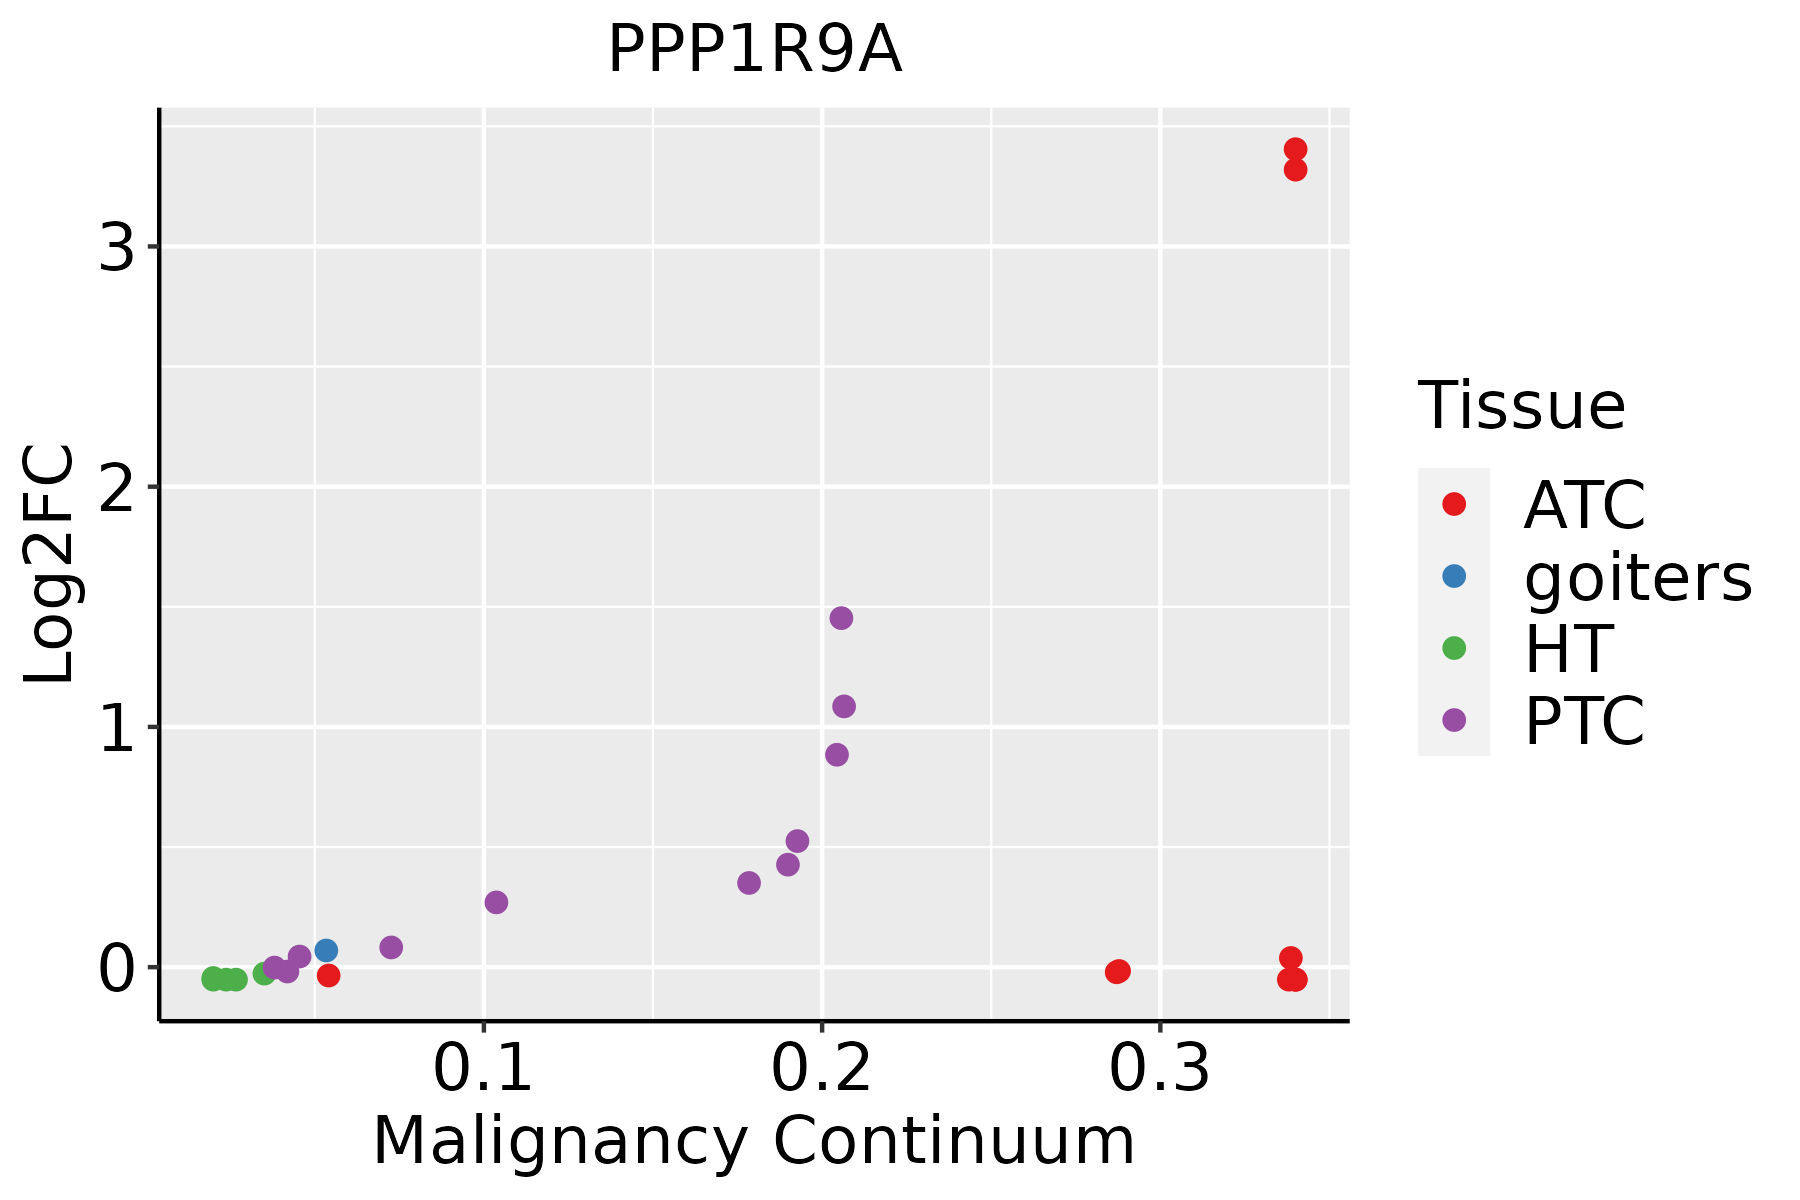 | ATC: Anaplastic thyroid cancer |
| HT: Hashimoto's thyroiditis | ||
| PTC: Papillary thyroid cancer |
| ∗log2FC in expression of this searched gene in stem-like cells from each diseased tissue sample relative to stem-like cells in normal samples in each tissue plotted against the malignancy continuum. Samples are colored based on if they are from different disease stage. |
Top |
Malignant transformation related pathway analysis |
| Find out the enriched GO biological processes and KEGG pathways involved in transition from healthy to precancer to cancer |
| Tissue | Disease Stage | Enriched GO biological Processes |
| Colorectum | AD |  |
| Colorectum | SER |  |
| Colorectum | MSS |  |
| Colorectum | MSI-H |  |
| Colorectum | FAP |  |
| ∗Top 15 enriched GO BP terms are showed in the bar plot of each disease state in each tissue. Each row represents a significant GO biological process which is colored according to the -log10(p.adjust). |
| Page: 1 2 3 4 5 6 7 8 9 |
| GO ID | Tissue | Disease Stage | Description | Gene Ratio | Bg Ratio | pvalue | p.adjust | Count |
| GO:005149228 | Thyroid | ATC | regulation of stress fiber assembly | 50/6293 | 91/18723 | 2.25e-05 | 2.00e-04 | 50 |
| GO:190290426 | Thyroid | ATC | negative regulation of supramolecular fiber organization | 82/6293 | 167/18723 | 2.35e-05 | 2.06e-04 | 82 |
| GO:006099815 | Thyroid | ATC | regulation of dendritic spine development | 36/6293 | 61/18723 | 4.10e-05 | 3.32e-04 | 36 |
| GO:000963634 | Thyroid | ATC | response to toxic substance | 119/6293 | 262/18723 | 4.30e-05 | 3.48e-04 | 119 |
| GO:010602716 | Thyroid | ATC | neuron projection organization | 50/6293 | 93/18723 | 4.87e-05 | 3.88e-04 | 50 |
| GO:011002028 | Thyroid | ATC | regulation of actomyosin structure organization | 53/6293 | 100/18723 | 4.92e-05 | 3.90e-04 | 53 |
| GO:00514892 | Thyroid | ATC | regulation of filopodium assembly | 29/6293 | 47/18723 | 7.37e-05 | 5.60e-04 | 29 |
| GO:004881315 | Thyroid | ATC | dendrite morphogenesis | 71/6293 | 146/18723 | 1.18e-04 | 8.38e-04 | 71 |
| GO:009706115 | Thyroid | ATC | dendritic spine organization | 45/6293 | 84/18723 | 1.27e-04 | 9.03e-04 | 45 |
| GO:190188818 | Thyroid | ATC | regulation of cell junction assembly | 94/6293 | 204/18723 | 1.38e-04 | 9.65e-04 | 94 |
| GO:006099911 | Thyroid | ATC | positive regulation of dendritic spine development | 26/6293 | 42/18723 | 1.60e-04 | 1.10e-03 | 26 |
| GO:009723733 | Thyroid | ATC | cellular response to toxic substance | 61/6293 | 124/18723 | 2.31e-04 | 1.49e-03 | 61 |
| GO:009917314 | Thyroid | ATC | postsynapse organization | 78/6293 | 168/18723 | 3.66e-04 | 2.26e-03 | 78 |
| GO:0051494110 | Thyroid | ATC | negative regulation of cytoskeleton organization | 76/6293 | 163/18723 | 3.68e-04 | 2.27e-03 | 76 |
| GO:00468472 | Thyroid | ATC | filopodium assembly | 34/6293 | 62/18723 | 4.66e-04 | 2.74e-03 | 34 |
| GO:006100114 | Thyroid | ATC | regulation of dendritic spine morphogenesis | 27/6293 | 47/18723 | 6.69e-04 | 3.77e-03 | 27 |
| GO:006099712 | Thyroid | ATC | dendritic spine morphogenesis | 33/6293 | 61/18723 | 7.76e-04 | 4.28e-03 | 33 |
| GO:009917512 | Thyroid | ATC | regulation of postsynapse organization | 44/6293 | 90/18723 | 1.89e-03 | 9.27e-03 | 44 |
| GO:005105114 | Thyroid | ATC | negative regulation of transport | 183/6293 | 470/18723 | 8.12e-03 | 3.13e-02 | 183 |
| GO:005080712 | Thyroid | ATC | regulation of synapse organization | 87/6293 | 211/18723 | 1.20e-02 | 4.27e-02 | 87 |
| Page: 1 2 3 4 5 6 7 8 9 10 11 12 13 14 15 16 17 18 19 20 21 22 23 24 25 26 27 28 29 30 31 32 |
| Pathway ID | Tissue | Disease Stage | Description | Gene Ratio | Bg Ratio | pvalue | p.adjust | qvalue | Count |
| Page: 1 |
Top |
Cell-cell communication analysis |
| Identification of potential cell-cell interactions between two cell types and their ligand-receptor pairs for different disease states |
| Ligand | Receptor | LRpair | Pathway | Tissue | Disease Stage |
| Page: 1 |
Top |
Single-cell gene regulatory network inference analysis |
| Find out the significant the regulons (TFs) and the target genes of each regulon across cell types for different disease states |
| TF | Cell Type | Tissue | Disease Stage | Target Gene | RSS | Regulon Activity |
| ∗The dot plots of a searched regulon are shown for all cell subpopulations in each disease state of each tissue based on the regulon specific score inferred using pySCENIC and by calculating the average expression. |
| Page: 1 |
Top |
Somatic mutation of malignant transformation related genes |
| Annotation of somatic variants for genes involved in malignant transformation |
| Hugo Symbol | Variant Class | Variant Classification | dbSNP RS | HGVSc | HGVSp | HGVSp Short | SWISSPROT | BIOTYPE | SIFT | PolyPhen | Tumor Sample Barcode | Tissue | Histology | Sex | Age | Stage | Therapy Types | Drugs | Outcome |
| PPP1R9A | SNV | Missense_Mutation | c.1574N>T | p.Ala525Val | p.A525V | Q9ULJ8 | protein_coding | deleterious(0) | probably_damaging(0.983) | TCGA-A2-A0YJ-01 | Breast | breast invasive carcinoma | Female | <65 | III/IV | Chemotherapy | cytoxan | PD | |
| PPP1R9A | SNV | Missense_Mutation | novel | c.4086G>T | p.Lys1362Asn | p.K1362N | Q9ULJ8 | protein_coding | deleterious_low_confidence(0) | benign(0.031) | TCGA-A2-A0YK-01 | Breast | breast invasive carcinoma | Female | <65 | I/II | Chemotherapy | cytoxan | SD |
| PPP1R9A | SNV | Missense_Mutation | novel | c.1435N>G | p.Asn479Asp | p.N479D | Q9ULJ8 | protein_coding | deleterious(0) | probably_damaging(0.995) | TCGA-A7-A13H-01 | Breast | breast invasive carcinoma | Female | <65 | I/II | Hormone Therapy | anastrozole | PD |
| PPP1R9A | SNV | Missense_Mutation | c.3736N>A | p.Asp1246Asn | p.D1246N | Q9ULJ8 | protein_coding | deleterious(0.03) | probably_damaging(0.989) | TCGA-A8-A094-01 | Breast | breast invasive carcinoma | Female | >=65 | I/II | Unknown | Unknown | SD | |
| PPP1R9A | SNV | Missense_Mutation | c.3711N>C | p.Leu1237Phe | p.L1237F | Q9ULJ8 | protein_coding | deleterious(0) | possibly_damaging(0.847) | TCGA-AO-A0JM-01 | Breast | breast invasive carcinoma | Female | <65 | I/II | Chemotherapy | doxorubicin | SD | |
| PPP1R9A | SNV | Missense_Mutation | novel | c.916N>C | p.Ser306Pro | p.S306P | Q9ULJ8 | protein_coding | tolerated(0.19) | benign(0.001) | TCGA-B6-A0RS-01 | Breast | breast invasive carcinoma | Female | <65 | I/II | Unknown | Unknown | PD |
| PPP1R9A | SNV | Missense_Mutation | novel | c.1534N>T | p.Asp512Tyr | p.D512Y | Q9ULJ8 | protein_coding | deleterious(0) | probably_damaging(0.989) | TCGA-BH-A1F0-01 | Breast | breast invasive carcinoma | Female | >=65 | I/II | Unknown | Unknown | PD |
| PPP1R9A | SNV | Missense_Mutation | c.3338N>A | p.Cys1113Tyr | p.C1113Y | Q9ULJ8 | protein_coding | tolerated(0.16) | benign(0) | TCGA-E9-A1NC-01 | Breast | breast invasive carcinoma | Female | <65 | I/II | Chemotherapy | doxorubicin | CR | |
| PPP1R9A | SNV | Missense_Mutation | novel | c.844G>C | p.Val282Leu | p.V282L | Q9ULJ8 | protein_coding | tolerated(0.25) | benign(0.03) | TCGA-E9-A1RH-01 | Breast | breast invasive carcinoma | Female | <65 | I/II | Chemotherapy | 5-fluorouracil | SD |
| PPP1R9A | SNV | Missense_Mutation | c.643N>A | p.Pro215Thr | p.P215T | Q9ULJ8 | protein_coding | tolerated(0.43) | benign(0.049) | TCGA-EW-A1J6-01 | Breast | breast invasive carcinoma | Female | >=65 | I/II | Hormone Therapy | femara | SD |
| Page: 1 2 3 4 5 6 7 8 9 10 11 12 13 14 15 16 17 |
Top |
Related drugs of malignant transformation related genes |
| Identification of chemicals and drugs interact with genes involved in malignant transfromation |
| (DGIdb 4.0) |
| Entrez ID | Symbol | Category | Interaction Types | Drug Claim Name | Drug Name | PMIDs |
| Page: 1 |

Copyright 2023-Present -The University of Texas Health Science Center at Houston |