Schematic overview of the cellular and molecular mechanisms involved in the cancer progression, including the proposed cellular and molecular mechanisms in cancer cells trajectory. AT1: alveolar type 1 cells; AT2: alveolar type 2 cells; AAH: atypical adenomatous hyperplasia; AIS: adenocarcinoma in situ; MIA: minimally invasive adenocarcinoma; IA: invasive adenocarcinoma; EMT: epithelial-mesenchymal transition

Home

Download

Statistics

Help

Contact

Center for Computational Systems Medicine
leaf

Gene summary

leaf

Malignant transformation analysis

leaf

Malignant transformation related pathway analysis

leaf

Cell-cell communication analysis

leaf

Single-cell gene regulatory network inference analysis

leaf

Somatic mutation of malignant transformation related genes

leaf

Related drugs of malignant transformation related genes

Gene: NOL3

Gene summary for NOL3

check button Gene summary.

Gene informationSpeciesHuman
Gene symbol

NOL3

Gene ID

8996

Gene namenucleolar protein 3
Gene AliasARC
Cytomap16q22.1
Gene Typeprotein-coding
GO ID

GO:0000245

UniProtAcc

O60936


Top

Malignant transformation analysis

check button Identification of the aberrant gene expression in precancerous and cancerous lesions by comparing the gene expression of stem-like cells in diseased tissues with normal stem cells
check button Malignant transformation involving gene list.
Entrez IDSymbolReplicatesSpeciesOrganTissueAdj P-valueLog2FCMalignancy
8996NOL3GSM4909291HumanBreastIDC6.77e-063.74e-010.1753
8996NOL3GSM4909296HumanBreastIDC3.20e-052.85e-010.1524
8996NOL3GSM4909311HumanBreastIDC8.04e-074.59e-020.1534
8996NOL3GSM4909315HumanBreastIDC7.07e-205.64e-010.21
8996NOL3GSM4909316HumanBreastIDC2.12e-085.93e-010.21
8996NOL3GSM4909319HumanBreastIDC1.27e-077.76e-020.1563
8996NOL3GSM4909321HumanBreastIDC4.22e-236.18e-010.1559
8996NOL3brca3HumanBreastPrecancer2.98e-092.94e-01-0.0263
8996NOL3DCIS2HumanBreastDCIS3.91e-371.58e-010.0085
8996NOL3LZE4THumanEsophagusESCC1.66e-175.18e-010.0811
8996NOL3LZE5THumanEsophagusESCC4.79e-044.39e-010.0514
8996NOL3LZE7THumanEsophagusESCC3.06e-095.68e-010.0667
8996NOL3LZE8THumanEsophagusESCC1.16e-052.24e-010.067
8996NOL3LZE20THumanEsophagusESCC1.80e-072.80e-010.0662
8996NOL3LZE22D1HumanEsophagusHGIN2.26e-052.40e-010.0595
8996NOL3LZE24THumanEsophagusESCC7.21e-041.26e-010.0596
8996NOL3LZE21THumanEsophagusESCC2.22e-032.93e-010.0655
8996NOL3P1T-EHumanEsophagusESCC2.49e-155.62e-010.0875
8996NOL3P2T-EHumanEsophagusESCC7.69e-112.73e-010.1177
8996NOL3P4T-EHumanEsophagusESCC2.52e-337.94e-010.1323
Page: 1 2 3 4 5 6 

check button Transcriptomic changes along malignancy continuum.
TissueExpression DynamicsAbbreviation
BreastThe image shows the transcriptomic changes along malignancy continuum.log2FC in expression of this searched gene in stem-like cells from each diseased tissue sample relative to stem-like cells in normal samples in each tissue plotted against the malignancy continuum. Samples are colored based on if they are from different disease stage.
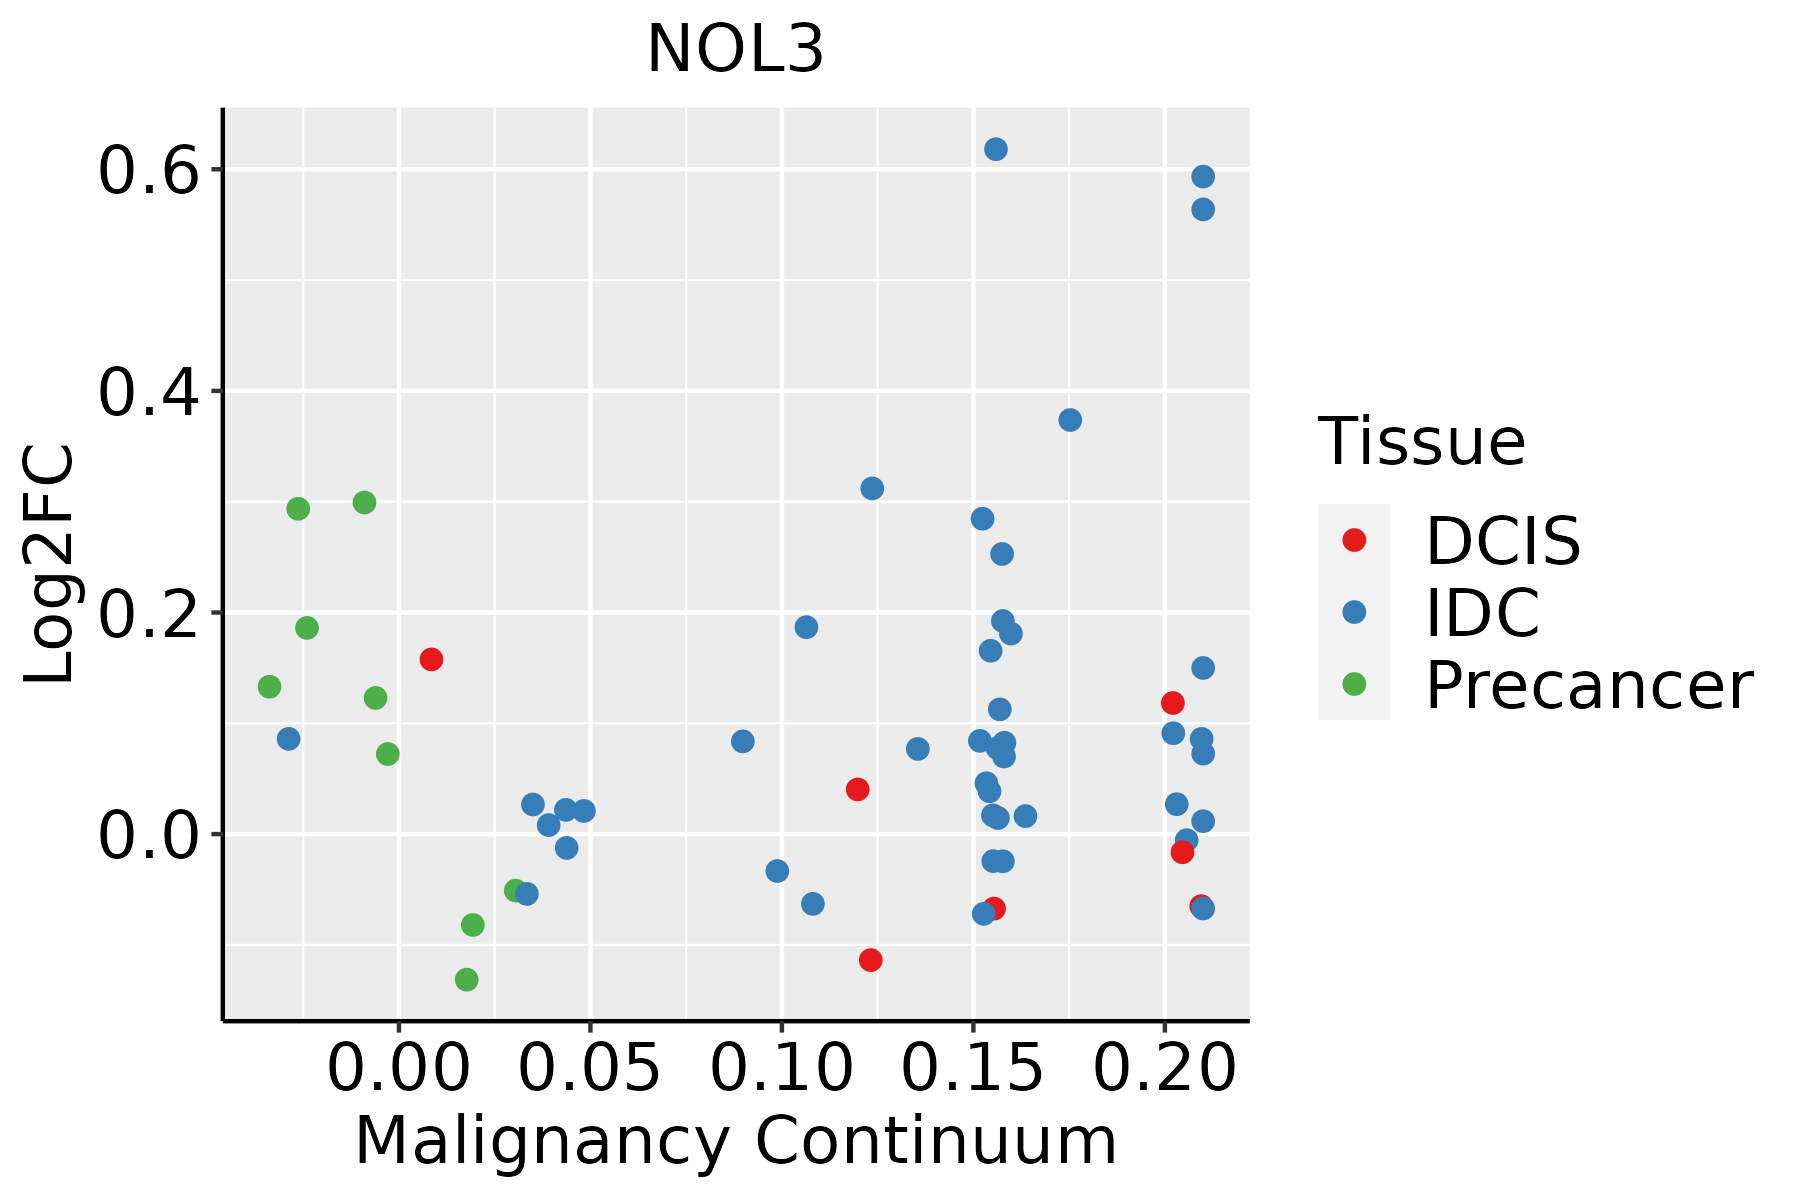
IDC: Invasive ductal carcinoma
DCIS: Ductal carcinoma in situ
Precancer(BRCA1-mut): Precancerous lesion from BRCA1 mutation carriers
EsophagusThe image shows the transcriptomic changes along malignancy continuum.log2FC in expression of this searched gene in stem-like cells from each diseased tissue sample relative to stem-like cells in normal samples in each tissue plotted against the malignancy continuum. Samples are colored based on if they are from different disease stage.
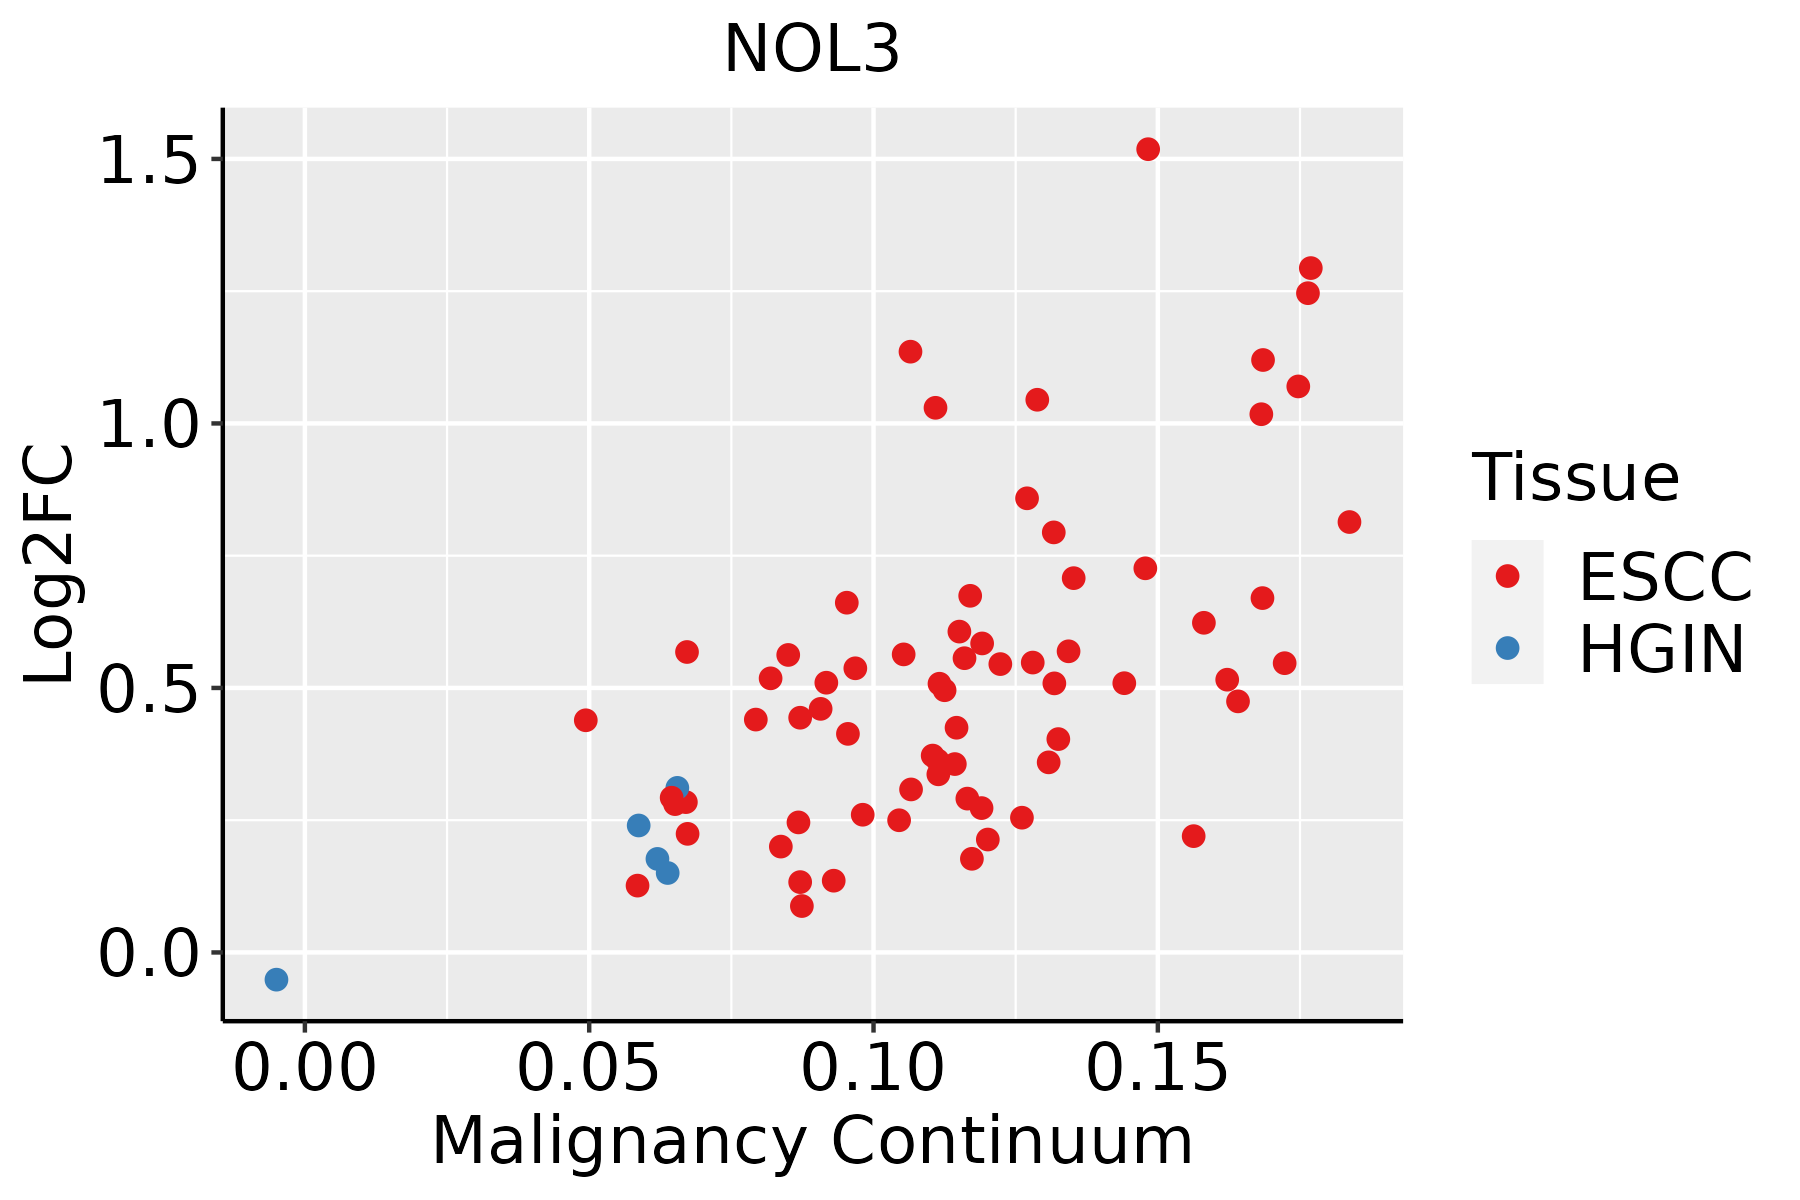
ESCC: Esophageal squamous cell carcinoma
HGIN: High-grade intraepithelial neoplasias
LGIN: Low-grade intraepithelial neoplasias
LiverThe image shows the transcriptomic changes along malignancy continuum.log2FC in expression of this searched gene in stem-like cells from each diseased tissue sample relative to stem-like cells in normal samples in each tissue plotted against the malignancy continuum. Samples are colored based on if they are from different disease stage.
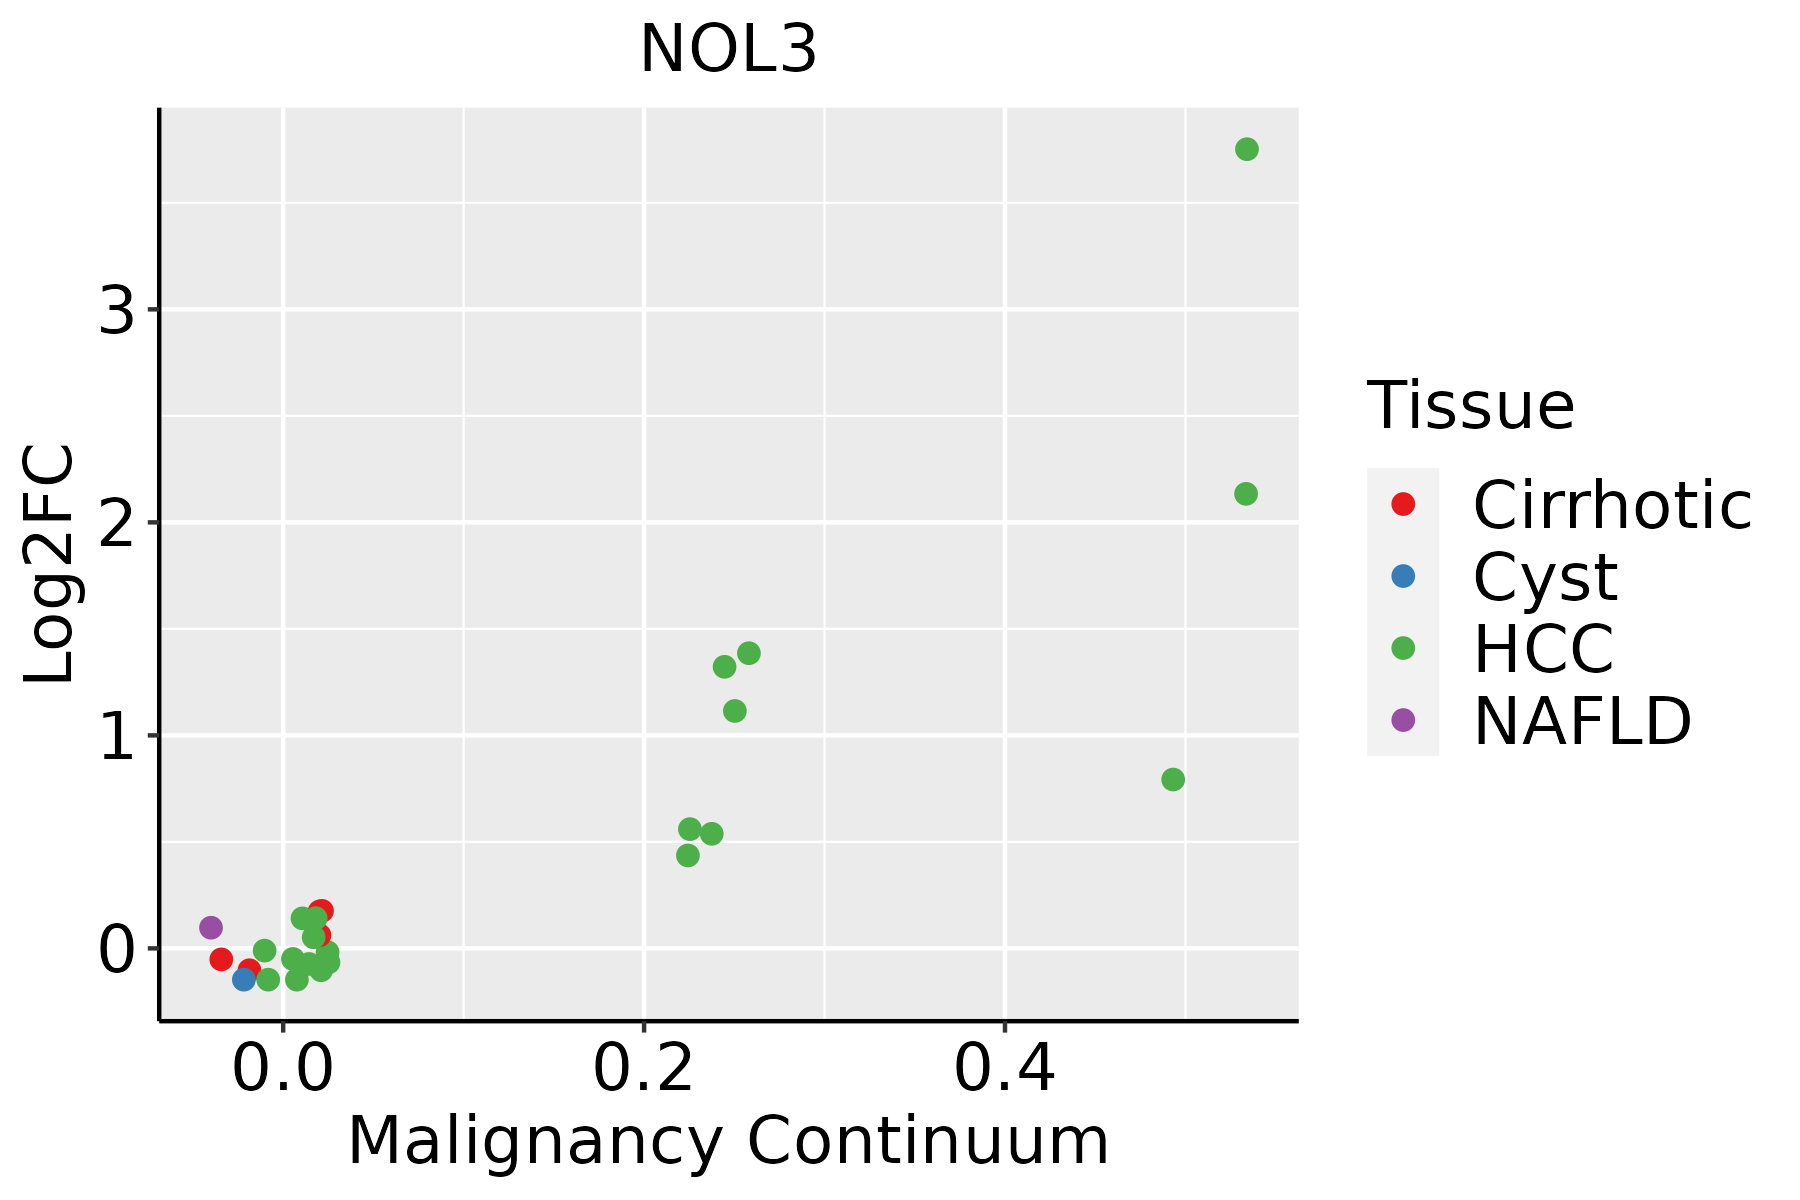
HCC: Hepatocellular carcinoma
NAFLD: Non-alcoholic fatty liver disease
Oral CavityThe image shows the transcriptomic changes along malignancy continuum.log2FC in expression of this searched gene in stem-like cells from each diseased tissue sample relative to stem-like cells in normal samples in each tissue plotted against the malignancy continuum. Samples are colored based on if they are from different disease stage.
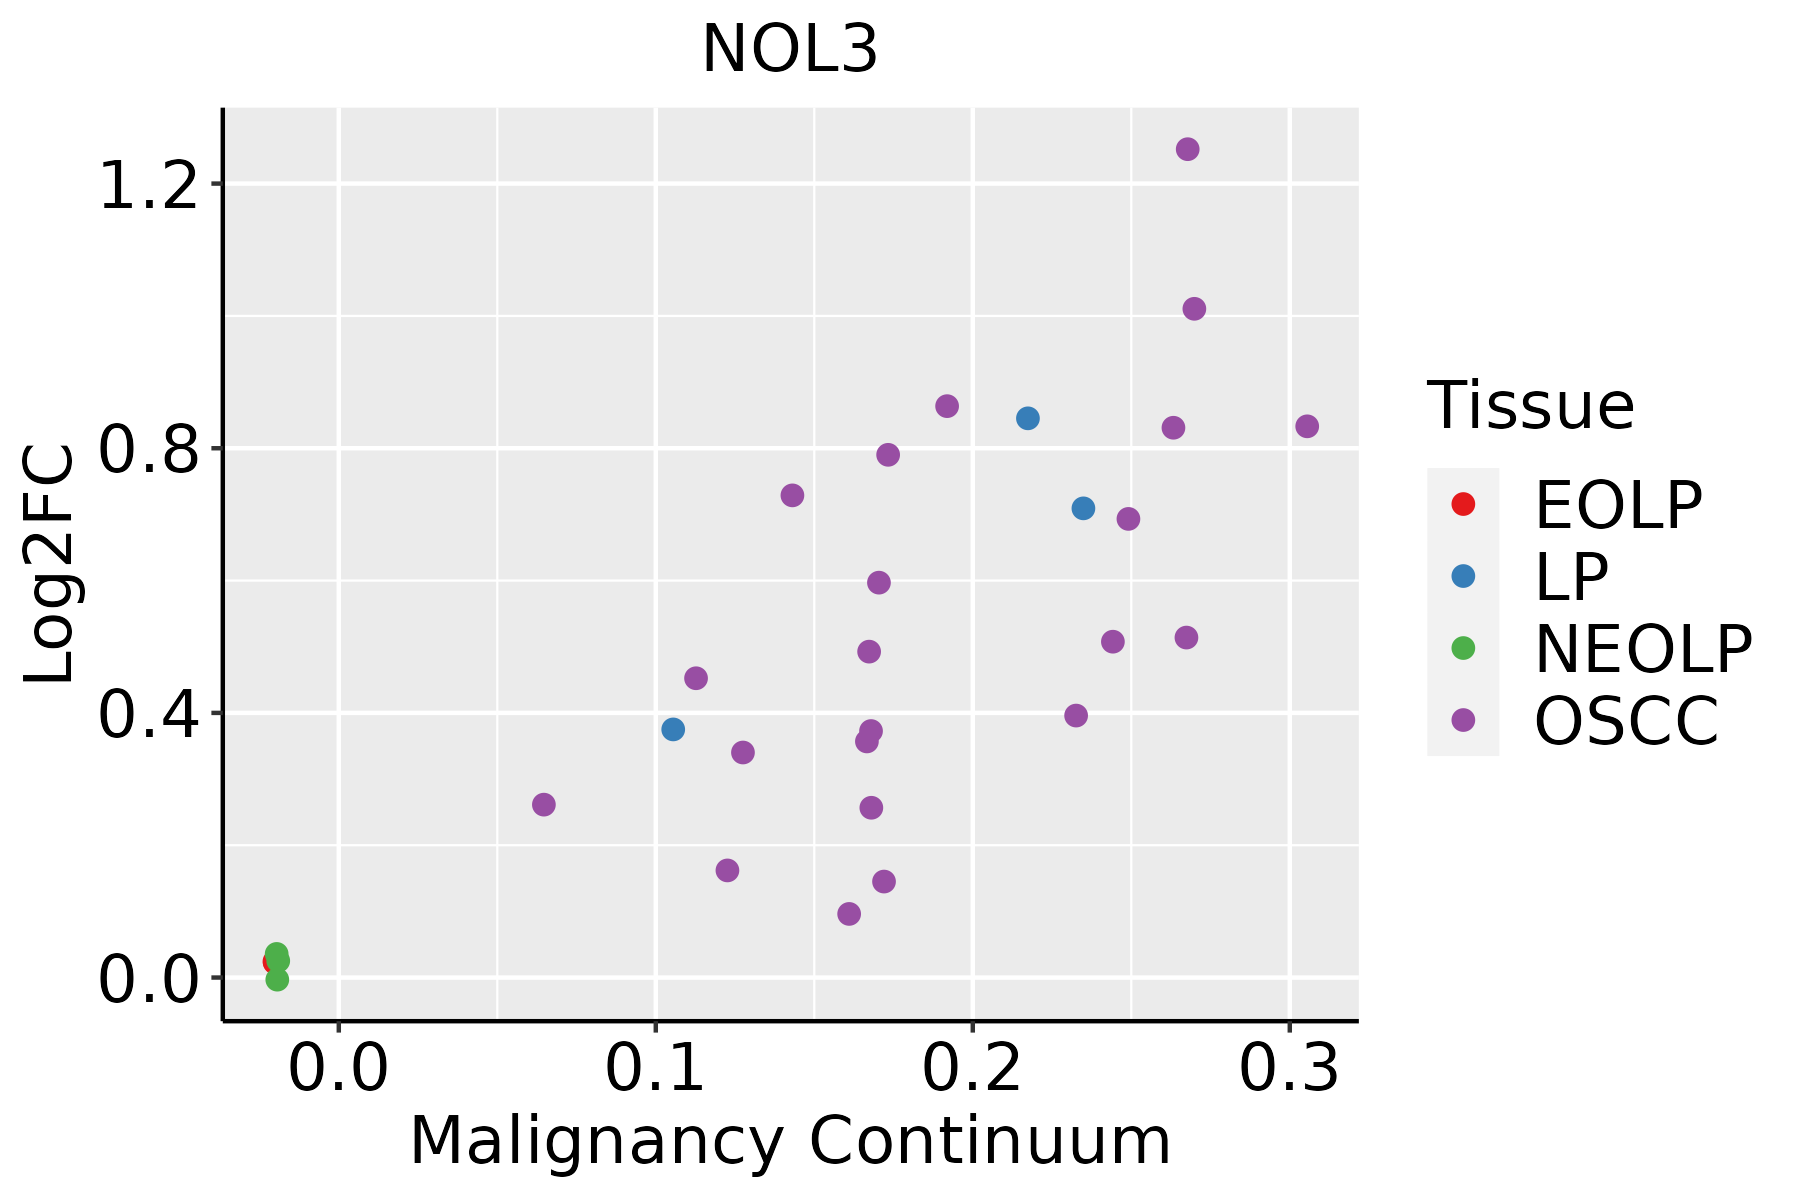
EOLP: Erosive Oral lichen planus
LP: leukoplakia
NEOLP: Non-erosive oral lichen planus
OSCC: Oral squamous cell carcinoma
SkinThe image shows the transcriptomic changes along malignancy continuum.log2FC in expression of this searched gene in stem-like cells from each diseased tissue sample relative to stem-like cells in normal samples in each tissue plotted against the malignancy continuum. Samples are colored based on if they are from different disease stage.AK: Actinic keratosis
cSCC: Cutaneous squamous cell carcinoma
SCCIS:squamous cell carcinoma in situ
∗log2FC in expression of this searched gene in stem-like cells from each diseased tissue sample relative to stem-like cells in normal samples in each tissue plotted against the malignancy continuum. Samples are colored based on if they are from different disease stage.

Top

Malignant transformation related pathway analysis

check buttonFind out the enriched GO biological processes and KEGG pathways involved in transition from healthy to precancer to cancer
check button Figure of enriched GO biological processes.
TissueDisease StageEnriched GO biological Processes
ColorectumADGO analysis - Figure of enriched GO biological processes: Top 15 enriched GO BP terms are showed in the bar plot of each disease state in each tissue. Each row represents a significant GO biological process which is colored according to the -log10(p.adjust).
ColorectumSERGO analysis - Figure of enriched GO biological processes: Top 15 enriched GO BP terms are showed in the bar plot of each disease state in each tissue. Each row represents a significant GO biological process which is colored according to the -log10(p.adjust).
ColorectumMSSGO analysis - Figure of enriched GO biological processes: Top 15 enriched GO BP terms are showed in the bar plot of each disease state in each tissue. Each row represents a significant GO biological process which is colored according to the -log10(p.adjust).
ColorectumMSI-HGO analysis - Figure of enriched GO biological processes: Top 15 enriched GO BP terms are showed in the bar plot of each disease state in each tissue. Each row represents a significant GO biological process which is colored according to the -log10(p.adjust).
ColorectumFAPGO analysis - Figure of enriched GO biological processes: Top 15 enriched GO BP terms are showed in the bar plot of each disease state in each tissue. Each row represents a significant GO biological process which is colored according to the -log10(p.adjust).
∗Top 15 enriched GO BP terms are showed in the bar plot of each disease state in each tissue. Each row represents a significant GO biological process which is colored according to the -log10(p.adjust).
Page: 1 2 3 4 5 6 7 8 9 

check button Enriched GO biological processes.
GO IDTissueDisease StageDescriptionGene RatioBg Ratiopvaluep.adjustCount
GO:009055917SkincSCCregulation of membrane permeability35/486478/187232.32e-041.91e-0335
GO:001082317SkincSCCnegative regulation of mitochondrion organization24/486449/187234.54e-043.47e-0324
GO:0071453111SkincSCCcellular response to oxygen levels66/4864177/187235.79e-044.21e-0366
GO:001095125SkincSCCnegative regulation of endopeptidase activity89/4864252/187236.05e-044.38e-0389
GO:001046626SkincSCCnegative regulation of peptidase activity91/4864262/187239.73e-046.58e-0391
GO:003461226SkincSCCresponse to tumor necrosis factor88/4864253/187231.11e-037.31e-0388
GO:190217617SkincSCCnegative regulation of oxidative stress-induced intrinsic apoptotic signaling pathway12/486420/187231.34e-038.54e-0312
GO:00164858SkincSCCprotein processing79/4864225/187231.43e-039.02e-0379
GO:003320915SkincSCCtumor necrosis factor-mediated signaling pathway39/486499/187232.33e-031.36e-0239
GO:007135625SkincSCCcellular response to tumor necrosis factor79/4864229/187232.48e-031.42e-0279
GO:007145617SkincSCCcellular response to hypoxia55/4864151/187232.88e-031.61e-0255
GO:200123727SkincSCCnegative regulation of extrinsic apoptotic signaling pathway38/486497/187232.95e-031.64e-0238
GO:0036294111SkincSCCcellular response to decreased oxygen levels58/4864161/187233.00e-031.66e-0258
GO:00063765SkincSCCmRNA splice site selection22/486449/187233.18e-031.74e-0222
GO:00380616SkincSCCNIK/NF-kappaB signaling52/4864143/187233.83e-032.05e-0252
GO:1903201110SkincSCCregulation of oxidative stress-induced cell death30/486474/187234.32e-032.27e-0230
GO:19012225SkincSCCregulation of NIK/NF-kappaB signaling42/4864112/187234.71e-032.40e-0242
GO:005123527SkincSCCmaintenance of location106/4864327/187235.17e-032.61e-02106
GO:19021087SkincSCCregulation of mitochondrial membrane permeability involved in apoptotic process20/486445/187235.54e-032.74e-0220
GO:00607596SkincSCCregulation of response to cytokine stimulus57/4864162/187235.77e-032.85e-0257
Page: 1 2 3 4 5 6 7 8 9 10 11 12 13 14 15 16 17 18 19 20 21 22 23 24 25 26 27 28 29 30 31 32 33 

check button Enriched KEGG pathways.
Pathway IDTissueDisease StageDescriptionGene RatioBg Ratiopvaluep.adjustqvalueCount
Page: 1 

Top

Cell-cell communication analysis

check buttonIdentification of potential cell-cell interactions between two cell types and their ligand-receptor pairs for different disease states
LigandReceptorLRpairPathwayTissueDisease Stage
Page: 1 

Top

Single-cell gene regulatory network inference analysis

check buttonFind out the significant the regulons (TFs) and the target genes of each regulon across cell types for different disease states
TFCell TypeTissueDisease StageTarget GeneRSSRegulon Activity
∗The dot plots of a searched regulon are shown for all cell subpopulations in each disease state of each tissue based on the regulon specific score inferred using pySCENIC and by calculating the average expression.
Page: 1 

Top

Somatic mutation of malignant transformation related genes

check buttonAnnotation of somatic variants for genes involved in malignant transformation
Hugo SymbolVariant ClassVariant ClassificationdbSNP RSHGVScHGVSpHGVSp ShortSWISSPROTBIOTYPESIFTPolyPhenTumor Sample BarcodeTissueHistologySexAgeStageTherapy TypesDrugsOutcome
NOL3SNVMissense_Mutationc.343N>Cp.Asp115Hisp.D115HO60936protein_codingdeleterious_low_confidence(0)probably_damaging(0.966)TCGA-IR-A3LI-01Cervixcervical & endocervical cancerFemale<65I/IIChemotherapycisplatinCR
NOL3SNVMissense_Mutationnovelc.60N>Cp.Gln20Hisp.Q20HO60936protein_codingbenign(0.187)TCGA-JW-A5VL-01Cervixcervical & endocervical cancerFemale<65I/IIUnknownUnknownSD
NOL3SNVMissense_Mutationnovelc.604G>Ap.Glu202Lysp.E202KO60936protein_codingdeleterious_low_confidence(0.01)possibly_damaging(0.516)TCGA-XS-A8TJ-01Cervixcervical & endocervical cancerFemale<65I/IIChemotherapycisplatinSD
NOL3SNVMissense_Mutationnovelc.299N>Tp.Gly100Valp.G100VO60936protein_codingdeleterious_low_confidence(0)probably_damaging(0.991)TCGA-BG-A222-01Endometriumuterine corpus endometrioid carcinomaFemale<65I/IIUnknownUnknownSD
NOL3SNVMissense_Mutationrs528140604c.635N>Tp.Pro212Leup.P212LO60936protein_codingtolerated_low_confidence(0.31)benign(0)TCGA-DF-A2KN-01Endometriumuterine corpus endometrioid carcinomaFemaleUnknownI/IIUnknownUnknownSD
NOL3insertionFrame_Shift_Insnovelc.190_191insCp.Gly64AlafsTer52p.G64Afs*52O60936protein_codingTCGA-AP-A0LH-01Endometriumuterine corpus endometrioid carcinomaFemale<65I/IIChemotherapypaclitaxelPD
NOL3SNVMissense_Mutationnovelc.796G>Ap.Glu266Lysp.E266KO60936protein_codingdeleterious_low_confidence(0)benign(0.042)TCGA-CV-7097-01Oral cavityhead & neck squamous cell carcinomaMale<65I/IIUnknownUnknownPD
NOL3SNVMissense_Mutationc.514N>Ap.Pro172Thrp.P172TO60936protein_codingtolerated_low_confidence(0.08)benign(0.025)TCGA-D7-A4YY-01Stomachstomach adenocarcinomaMale<65III/IVChemotherapy5-fluorouracilSD
NOL3SNVMissense_Mutationrs547594151c.259G>Ap.Ala87Thrp.A87TO60936protein_codingtolerated_low_confidence(0.25)benign(0.196)TCGA-HU-A4G8-01Stomachstomach adenocarcinomaFemale>=65I/IIChemotherapy5-fluorouracilSD
Page: 1 

Top

Related drugs of malignant transformation related genes

check buttonIdentification of chemicals and drugs interact with genes involved in malignant transfromation
(DGIdb 4.0)
Entrez IDSymbolCategoryInteraction TypesDrug Claim NameDrug NamePMIDs
Page: 1