
|
|||||
|
 | |
| |
| |
| |
| |
| |
|
Gene: MAL |
Gene summary for MAL |
| Gene information | Species | Human | Gene symbol | MAL | Gene ID | 4118 |
| Gene name | mal, T cell differentiation protein | |
| Gene Alias | MVP17 | |
| Cytomap | 2q11.1 | |
| Gene Type | protein-coding | GO ID | GO:0001766 | UniProtAcc | A0A024RE19 |
Top |
Malignant transformation analysis |
| Identification of the aberrant gene expression in precancerous and cancerous lesions by comparing the gene expression of stem-like cells in diseased tissues with normal stem cells |
| Entrez ID | Symbol | Replicates | Species | Organ | Tissue | Adj P-value | Log2FC | Malignancy |
| 4118 | MAL | P23T-E | Human | Esophagus | ESCC | 4.29e-11 | 8.19e-01 | 0.108 |
| 4118 | MAL | P128T-E | Human | Esophagus | ESCC | 3.99e-07 | 9.11e-01 | 0.1241 |
| 4118 | MAL | S014 | Human | Liver | HCC | 1.15e-08 | 7.37e-01 | 0.2254 |
| 4118 | MAL | S015 | Human | Liver | HCC | 2.71e-07 | 8.24e-01 | 0.2375 |
| 4118 | MAL | S016 | Human | Liver | HCC | 7.18e-17 | 1.19e+00 | 0.2243 |
| 4118 | MAL | C43 | Human | Oral cavity | OSCC | 7.87e-03 | -1.70e-01 | 0.1704 |
| 4118 | MAL | LN22 | Human | Oral cavity | OSCC | 5.83e-06 | 2.19e+00 | 0.1733 |
| 4118 | MAL | SYSMH4 | Human | Oral cavity | OSCC | 4.35e-08 | 1.01e-01 | 0.1226 |
| Page: 1 |
| Tissue | Expression Dynamics | Abbreviation |
| Esophagus | 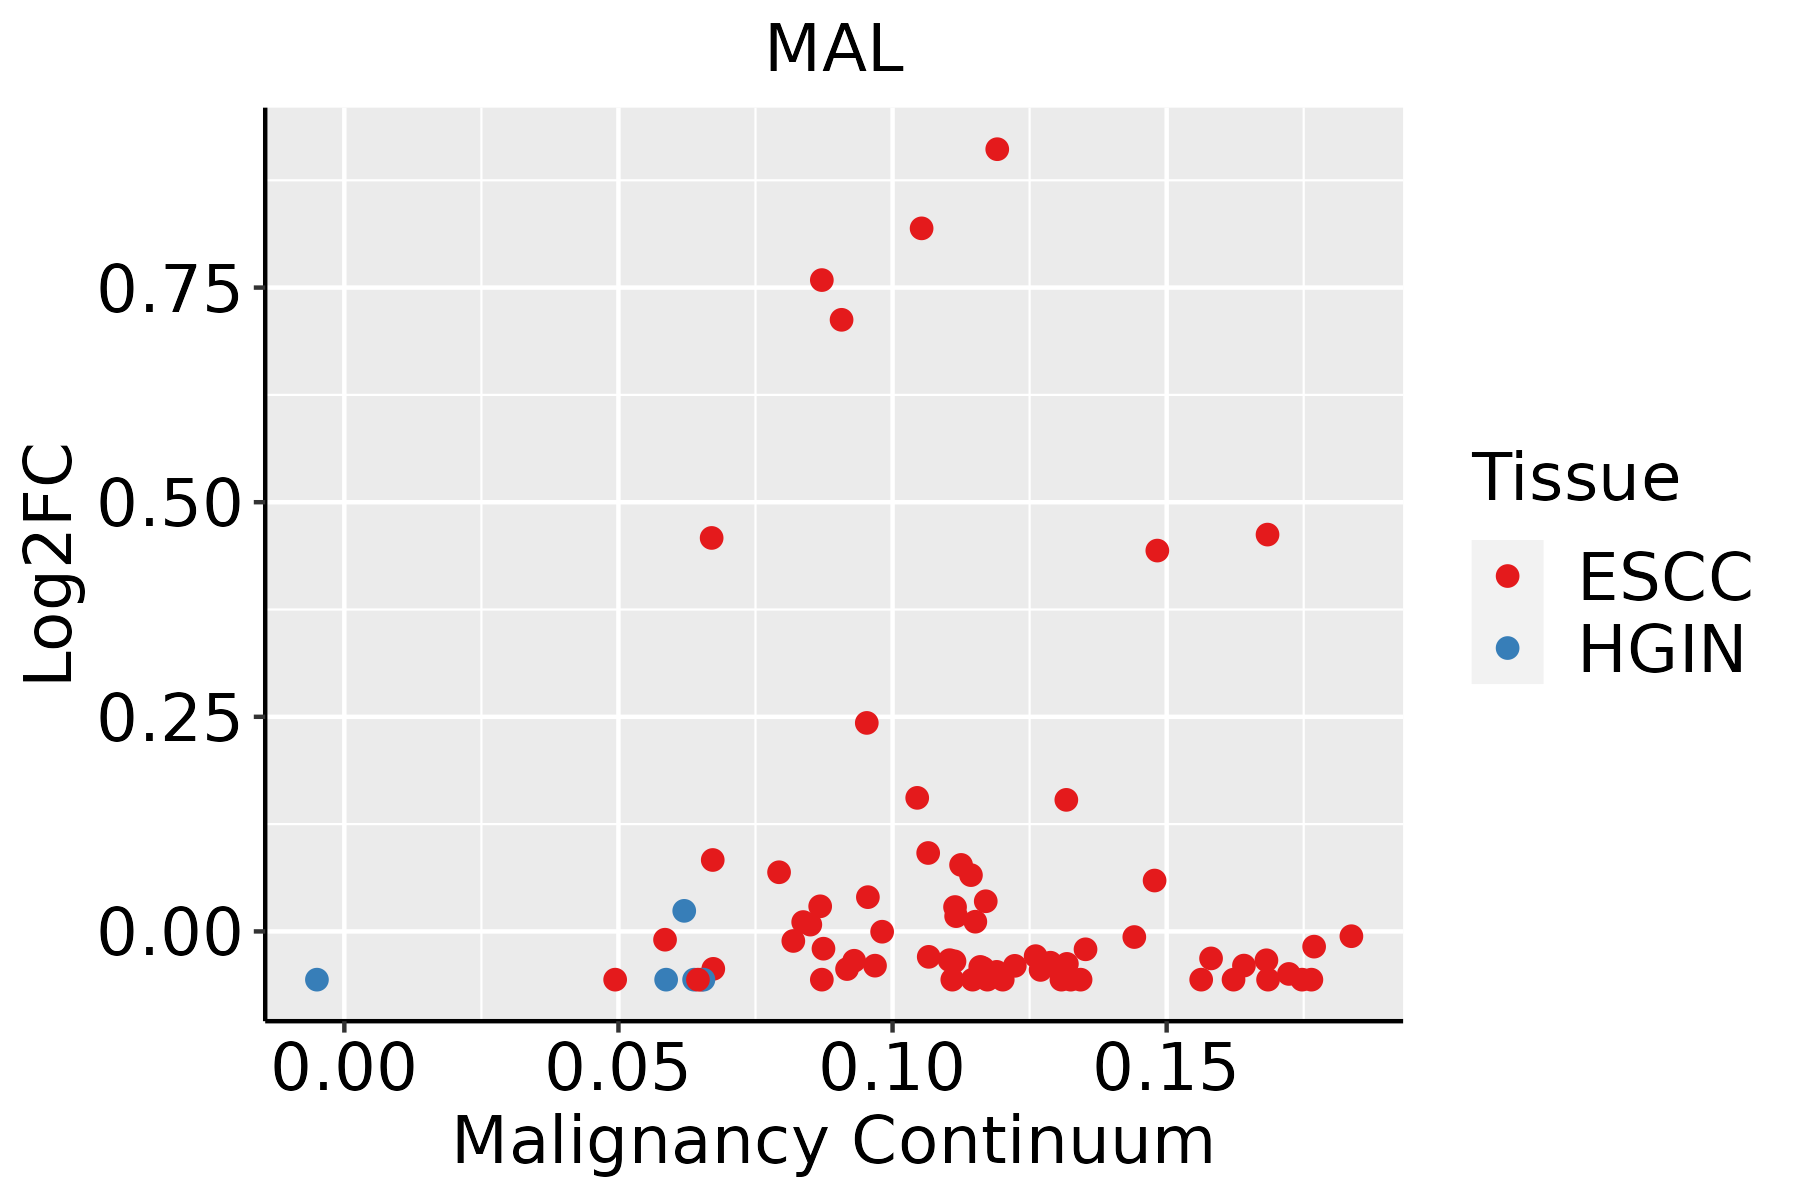 | ESCC: Esophageal squamous cell carcinoma |
| HGIN: High-grade intraepithelial neoplasias | ||
| LGIN: Low-grade intraepithelial neoplasias | ||
| Liver | 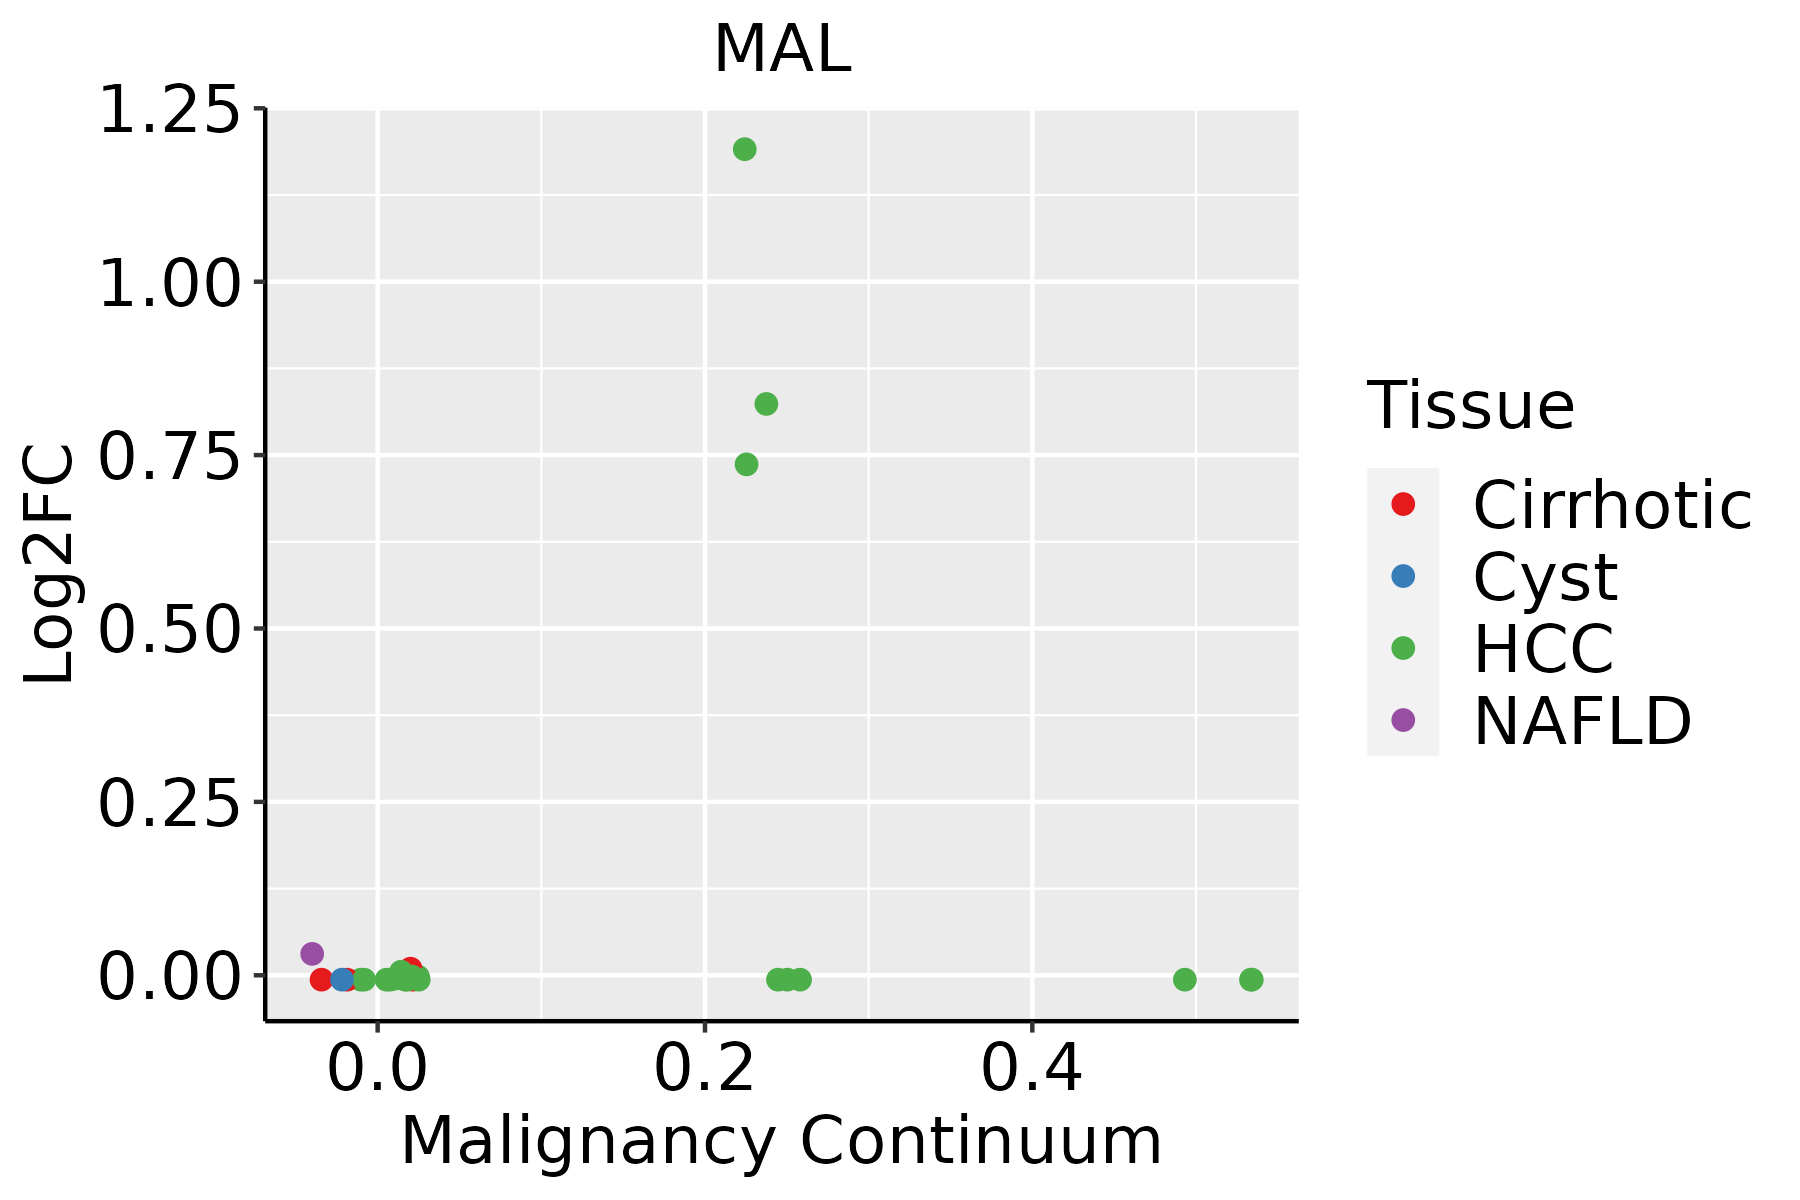 | HCC: Hepatocellular carcinoma |
| NAFLD: Non-alcoholic fatty liver disease | ||
| Oral Cavity |  | EOLP: Erosive Oral lichen planus |
| LP: leukoplakia | ||
| NEOLP: Non-erosive oral lichen planus | ||
| OSCC: Oral squamous cell carcinoma |
| ∗log2FC in expression of this searched gene in stem-like cells from each diseased tissue sample relative to stem-like cells in normal samples in each tissue plotted against the malignancy continuum. Samples are colored based on if they are from different disease stage. |
Top |
Malignant transformation related pathway analysis |
| Find out the enriched GO biological processes and KEGG pathways involved in transition from healthy to precancer to cancer |
| Tissue | Disease Stage | Enriched GO biological Processes |
| Colorectum | AD |  |
| Colorectum | SER |  |
| Colorectum | MSS |  |
| Colorectum | MSI-H |  |
| Colorectum | FAP |  |
| ∗Top 15 enriched GO BP terms are showed in the bar plot of each disease state in each tissue. Each row represents a significant GO biological process which is colored according to the -log10(p.adjust). |
| Page: 1 2 3 4 5 6 7 8 9 |
| GO ID | Tissue | Disease Stage | Description | Gene Ratio | Bg Ratio | pvalue | p.adjust | Count |
| GO:007048218 | Prostate | Tumor | response to oxygen levels | 102/3246 | 347/18723 | 1.62e-08 | 5.75e-07 | 102 |
| GO:003629318 | Prostate | Tumor | response to decreased oxygen levels | 94/3246 | 322/18723 | 8.37e-08 | 2.29e-06 | 94 |
| GO:000166618 | Prostate | Tumor | response to hypoxia | 90/3246 | 307/18723 | 1.27e-07 | 3.28e-06 | 90 |
| GO:190370617 | Prostate | Tumor | regulation of hemopoiesis | 103/3246 | 367/18723 | 1.78e-07 | 4.38e-06 | 103 |
| GO:003367417 | Prostate | Tumor | positive regulation of kinase activity | 123/3246 | 467/18723 | 5.36e-07 | 1.15e-05 | 123 |
| GO:001095018 | Prostate | Tumor | positive regulation of endopeptidase activity | 58/3246 | 179/18723 | 6.35e-07 | 1.32e-05 | 58 |
| GO:004586015 | Prostate | Tumor | positive regulation of protein kinase activity | 105/3246 | 386/18723 | 7.09e-07 | 1.43e-05 | 105 |
| GO:004328017 | Prostate | Tumor | positive regulation of cysteine-type endopeptidase activity involved in apoptotic process | 45/3246 | 129/18723 | 1.17e-06 | 2.21e-05 | 45 |
| GO:190332214 | Prostate | Tumor | positive regulation of protein modification by small protein conjugation or removal | 47/3246 | 138/18723 | 1.50e-06 | 2.67e-05 | 47 |
| GO:200105617 | Prostate | Tumor | positive regulation of cysteine-type endopeptidase activity | 48/3246 | 148/18723 | 5.51e-06 | 8.48e-05 | 48 |
| GO:007145316 | Prostate | Tumor | cellular response to oxygen levels | 54/3246 | 177/18723 | 1.13e-05 | 1.62e-04 | 54 |
| GO:003139814 | Prostate | Tumor | positive regulation of protein ubiquitination | 40/3246 | 119/18723 | 1.25e-05 | 1.76e-04 | 40 |
| GO:000724916 | Prostate | Tumor | I-kappaB kinase/NF-kappaB signaling | 77/3246 | 281/18723 | 1.55e-05 | 2.09e-04 | 77 |
| GO:005116816 | Prostate | Tumor | nuclear export | 48/3246 | 154/18723 | 1.82e-05 | 2.41e-04 | 48 |
| GO:002240717 | Prostate | Tumor | regulation of cell-cell adhesion | 112/3246 | 448/18723 | 2.20e-05 | 2.80e-04 | 112 |
| GO:004312217 | Prostate | Tumor | regulation of I-kappaB kinase/NF-kappaB signaling | 69/3246 | 249/18723 | 2.83e-05 | 3.43e-04 | 69 |
| GO:003629416 | Prostate | Tumor | cellular response to decreased oxygen levels | 49/3246 | 161/18723 | 3.02e-05 | 3.62e-04 | 49 |
| GO:190210513 | Prostate | Tumor | regulation of leukocyte differentiation | 74/3246 | 279/18723 | 7.23e-05 | 7.63e-04 | 74 |
| GO:004211015 | Prostate | Tumor | T cell activation | 117/3246 | 487/18723 | 9.22e-05 | 9.05e-04 | 117 |
| GO:004312315 | Prostate | Tumor | positive regulation of I-kappaB kinase/NF-kappaB signaling | 53/3246 | 186/18723 | 1.04e-04 | 1.00e-03 | 53 |
| Page: 1 2 3 4 5 6 7 8 9 10 11 12 13 14 15 16 17 18 19 20 21 22 23 24 25 26 27 28 29 30 31 32 33 34 35 36 37 38 39 40 41 42 43 |
| Pathway ID | Tissue | Disease Stage | Description | Gene Ratio | Bg Ratio | pvalue | p.adjust | qvalue | Count |
| Page: 1 |
Top |
Cell-cell communication analysis |
| Identification of potential cell-cell interactions between two cell types and their ligand-receptor pairs for different disease states |
| Ligand | Receptor | LRpair | Pathway | Tissue | Disease Stage |
| Page: 1 |
Top |
Single-cell gene regulatory network inference analysis |
| Find out the significant the regulons (TFs) and the target genes of each regulon across cell types for different disease states |
| TF | Cell Type | Tissue | Disease Stage | Target Gene | RSS | Regulon Activity |
| ∗The dot plots of a searched regulon are shown for all cell subpopulations in each disease state of each tissue based on the regulon specific score inferred using pySCENIC and by calculating the average expression. |
| Page: 1 |
Top |
Somatic mutation of malignant transformation related genes |
| Annotation of somatic variants for genes involved in malignant transformation |
| Hugo Symbol | Variant Class | Variant Classification | dbSNP RS | HGVSc | HGVSp | HGVSp Short | SWISSPROT | BIOTYPE | SIFT | PolyPhen | Tumor Sample Barcode | Tissue | Histology | Sex | Age | Stage | Therapy Types | Drugs | Outcome |
| MAL | SNV | Missense_Mutation | c.88N>C | p.Glu30Gln | p.E30Q | P21145 | protein_coding | deleterious(0.01) | possibly_damaging(0.881) | TCGA-AC-A23H-01 | Breast | breast invasive carcinoma | Female | >=65 | I/II | Unknown | Unknown | PD | |
| MAL | SNV | Missense_Mutation | rs745729561 | c.139C>T | p.Pro47Ser | p.P47S | P21145 | protein_coding | tolerated(0.1) | probably_damaging(0.988) | TCGA-BH-A18G-01 | Breast | breast invasive carcinoma | Female | >=65 | I/II | Unknown | Unknown | SD |
| MAL | SNV | Missense_Mutation | rs775300945 | c.428N>T | p.Ala143Val | p.A143V | P21145 | protein_coding | tolerated(0.05) | benign(0.426) | TCGA-VS-A94Z-01 | Cervix | cervical & endocervical cancer | Female | <65 | I/II | Chemotherapy | cisplatin | CR |
| MAL | SNV | Missense_Mutation | novel | c.254N>C | p.Val85Ala | p.V85A | P21145 | protein_coding | tolerated(0.47) | benign(0.243) | TCGA-A6-5665-01 | Colorectum | colon adenocarcinoma | Female | >=65 | I/II | Unknown | Unknown | PD |
| MAL | SNV | Missense_Mutation | c.359G>T | p.Arg120Met | p.R120M | P21145 | protein_coding | deleterious(0.03) | benign(0.369) | TCGA-AM-5821-01 | Colorectum | colon adenocarcinoma | Female | >=65 | I/II | Unknown | Unknown | SD | |
| MAL | SNV | Missense_Mutation | c.127T>A | p.Ser43Thr | p.S43T | P21145 | protein_coding | deleterious(0.02) | possibly_damaging(0.744) | TCGA-CM-6679-01 | Colorectum | colon adenocarcinoma | Male | <65 | I/II | Unknown | Unknown | SD | |
| MAL | SNV | Missense_Mutation | rs749751444 | c.335N>T | p.Thr112Met | p.T112M | P21145 | protein_coding | tolerated(0.22) | benign(0.022) | TCGA-D5-6924-01 | Colorectum | colon adenocarcinoma | Male | >=65 | I/II | Unknown | Unknown | SD |
| MAL | SNV | Missense_Mutation | novel | c.145N>G | p.Pro49Ala | p.P49A | P21145 | protein_coding | tolerated(0.16) | benign(0.039) | TCGA-DM-A28F-01 | Colorectum | colon adenocarcinoma | Male | >=65 | III/IV | Unknown | Unknown | SD |
| MAL | SNV | Missense_Mutation | rs775300945 | c.428N>T | p.Ala143Val | p.A143V | P21145 | protein_coding | tolerated(0.05) | benign(0.426) | TCGA-AX-A0IZ-01 | Endometrium | uterine corpus endometrioid carcinoma | Female | <65 | I/II | Unknown | Unknown | SD |
| MAL | SNV | Missense_Mutation | novel | c.89A>G | p.Glu30Gly | p.E30G | P21145 | protein_coding | deleterious(0) | probably_damaging(0.913) | TCGA-AX-A2HC-01 | Endometrium | uterine corpus endometrioid carcinoma | Female | <65 | III/IV | Chemotherapy | paclitaxel | PD |
| Page: 1 2 3 |
Top |
Related drugs of malignant transformation related genes |
| Identification of chemicals and drugs interact with genes involved in malignant transfromation |
| (DGIdb 4.0) |
| Entrez ID | Symbol | Category | Interaction Types | Drug Claim Name | Drug Name | PMIDs |
| Page: 1 |

Copyright 2023-Present -The University of Texas Health Science Center at Houston |