| GO ID | Tissue | Disease Stage | Description | Gene Ratio | Bg Ratio | pvalue | p.adjust | Count |
| GO:007135312 | Prostate | Tumor | cellular response to interleukin-4 | 13/3246 | 33/18723 | 2.26e-03 | 1.28e-02 | 13 |
| GO:003106011 | Prostate | Tumor | regulation of histone methylation | 22/3246 | 69/18723 | 2.31e-03 | 1.30e-02 | 22 |
| GO:004240111 | Prostate | Tumor | cellular biogenic amine biosynthetic process | 14/3246 | 37/18723 | 2.43e-03 | 1.36e-02 | 14 |
| GO:004663411 | Prostate | Tumor | regulation of alpha-beta T cell activation | 30/3246 | 104/18723 | 2.48e-03 | 1.38e-02 | 30 |
| GO:004853811 | Prostate | Tumor | thymus development | 16/3246 | 45/18723 | 2.59e-03 | 1.43e-02 | 16 |
| GO:007200913 | Prostate | Tumor | nephron epithelium development | 31/3246 | 109/18723 | 2.70e-03 | 1.48e-02 | 31 |
| GO:004352315 | Prostate | Tumor | regulation of neuron apoptotic process | 53/3246 | 212/18723 | 2.92e-03 | 1.58e-02 | 53 |
| GO:004561911 | Prostate | Tumor | regulation of lymphocyte differentiation | 45/3246 | 174/18723 | 2.93e-03 | 1.58e-02 | 45 |
| GO:000300711 | Prostate | Tumor | heart morphogenesis | 60/3246 | 246/18723 | 2.99e-03 | 1.61e-02 | 60 |
| GO:004663111 | Prostate | Tumor | alpha-beta T cell activation | 41/3246 | 156/18723 | 3.21e-03 | 1.68e-02 | 41 |
| GO:000930911 | Prostate | Tumor | amine biosynthetic process | 14/3246 | 38/18723 | 3.24e-03 | 1.69e-02 | 14 |
| GO:190210712 | Prostate | Tumor | positive regulation of leukocyte differentiation | 41/3246 | 157/18723 | 3.63e-03 | 1.86e-02 | 41 |
| GO:190370812 | Prostate | Tumor | positive regulation of hemopoiesis | 41/3246 | 157/18723 | 3.63e-03 | 1.86e-02 | 41 |
| GO:000165612 | Prostate | Tumor | metanephros development | 25/3246 | 85/18723 | 4.12e-03 | 2.08e-02 | 25 |
| GO:00323501 | Prostate | Tumor | regulation of hormone metabolic process | 13/3246 | 35/18723 | 4.14e-03 | 2.08e-02 | 13 |
| GO:000320611 | Prostate | Tumor | cardiac chamber morphogenesis | 33/3246 | 121/18723 | 4.16e-03 | 2.09e-02 | 33 |
| GO:000327911 | Prostate | Tumor | cardiac septum development | 29/3246 | 103/18723 | 4.26e-03 | 2.13e-02 | 29 |
| GO:003021711 | Prostate | Tumor | T cell differentiation | 61/3246 | 257/18723 | 5.30e-03 | 2.54e-02 | 61 |
| GO:000165712 | Prostate | Tumor | ureteric bud development | 26/3246 | 91/18723 | 5.32e-03 | 2.54e-02 | 26 |
| GO:007208013 | Prostate | Tumor | nephron tubule development | 26/3246 | 91/18723 | 5.32e-03 | 2.54e-02 | 26 |
| Pathway ID | Tissue | Disease Stage | Description | Gene Ratio | Bg Ratio | pvalue | p.adjust | qvalue | Count |
| hsa046597 | Prostate | BPH | Th17 cell differentiation | 36/1718 | 108/8465 | 9.75e-04 | 4.47e-03 | 2.76e-03 | 36 |
| hsa0492814 | Prostate | BPH | Parathyroid hormone synthesis, secretion and action | 33/1718 | 106/8465 | 5.30e-03 | 1.75e-02 | 1.08e-02 | 33 |
| hsa0465912 | Prostate | BPH | Th17 cell differentiation | 36/1718 | 108/8465 | 9.75e-04 | 4.47e-03 | 2.76e-03 | 36 |
| hsa0492815 | Prostate | BPH | Parathyroid hormone synthesis, secretion and action | 33/1718 | 106/8465 | 5.30e-03 | 1.75e-02 | 1.08e-02 | 33 |
| hsa0465922 | Prostate | Tumor | Th17 cell differentiation | 36/1791 | 108/8465 | 2.11e-03 | 8.42e-03 | 5.22e-03 | 36 |
| hsa0492822 | Prostate | Tumor | Parathyroid hormone synthesis, secretion and action | 35/1791 | 106/8465 | 2.89e-03 | 1.07e-02 | 6.67e-03 | 35 |
| hsa0465932 | Prostate | Tumor | Th17 cell differentiation | 36/1791 | 108/8465 | 2.11e-03 | 8.42e-03 | 5.22e-03 | 36 |
| hsa0492832 | Prostate | Tumor | Parathyroid hormone synthesis, secretion and action | 35/1791 | 106/8465 | 2.89e-03 | 1.07e-02 | 6.67e-03 | 35 |
| Hugo Symbol | Variant Class | Variant Classification | dbSNP RS | HGVSc | HGVSp | HGVSp Short | SWISSPROT | BIOTYPE | SIFT | PolyPhen | Tumor Sample Barcode | Tissue | Histology | Sex | Age | Stage | Therapy Types | Drugs | Outcome |
| GATA3 | SNV | Missense_Mutation | | c.881T>A | p.Met294Lys | p.M294K | P23771 | protein_coding | deleterious(0) | possibly_damaging(0.692) | TCGA-5L-AAT1-01 | Breast | breast invasive carcinoma | Female | <65 | III/IV | Hormone Therapy | letrozol | SD |
| GATA3 | SNV | Missense_Mutation | | c.1095N>T | p.Arg365Ser | p.R365S | P23771 | protein_coding | deleterious(0.04) | probably_damaging(1) | TCGA-AR-A0U2-01 | Breast | breast invasive carcinoma | Female | <65 | III/IV | Hormone Therapy | tamoxiphen | PD |
| GATA3 | SNV | Missense_Mutation | | c.983N>A | p.Leu328His | p.L328H | P23771 | protein_coding | deleterious(0) | probably_damaging(1) | TCGA-AR-A24P-01 | Breast | breast invasive carcinoma | Female | <65 | I/II | Unknown | Unknown | SD |
| GATA3 | SNV | Missense_Mutation | novel | c.989G>A | p.Arg330Lys | p.R330K | P23771 | protein_coding | deleterious(0.01) | probably_damaging(1) | TCGA-B6-A40C-01 | Breast | breast invasive carcinoma | Female | <65 | I/II | Hormone Therapy | cyclophosphamide | SD |
| GATA3 | SNV | Missense_Mutation | | c.1071G>T | p.Met357Ile | p.M357I | P23771 | protein_coding | deleterious(0.01) | probably_damaging(0.925) | TCGA-BH-A0BQ-01 | Breast | breast invasive carcinoma | Female | <65 | I/II | Unknown | Unknown | PD |
| GATA3 | SNV | Missense_Mutation | novel | c.992N>A | p.Arg331Lys | p.R331K | P23771 | protein_coding | deleterious(0.04) | probably_damaging(0.946) | TCGA-BH-A0C7-01 | Breast | breast invasive carcinoma | Female | <65 | I/II | Chemotherapy | adriamycin | CR |
| GATA3 | SNV | Missense_Mutation | | c.881N>A | p.Met294Lys | p.M294K | P23771 | protein_coding | deleterious(0) | possibly_damaging(0.692) | TCGA-BH-A0H5-01 | Breast | breast invasive carcinoma | Female | <65 | I/II | Chemotherapy | cytoxan | CR |
| GATA3 | SNV | Missense_Mutation | | c.845N>G | p.His282Arg | p.H282R | P23771 | protein_coding | deleterious(0) | possibly_damaging(0.882) | TCGA-BH-A0HF-01 | Breast | breast invasive carcinoma | Female | >=65 | I/II | Hormone Therapy | arimidex | SD |
| GATA3 | SNV | Missense_Mutation | | c.881N>A | p.Met294Lys | p.M294K | P23771 | protein_coding | deleterious(0) | possibly_damaging(0.692) | TCGA-BH-A0HP-01 | Breast | breast invasive carcinoma | Female | >=65 | III/IV | Chemotherapy | doxorubicin | SD |
| GATA3 | SNV | Missense_Mutation | | c.356A>T | p.Lys119Met | p.K119M | P23771 | protein_coding | deleterious(0) | probably_damaging(0.936) | TCGA-BH-A18M-01 | Breast | breast invasive carcinoma | Female | <65 | III/IV | Unknown | Unknown | SD |
| Entrez ID | Symbol | Category | Interaction Types | Drug Claim Name | Drug Name | PMIDs |
| 2625 | GATA3 | CLINICALLY ACTIONABLE, TRANSCRIPTION FACTOR | | mercaptopurine | MERCAPTOPURINE | 24141364 |
| 2625 | GATA3 | CLINICALLY ACTIONABLE, TRANSCRIPTION FACTOR | | pegaspargase | PEGASPARGASE | 24141364 |
| 2625 | GATA3 | CLINICALLY ACTIONABLE, TRANSCRIPTION FACTOR | | leucovorin | LEUCOVORIN | 24141364 |
| 2625 | GATA3 | CLINICALLY ACTIONABLE, TRANSCRIPTION FACTOR | | vincristine | VINCRISTINE | 24141364 |
| 2625 | GATA3 | CLINICALLY ACTIONABLE, TRANSCRIPTION FACTOR | | thioguanine | THIOGUANINE | 24141364 |
| 2625 | GATA3 | CLINICALLY ACTIONABLE, TRANSCRIPTION FACTOR | | asparaginase | ASPARAGINASE | 24141364 |
| 2625 | GATA3 | CLINICALLY ACTIONABLE, TRANSCRIPTION FACTOR | | prednisone | PREDNISONE | 24141364 |
| 2625 | GATA3 | CLINICALLY ACTIONABLE, TRANSCRIPTION FACTOR | | methotrexate | METHOTREXATE | 24141364 |
| 2625 | GATA3 | CLINICALLY ACTIONABLE, TRANSCRIPTION FACTOR | | dexamethasone | DEXAMETHASONE | 24141364 |
| 2625 | GATA3 | CLINICALLY ACTIONABLE, TRANSCRIPTION FACTOR | | doxorubicin | DOXORUBICIN | 24141364 |


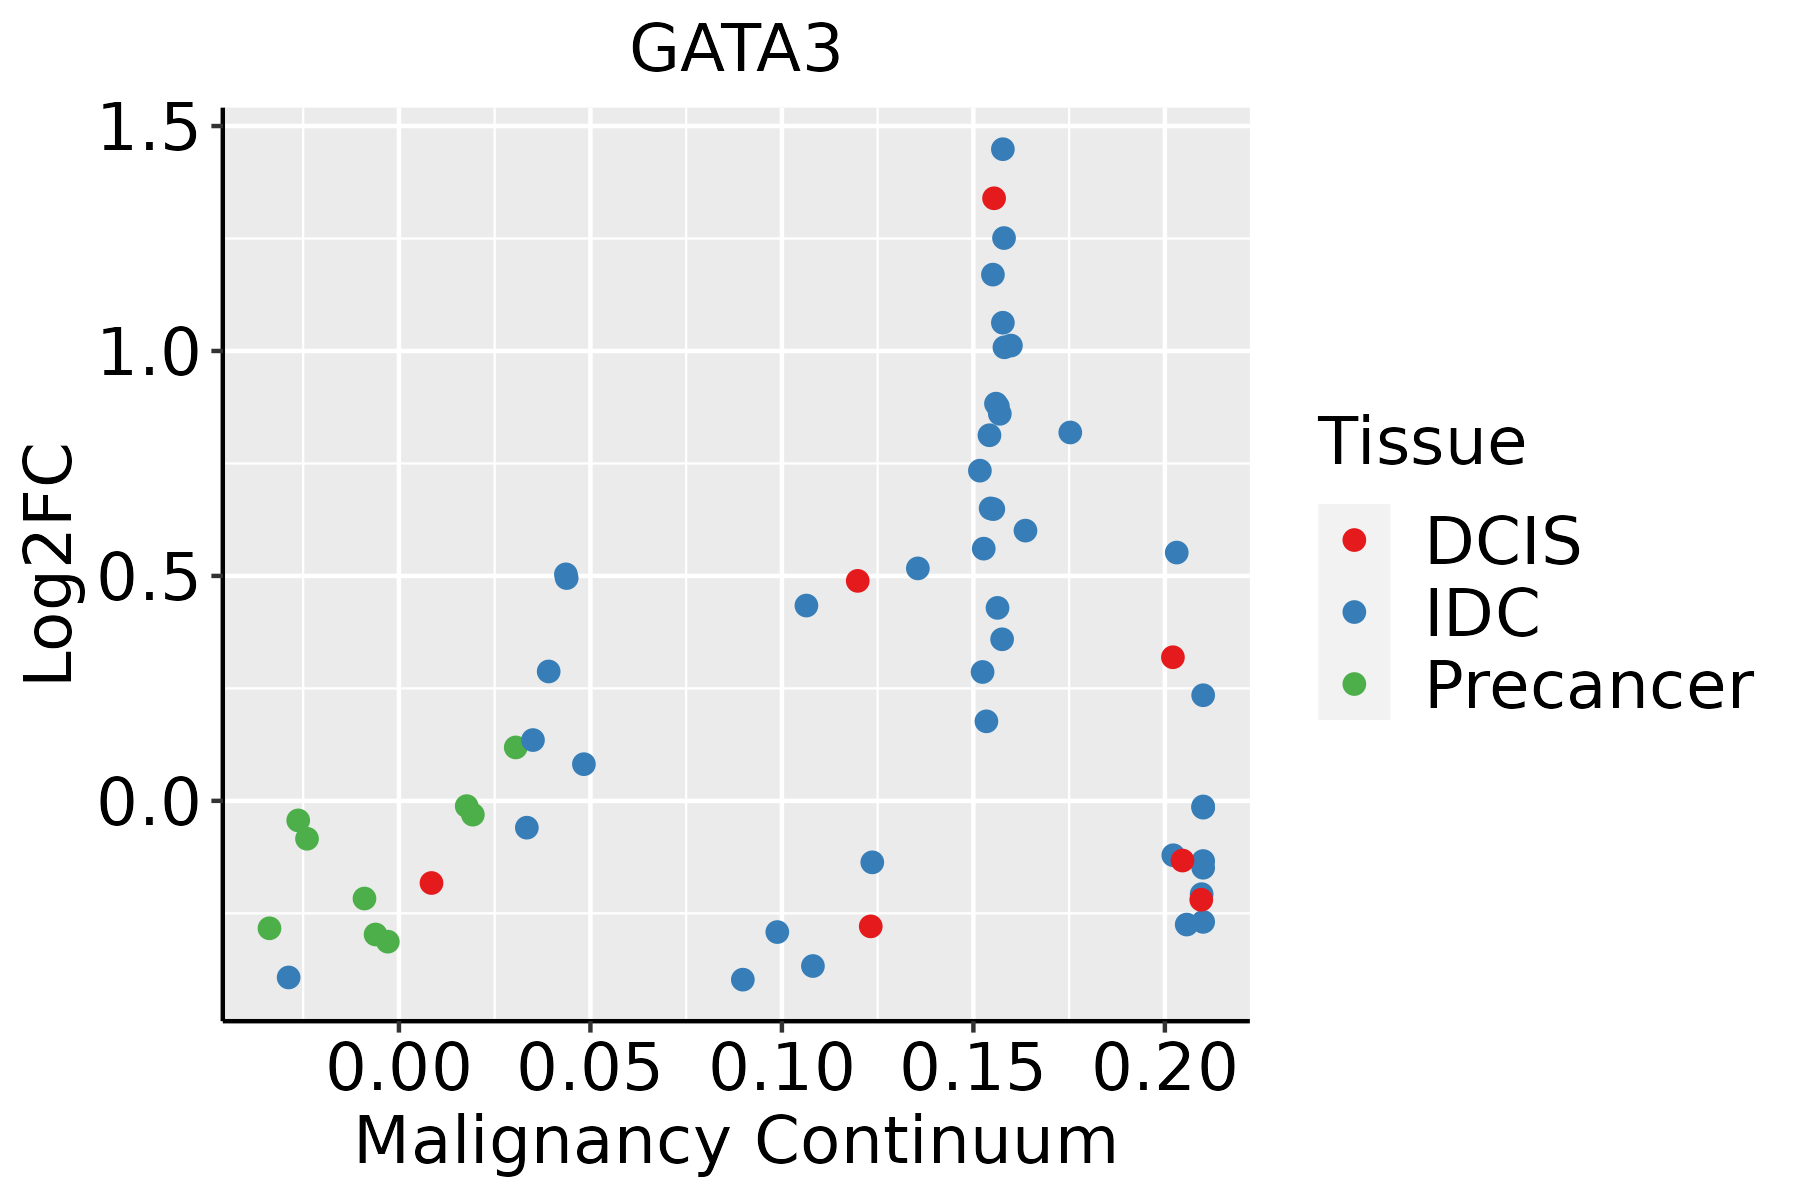
 Identification of the aberrant gene expression in precancerous and cancerous lesions by comparing the gene expression of stem-like cells in diseased tissues with normal stem cells
 Find out the enriched GO biological processes and KEGG pathways involved in transition from healthy to precancer to cancer


 Identification of potential cell-cell interactions between two cell types and their ligand-receptor pairs for different disease states
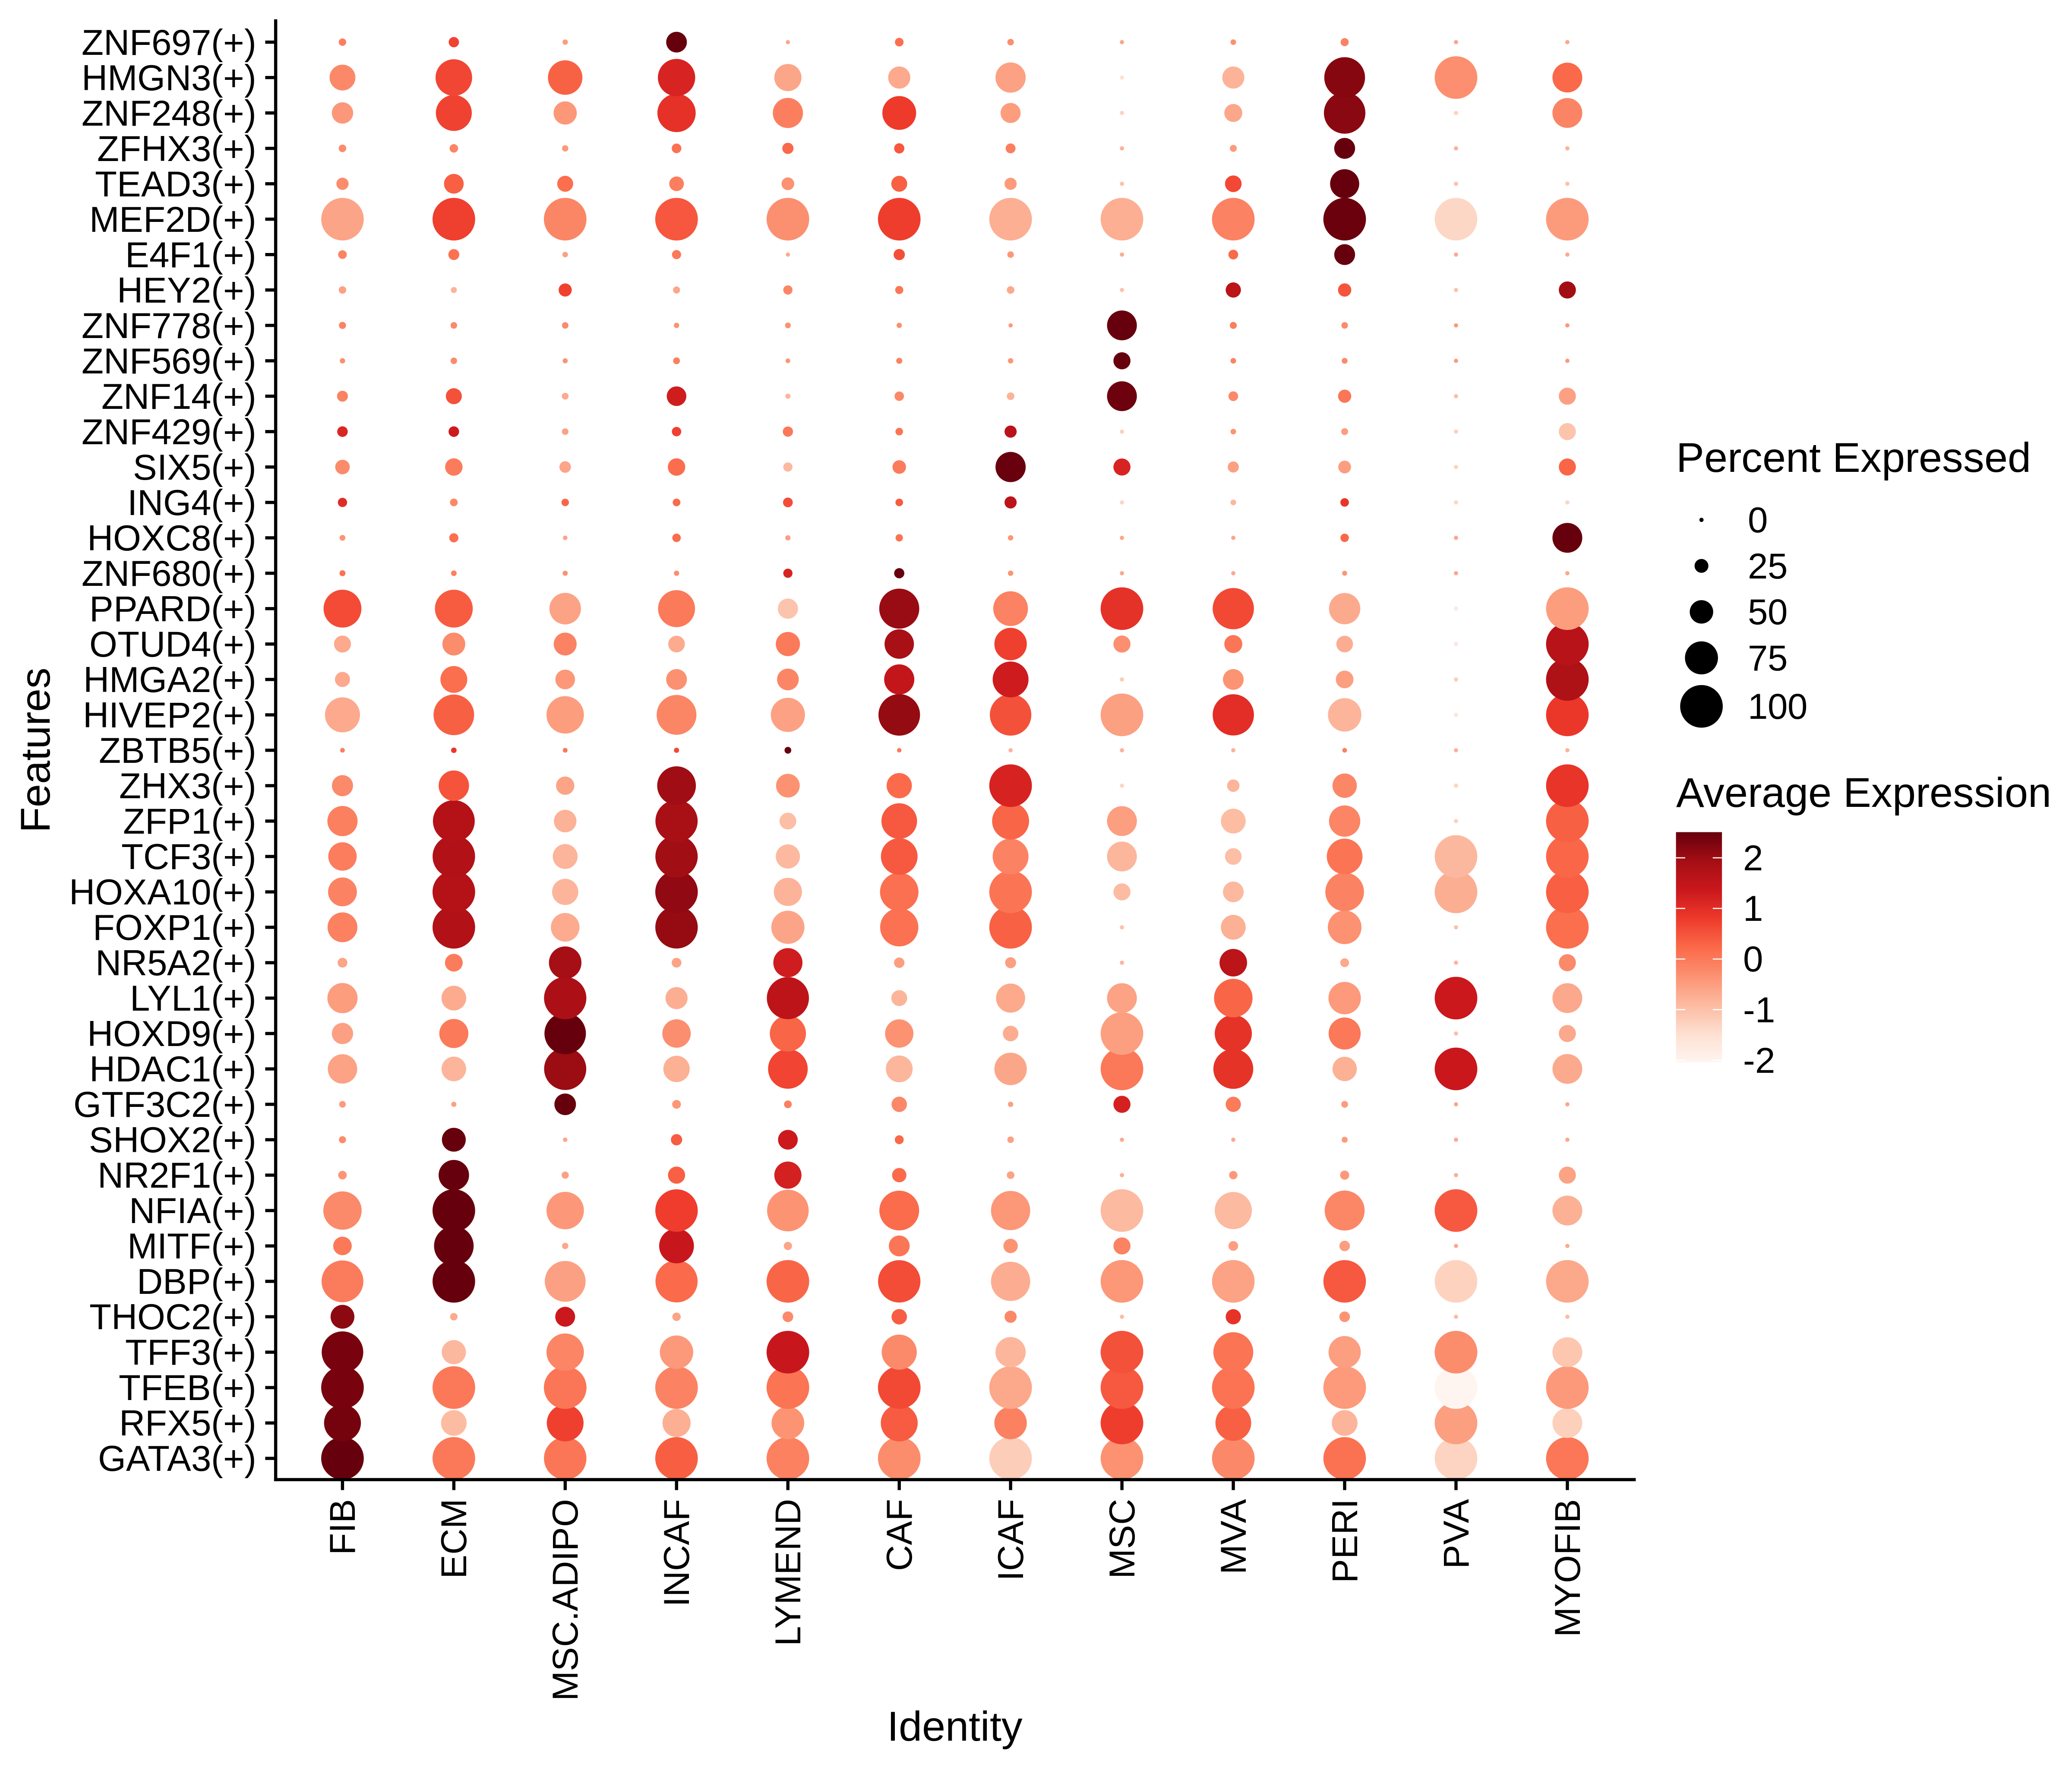
 Find out the significant the regulons (TFs) and the target genes of each regulon across cell types for different disease states
 Annotation of somatic variants for genes involved in malignant transformation
 Identification of chemicals and drugs interact with genes involved in malignant transfromation


