
|
|||||
|
 | |
| |
| |
| |
| |
| |
|
Gene: CEACAM1 |
Gene summary for CEACAM1 |
| Gene information | Species | Human | Gene symbol | CEACAM1 | Gene ID | 634 |
| Gene name | CEA cell adhesion molecule 1 | |
| Gene Alias | BGP | |
| Cytomap | 19q13.2 | |
| Gene Type | protein-coding | GO ID | GO:0000165 | UniProtAcc | P13688 |
Top |
Malignant transformation analysis |
| Identification of the aberrant gene expression in precancerous and cancerous lesions by comparing the gene expression of stem-like cells in diseased tissues with normal stem cells |
| Entrez ID | Symbol | Replicates | Species | Organ | Tissue | Adj P-value | Log2FC | Malignancy |
| 634 | CEACAM1 | Tumor | Human | Cervix | CC | 1.00e-03 | 2.21e-01 | 0.1241 |
| 634 | CEACAM1 | sample3 | Human | Cervix | CC | 4.21e-21 | 5.70e-01 | 0.1387 |
| 634 | CEACAM1 | H2 | Human | Cervix | HSIL_HPV | 1.56e-08 | 2.73e-01 | 0.0632 |
| 634 | CEACAM1 | T1 | Human | Cervix | CC | 2.11e-04 | 2.54e-01 | 0.0918 |
| 634 | CEACAM1 | T3 | Human | Cervix | CC | 6.61e-21 | 5.83e-01 | 0.1389 |
| 634 | CEACAM1 | HTA11_3410_2000001011 | Human | Colorectum | AD | 9.56e-03 | -3.11e-01 | 0.0155 |
| 634 | CEACAM1 | HTA11_2487_2000001011 | Human | Colorectum | SER | 1.45e-06 | 1.07e+00 | -0.1808 |
| 634 | CEACAM1 | HTA11_411_2000001011 | Human | Colorectum | SER | 2.79e-02 | 1.58e+00 | -0.2602 |
| 634 | CEACAM1 | HTA11_2112_2000001011 | Human | Colorectum | SER | 3.26e-07 | 1.52e+00 | -0.2196 |
| 634 | CEACAM1 | HTA11_1391_2000001011 | Human | Colorectum | AD | 4.26e-03 | 6.21e-01 | -0.059 |
| 634 | CEACAM1 | HTA11_866_3004761011 | Human | Colorectum | AD | 5.86e-03 | -8.34e-02 | 0.096 |
| 634 | CEACAM1 | A015-C-203 | Human | Colorectum | FAP | 2.52e-04 | -1.81e-01 | -0.1294 |
| 634 | CEACAM1 | A002-C-203 | Human | Colorectum | FAP | 1.70e-02 | -1.56e-01 | 0.2786 |
| 634 | CEACAM1 | A002-C-205 | Human | Colorectum | FAP | 1.38e-05 | -2.65e-01 | -0.1236 |
| 634 | CEACAM1 | A015-C-006 | Human | Colorectum | FAP | 2.10e-02 | -9.96e-02 | -0.0994 |
| 634 | CEACAM1 | A002-C-114 | Human | Colorectum | FAP | 4.08e-02 | -1.64e-01 | -0.1561 |
| 634 | CEACAM1 | A015-C-104 | Human | Colorectum | FAP | 1.15e-06 | -1.78e-01 | -0.1899 |
| 634 | CEACAM1 | A002-C-016 | Human | Colorectum | FAP | 8.73e-05 | -1.79e-01 | 0.0521 |
| 634 | CEACAM1 | A002-C-116 | Human | Colorectum | FAP | 3.65e-07 | -7.62e-02 | -0.0452 |
| 634 | CEACAM1 | A018-E-020 | Human | Colorectum | FAP | 4.70e-04 | -2.50e-01 | -0.2034 |
| Page: 1 2 3 4 |
| Tissue | Expression Dynamics | Abbreviation |
| Cervix | 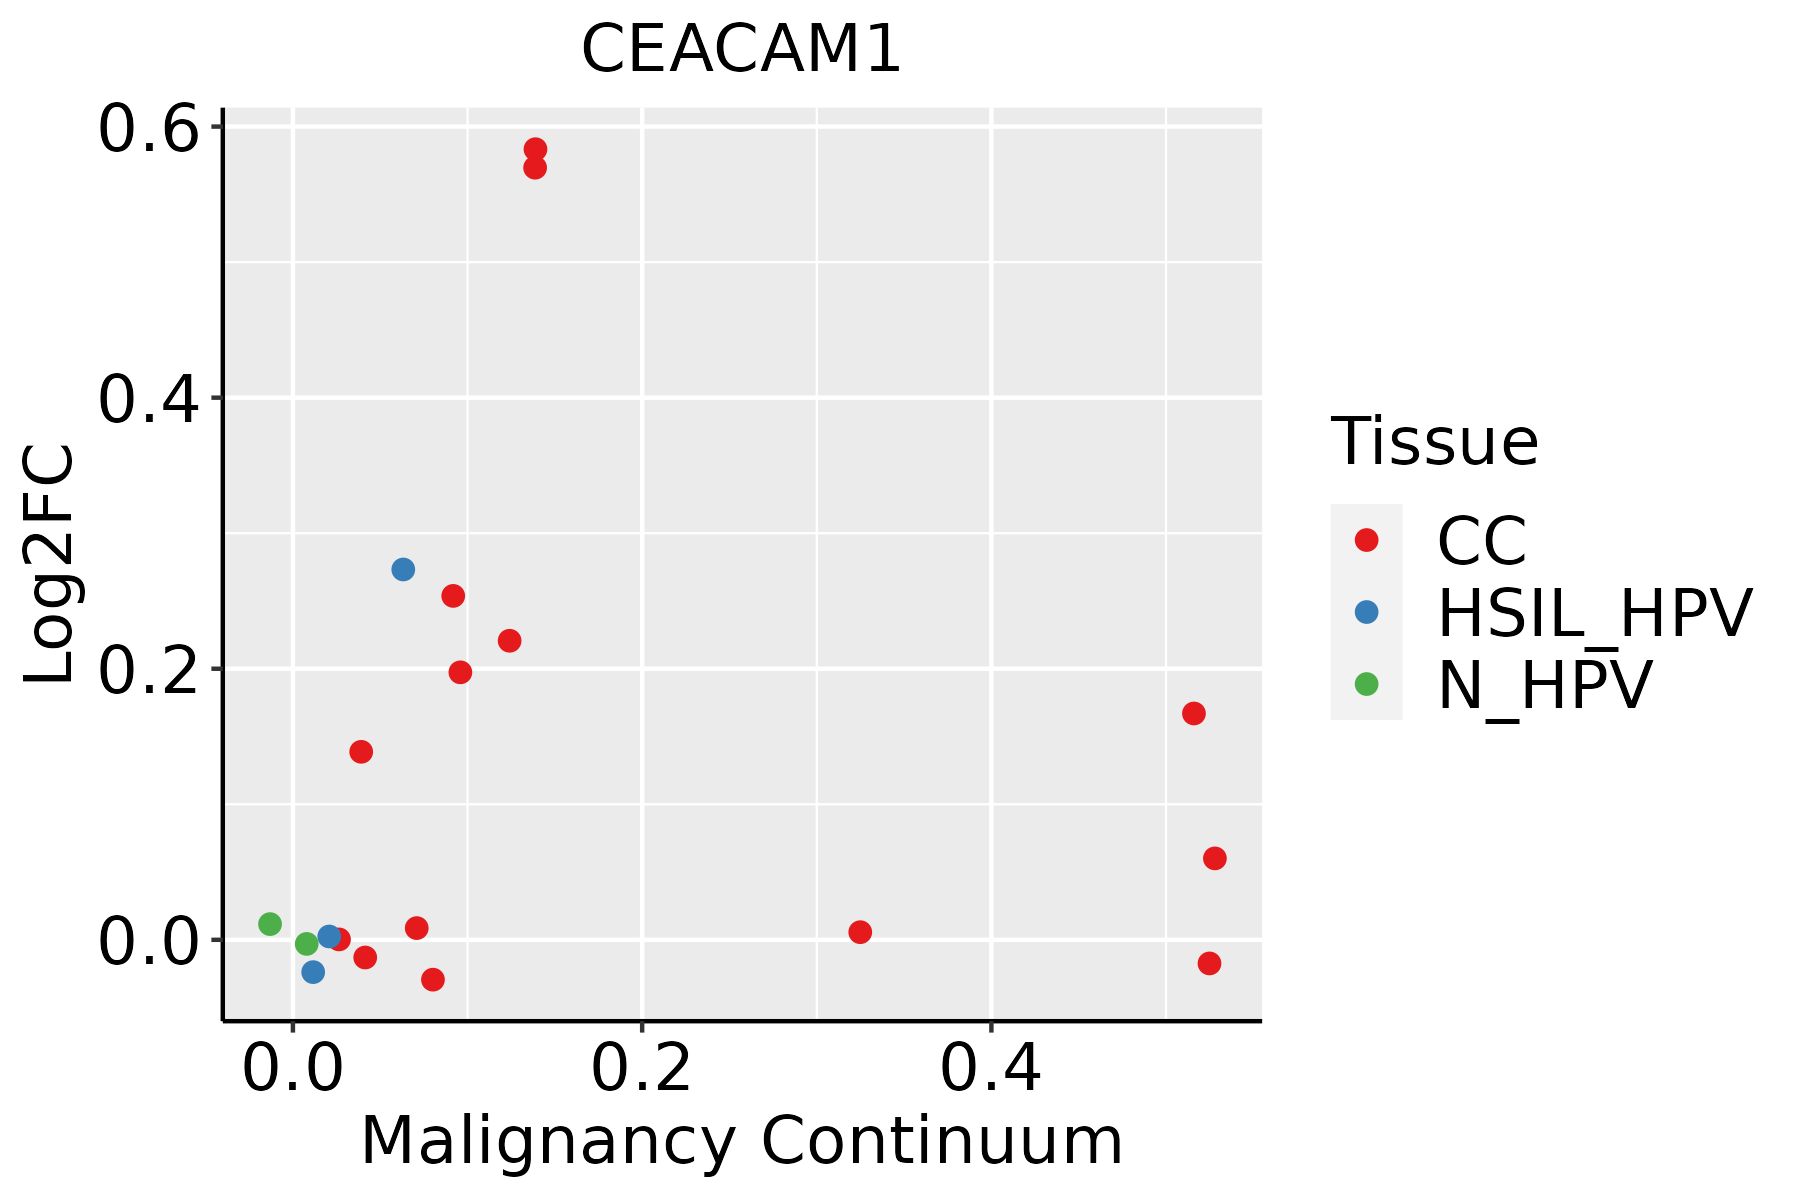 | CC: Cervix cancer |
| HSIL_HPV: HPV-infected high-grade squamous intraepithelial lesions | ||
| N_HPV: HPV-infected normal cervix | ||
| Colorectum (GSE201348) |  | FAP: Familial adenomatous polyposis |
| CRC: Colorectal cancer | ||
| Colorectum (HTA11) |  | AD: Adenomas |
| SER: Sessile serrated lesions | ||
| MSI-H: Microsatellite-high colorectal cancer | ||
| MSS: Microsatellite stable colorectal cancer | ||
| Esophagus |  | ESCC: Esophageal squamous cell carcinoma |
| HGIN: High-grade intraepithelial neoplasias | ||
| LGIN: Low-grade intraepithelial neoplasias | ||
| Liver | 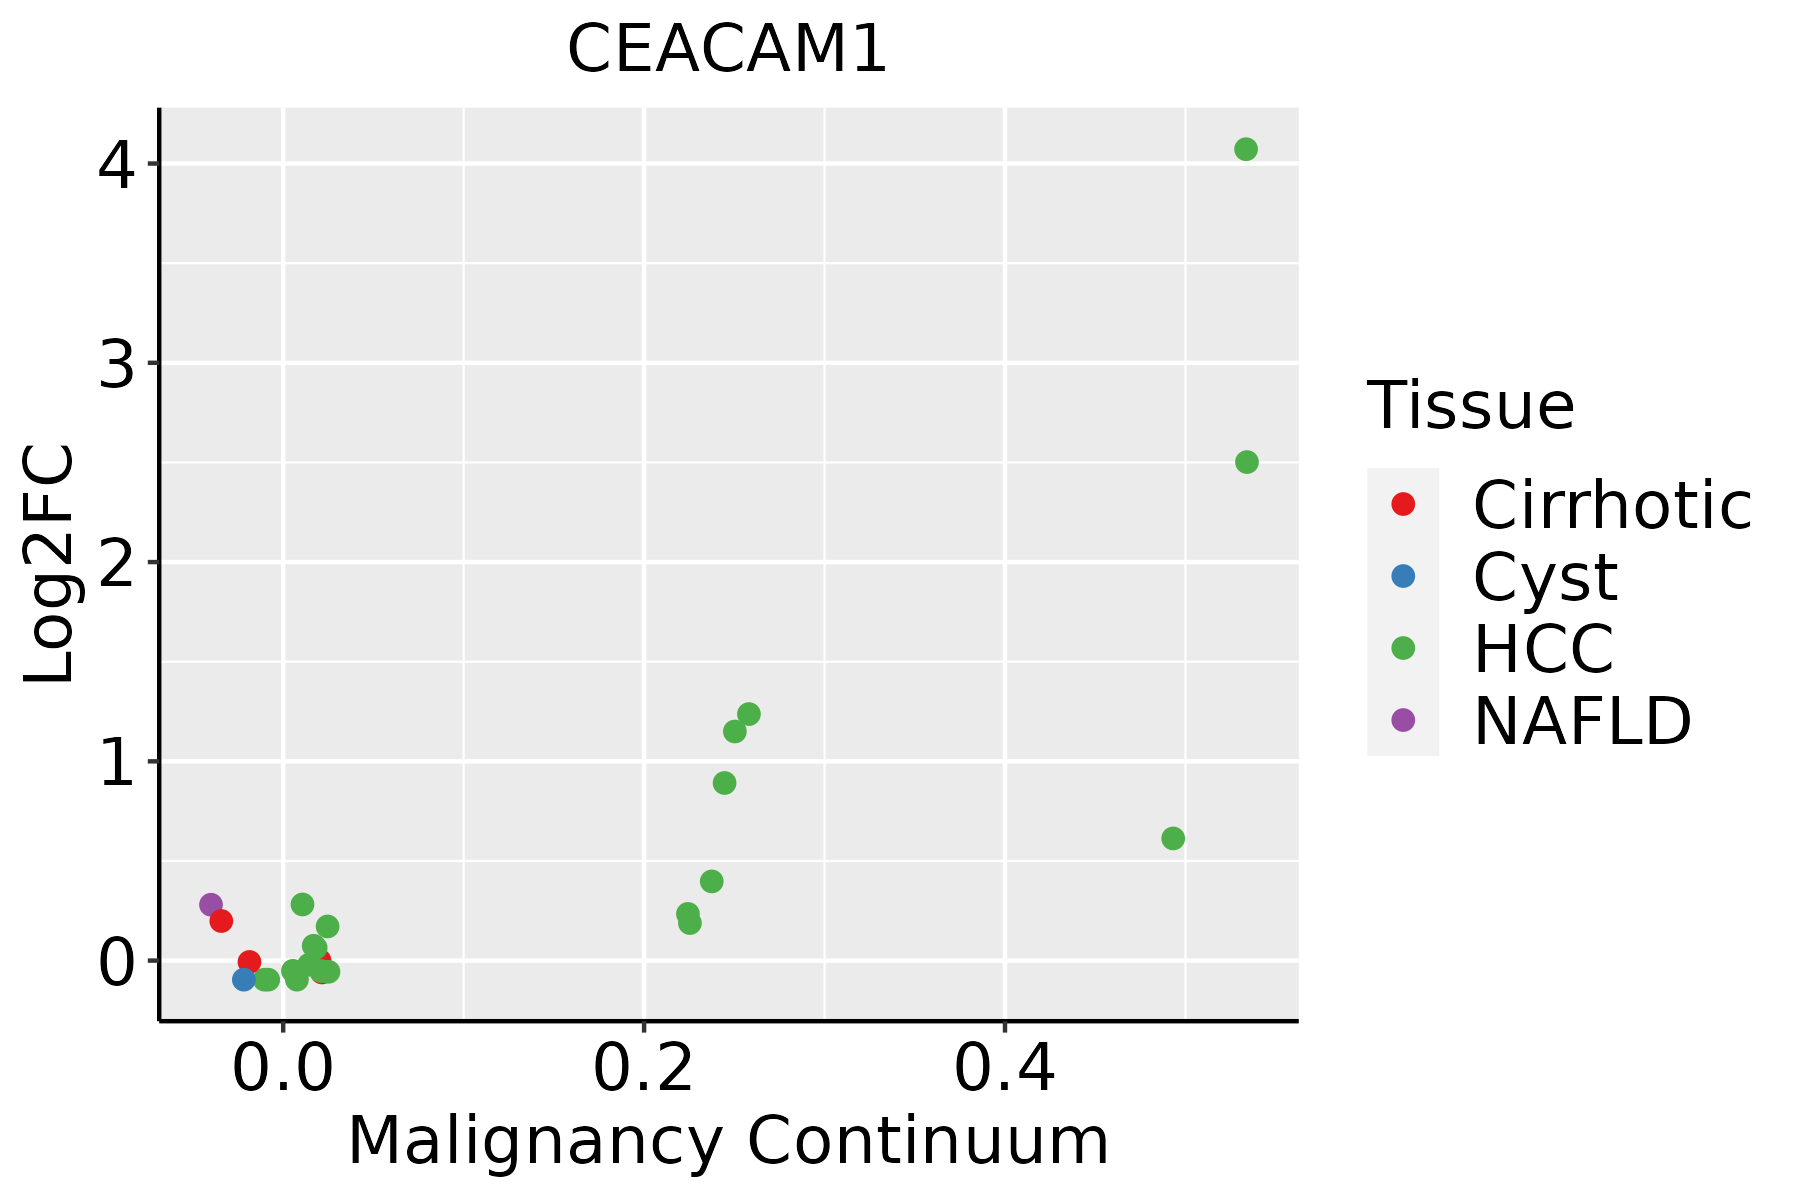 | HCC: Hepatocellular carcinoma |
| NAFLD: Non-alcoholic fatty liver disease | ||
| Oral Cavity | 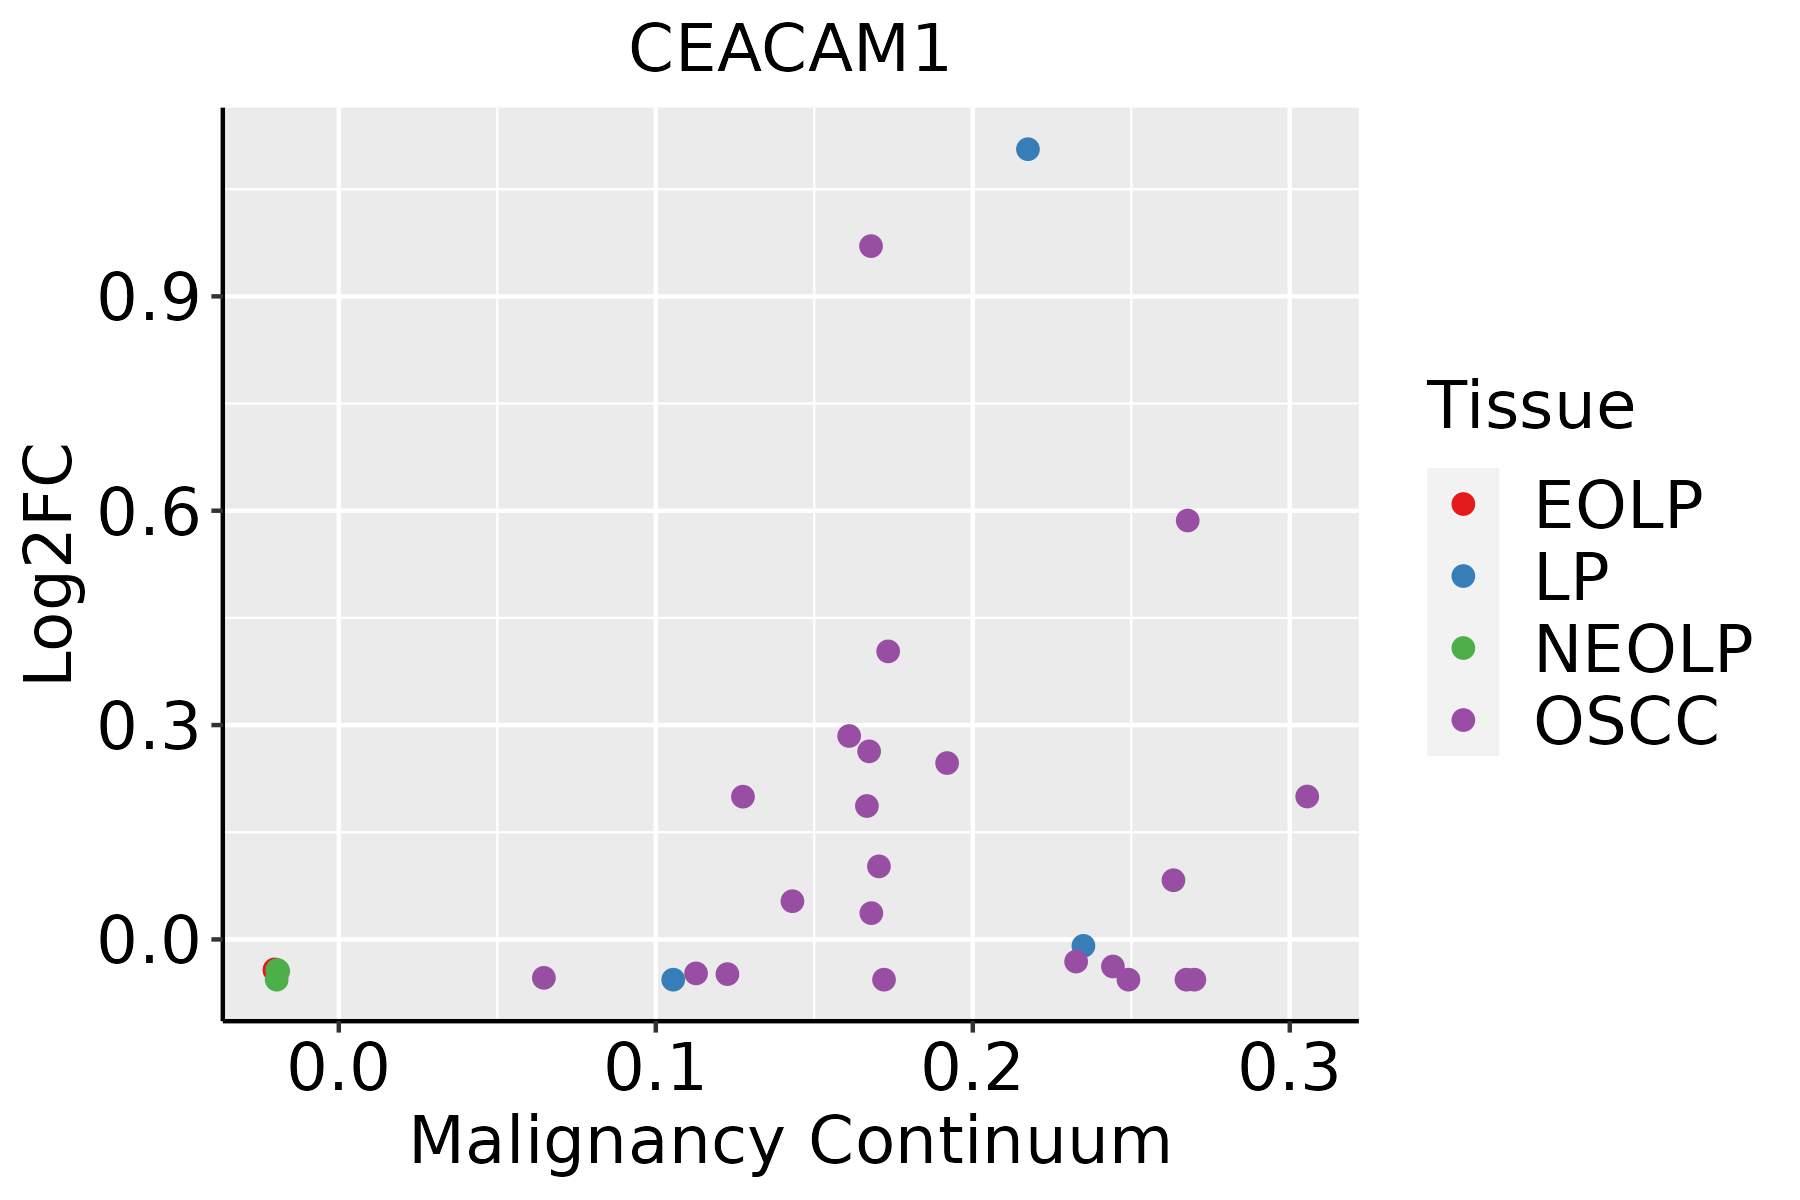 | EOLP: Erosive Oral lichen planus |
| LP: leukoplakia | ||
| NEOLP: Non-erosive oral lichen planus | ||
| OSCC: Oral squamous cell carcinoma | ||
| Prostate | 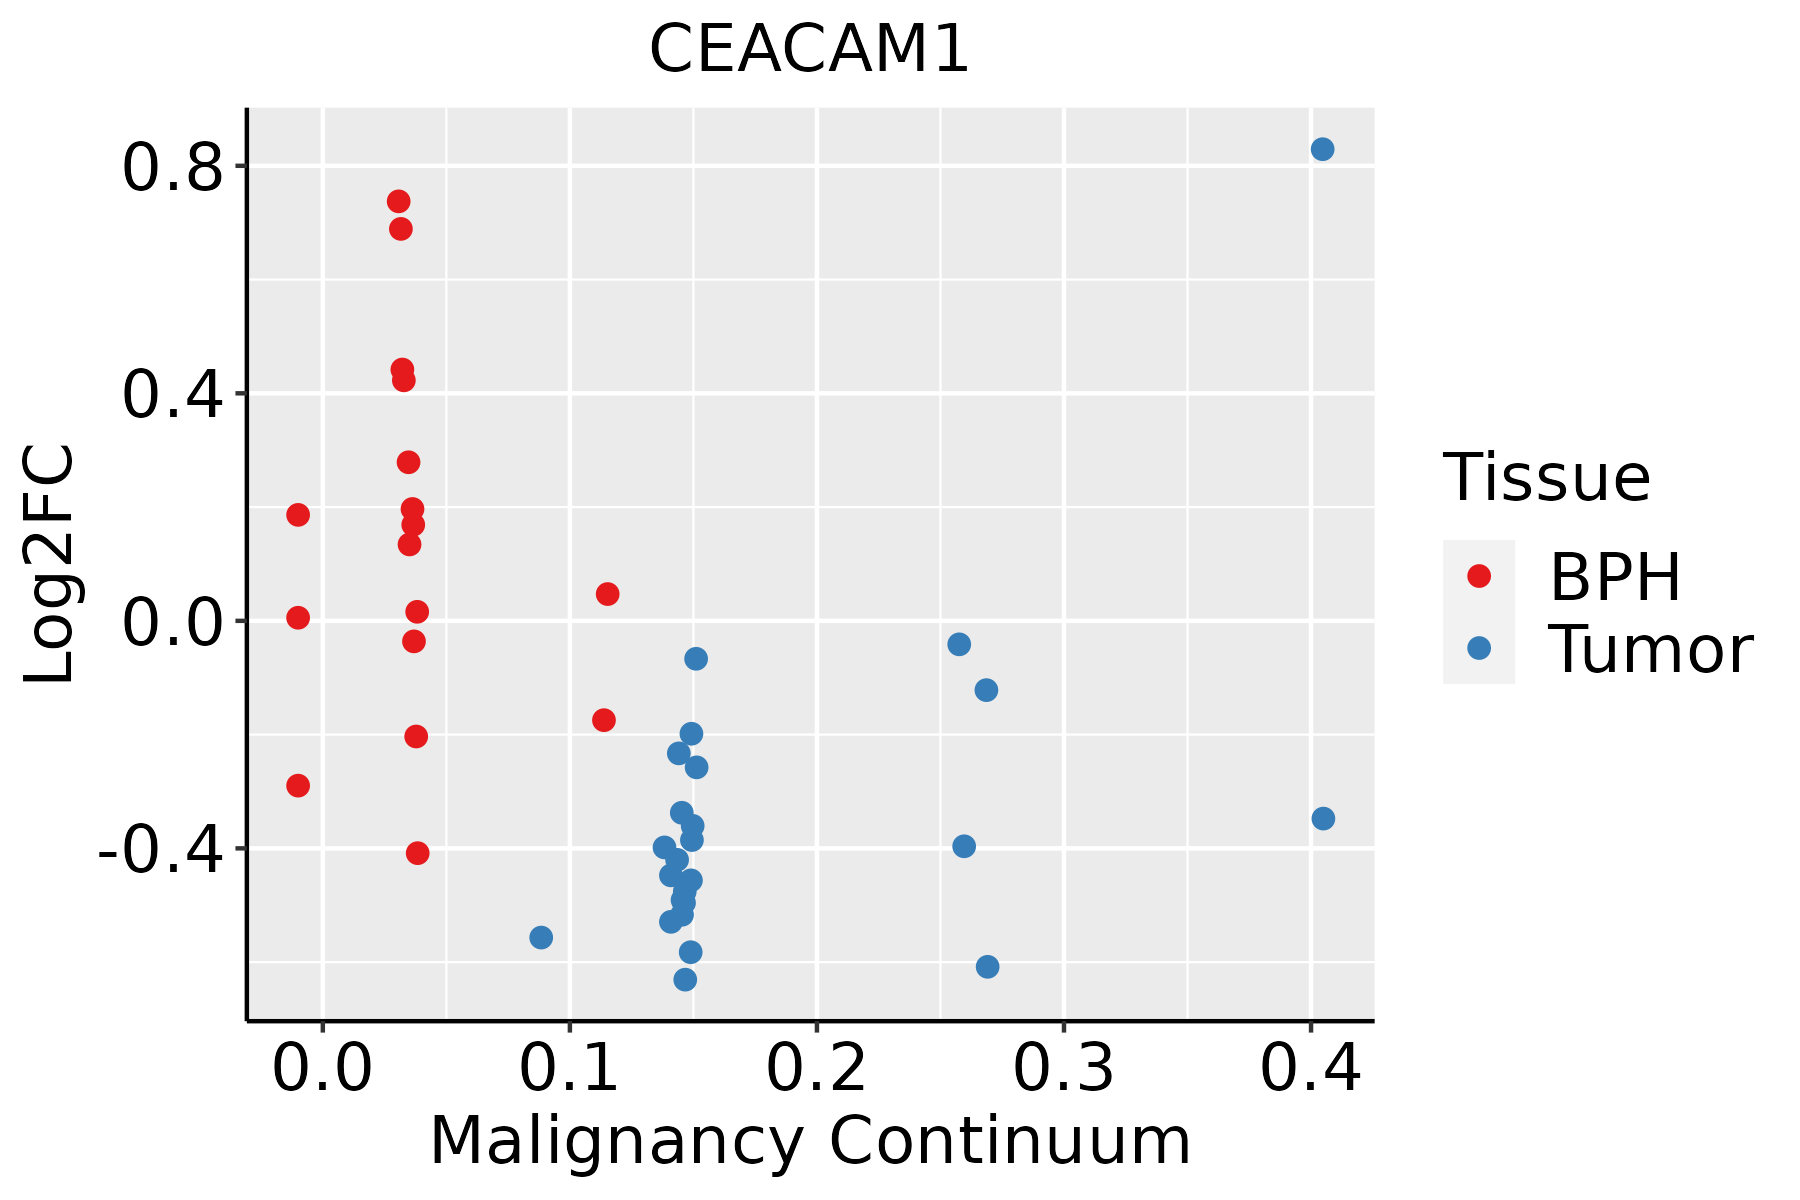 | BPH: Benign Prostatic Hyperplasia |
| ∗log2FC in expression of this searched gene in stem-like cells from each diseased tissue sample relative to stem-like cells in normal samples in each tissue plotted against the malignancy continuum. Samples are colored based on if they are from different disease stage. |
Top |
Malignant transformation related pathway analysis |
| Find out the enriched GO biological processes and KEGG pathways involved in transition from healthy to precancer to cancer |
| Tissue | Disease Stage | Enriched GO biological Processes |
| Colorectum | AD |  |
| Colorectum | SER |  |
| Colorectum | MSS |  |
| Colorectum | MSI-H |  |
| Colorectum | FAP |  |
| ∗Top 15 enriched GO BP terms are showed in the bar plot of each disease state in each tissue. Each row represents a significant GO biological process which is colored according to the -log10(p.adjust). |
| Page: 1 2 3 4 5 6 7 8 9 |
| GO ID | Tissue | Disease Stage | Description | Gene Ratio | Bg Ratio | pvalue | p.adjust | Count |
| GO:004206018 | Prostate | BPH | wound healing | 123/3107 | 422/18723 | 5.74e-11 | 3.59e-09 | 123 |
| GO:004593618 | Prostate | BPH | negative regulation of phosphate metabolic process | 124/3107 | 441/18723 | 5.95e-10 | 2.90e-08 | 124 |
| GO:001056318 | Prostate | BPH | negative regulation of phosphorus metabolic process | 124/3107 | 442/18723 | 6.94e-10 | 3.25e-08 | 124 |
| GO:004873218 | Prostate | BPH | gland development | 122/3107 | 436/18723 | 1.13e-09 | 5.01e-08 | 122 |
| GO:004232617 | Prostate | BPH | negative regulation of phosphorylation | 110/3107 | 385/18723 | 2.08e-09 | 8.35e-08 | 110 |
| GO:190165310 | Prostate | BPH | cellular response to peptide | 104/3107 | 359/18723 | 2.51e-09 | 1.00e-07 | 104 |
| GO:000155810 | Prostate | BPH | regulation of cell growth | 116/3107 | 414/18723 | 2.66e-09 | 1.05e-07 | 116 |
| GO:009013216 | Prostate | BPH | epithelium migration | 104/3107 | 360/18723 | 2.96e-09 | 1.15e-07 | 104 |
| GO:009013016 | Prostate | BPH | tissue migration | 105/3107 | 365/18723 | 3.21e-09 | 1.24e-07 | 105 |
| GO:001063116 | Prostate | BPH | epithelial cell migration | 103/3107 | 357/18723 | 3.80e-09 | 1.44e-07 | 103 |
| GO:000166717 | Prostate | BPH | ameboidal-type cell migration | 128/3107 | 475/18723 | 5.69e-09 | 2.05e-07 | 128 |
| GO:001063216 | Prostate | BPH | regulation of epithelial cell migration | 87/3107 | 292/18723 | 1.18e-08 | 3.87e-07 | 87 |
| GO:000193317 | Prostate | BPH | negative regulation of protein phosphorylation | 97/3107 | 342/18723 | 2.74e-08 | 8.11e-07 | 97 |
| GO:000315814 | Prostate | BPH | endothelium development | 49/3107 | 136/18723 | 3.17e-08 | 9.07e-07 | 49 |
| GO:00506739 | Prostate | BPH | epithelial cell proliferation | 116/3107 | 437/18723 | 7.12e-08 | 1.85e-06 | 116 |
| GO:00506789 | Prostate | BPH | regulation of epithelial cell proliferation | 104/3107 | 381/18723 | 7.52e-08 | 1.92e-06 | 104 |
| GO:00454468 | Prostate | BPH | endothelial cell differentiation | 43/3107 | 118/18723 | 1.49e-07 | 3.46e-06 | 43 |
| GO:005134818 | Prostate | BPH | negative regulation of transferase activity | 78/3107 | 268/18723 | 1.94e-07 | 4.29e-06 | 78 |
| GO:00443195 | Prostate | BPH | wound healing, spreading of cells | 19/3107 | 34/18723 | 2.09e-07 | 4.59e-06 | 19 |
| GO:00905055 | Prostate | BPH | epiboly involved in wound healing | 19/3107 | 34/18723 | 2.09e-07 | 4.59e-06 | 19 |
| Page: 1 2 3 4 5 6 7 8 9 10 11 12 13 14 15 16 17 18 19 20 21 22 23 24 25 26 27 28 29 30 31 32 33 34 35 36 37 38 39 40 |
| Pathway ID | Tissue | Disease Stage | Description | Gene Ratio | Bg Ratio | pvalue | p.adjust | qvalue | Count |
| Page: 1 |
Top |
Cell-cell communication analysis |
| Identification of potential cell-cell interactions between two cell types and their ligand-receptor pairs for different disease states |
| Ligand | Receptor | LRpair | Pathway | Tissue | Disease Stage |
| CD209 | CEACAM1 | CD209_CEACAM1 | CEACAM | Breast | Healthy |
| SELE | CEACAM1 | SELE_CEACAM1 | CEACAM | Breast | Healthy |
| CEACAM1 | CEACAM5 | CEACAM1_CEACAM5 | CEACAM | Cervix | CC |
| SELE | CEACAM1 | SELE_CEACAM1 | CEACAM | Cervix | CC |
| CEACAM1 | CEACAM5 | CEACAM1_CEACAM5 | CEACAM | CRC | ADJ |
| CD209 | CEACAM1 | CD209_CEACAM1 | CEACAM | CRC | MSI-H |
| CEACAM1 | CEACAM5 | CEACAM1_CEACAM5 | CEACAM | CRC | MSI-H |
| CEACAM1 | CEACAM5 | CEACAM1_CEACAM5 | CEACAM | CRC | MSS |
| CD209 | CEACAM1 | CD209_CEACAM1 | CEACAM | CRC | SER |
| CEACAM1 | CEACAM5 | CEACAM1_CEACAM5 | CEACAM | CRC | SER |
| CEACAM1 | CEACAM5 | CEACAM1_CEACAM5 | CEACAM | Esophagus | ADJ |
| SELE | CEACAM1 | SELE_CEACAM1 | CEACAM | Esophagus | ESCC |
| CEACAM1 | CEACAM5 | CEACAM1_CEACAM5 | CEACAM | HNSCC | ADJ |
| SELE | CEACAM1 | SELE_CEACAM1 | CEACAM | HNSCC | ADJ |
| SELE | CEACAM1 | SELE_CEACAM1 | CEACAM | HNSCC | Healthy |
| CD209 | CEACAM1 | CD209_CEACAM1 | CEACAM | HNSCC | OSCC |
| CEACAM1 | CEACAM5 | CEACAM1_CEACAM5 | CEACAM | HNSCC | OSCC |
| SELE | CEACAM1 | SELE_CEACAM1 | CEACAM | HNSCC | OSCC |
| SELE | CEACAM1 | SELE_CEACAM1 | CEACAM | HNSCC | Precancer |
| CEACAM1 | CEACAM5 | CEACAM1_CEACAM5 | CEACAM | Lung | MIAC |
| Page: 1 |
Top |
Single-cell gene regulatory network inference analysis |
| Find out the significant the regulons (TFs) and the target genes of each regulon across cell types for different disease states |
| TF | Cell Type | Tissue | Disease Stage | Target Gene | RSS | Regulon Activity |
| ∗The dot plots of a searched regulon are shown for all cell subpopulations in each disease state of each tissue based on the regulon specific score inferred using pySCENIC and by calculating the average expression. |
| Page: 1 |
Top |
Somatic mutation of malignant transformation related genes |
| Annotation of somatic variants for genes involved in malignant transformation |
| Hugo Symbol | Variant Class | Variant Classification | dbSNP RS | HGVSc | HGVSp | HGVSp Short | SWISSPROT | BIOTYPE | SIFT | PolyPhen | Tumor Sample Barcode | Tissue | Histology | Sex | Age | Stage | Therapy Types | Drugs | Outcome |
| CEACAM1 | SNV | Missense_Mutation | novel | c.1110N>C | p.Glu370Asp | p.E370D | P13688 | protein_coding | tolerated(0.67) | benign(0.05) | TCGA-3C-AALI-01 | Breast | breast invasive carcinoma | Female | <65 | I/II | Unspecific | Poly E | Complete Response |
| CEACAM1 | insertion | Nonsense_Mutation | novel | c.592_593insCTTAGTTGGTTTTTTTTGGTT | p.Arg198delinsThrTerLeuValPhePheGlyTrp | p.R198delinsT*LVFFGW | P13688 | protein_coding | TCGA-AN-A0FK-01 | Breast | breast invasive carcinoma | Female | >=65 | III/IV | Unknown | Unknown | SD | ||
| CEACAM1 | deletion | Frame_Shift_Del | novel | c.235delN | p.Ile79LeufsTer2 | p.I79Lfs*2 | P13688 | protein_coding | TCGA-D8-A27V-01 | Breast | breast invasive carcinoma | Female | <65 | I/II | Hormone Therapy | tamoxiphen | SD | ||
| CEACAM1 | SNV | Missense_Mutation | novel | c.1332N>G | p.Ile444Met | p.I444M | P13688 | protein_coding | tolerated(0.08) | possibly_damaging(0.605) | TCGA-2W-A8YY-01 | Cervix | cervical & endocervical cancer | Female | <65 | I/II | Chemotherapy | cisplatin | CR |
| CEACAM1 | SNV | Missense_Mutation | rs150099950 | c.944N>T | p.Thr315Met | p.T315M | P13688 | protein_coding | tolerated(0.21) | benign(0.255) | TCGA-2W-A8YY-01 | Cervix | cervical & endocervical cancer | Female | <65 | I/II | Chemotherapy | cisplatin | CR |
| CEACAM1 | SNV | Missense_Mutation | c.29N>C | p.Arg10Thr | p.R10T | P13688 | protein_coding | tolerated(0.06) | possibly_damaging(0.465) | TCGA-VS-A8EI-01 | Cervix | cervical & endocervical cancer | Female | <65 | I/II | Chemotherapy | cisplatin | CR | |
| CEACAM1 | SNV | Missense_Mutation | novel | c.521C>T | p.Thr174Ile | p.T174I | P13688 | protein_coding | tolerated(0.14) | possibly_damaging(0.734) | TCGA-AD-5900-01 | Colorectum | colon adenocarcinoma | Male | >=65 | I/II | Unknown | Unknown | SD |
| CEACAM1 | SNV | Missense_Mutation | c.1080C>A | p.Phe360Leu | p.F360L | P13688 | protein_coding | tolerated(1) | benign(0.015) | TCGA-AG-A01N-01 | Colorectum | rectum adenocarcinoma | Female | >=65 | III/IV | Chemotherapy | capecitabine | SD | |
| CEACAM1 | SNV | Missense_Mutation | novel | c.461C>T | p.Ser154Phe | p.S154F | P13688 | protein_coding | deleterious(0.02) | possibly_damaging(0.838) | TCGA-A5-A0G2-01 | Endometrium | uterine corpus endometrioid carcinoma | Female | <65 | III/IV | Unknown | Unknown | SD |
| CEACAM1 | SNV | Missense_Mutation | rs749934399 | c.89C>T | p.Pro30Leu | p.P30L | P13688 | protein_coding | tolerated(0.4) | benign(0.017) | TCGA-A5-A0G2-01 | Endometrium | uterine corpus endometrioid carcinoma | Female | <65 | III/IV | Unknown | Unknown | SD |
| Page: 1 2 3 4 5 |
Top |
Related drugs of malignant transformation related genes |
| Identification of chemicals and drugs interact with genes involved in malignant transfromation |
| (DGIdb 4.0) |
| Entrez ID | Symbol | Category | Interaction Types | Drug Claim Name | Drug Name | PMIDs |
| 634 | CEACAM1 | KINASE, CELL SURFACE, DRUGGABLE GENOME | CHEMOKINES | 15937057 | ||
| 634 | CEACAM1 | KINASE, CELL SURFACE, DRUGGABLE GENOME | ARCITUMOMAB | ARCITUMOMAB | ||
| 634 | CEACAM1 | KINASE, CELL SURFACE, DRUGGABLE GENOME | RETINOID | 8609714 | ||
| 634 | CEACAM1 | KINASE, CELL SURFACE, DRUGGABLE GENOME | RETINOIC ACID | 15364113 | ||
| 634 | CEACAM1 | KINASE, CELL SURFACE, DRUGGABLE GENOME | ARCITUMOMAB | ARCITUMOMAB |
| Page: 1 |

Copyright 2023-Present -The University of Texas Health Science Center at Houston |