
|
|||||
|
 | |
| |
| |
| |
| |
| |
|
Gene: BBC3 |
Gene summary for BBC3 |
| Gene information | Species | Human | Gene symbol | BBC3 | Gene ID | 27113 |
| Gene name | BCL2 binding component 3 | |
| Gene Alias | JFY-1 | |
| Cytomap | 19q13.32 | |
| Gene Type | protein-coding | GO ID | GO:0001836 | UniProtAcc | Q96PG8 |
Top |
Malignant transformation analysis |
| Identification of the aberrant gene expression in precancerous and cancerous lesions by comparing the gene expression of stem-like cells in diseased tissues with normal stem cells |
| Entrez ID | Symbol | Replicates | Species | Organ | Tissue | Adj P-value | Log2FC | Malignancy |
| 27113 | BBC3 | GSM4909281 | Human | Breast | IDC | 6.50e-05 | -2.67e-01 | 0.21 |
| 27113 | BBC3 | GSM4909285 | Human | Breast | IDC | 6.22e-09 | -3.35e-01 | 0.21 |
| 27113 | BBC3 | GSM4909286 | Human | Breast | IDC | 7.26e-04 | -2.49e-01 | 0.1081 |
| 27113 | BBC3 | GSM4909290 | Human | Breast | IDC | 1.44e-07 | -3.41e-01 | 0.2096 |
| 27113 | BBC3 | GSM4909293 | Human | Breast | IDC | 1.02e-02 | -2.28e-01 | 0.1581 |
| 27113 | BBC3 | GSM4909294 | Human | Breast | IDC | 5.22e-18 | -3.43e-01 | 0.2022 |
| 27113 | BBC3 | GSM4909296 | Human | Breast | IDC | 2.56e-12 | -2.90e-01 | 0.1524 |
| 27113 | BBC3 | GSM4909297 | Human | Breast | IDC | 1.39e-10 | -2.78e-01 | 0.1517 |
| 27113 | BBC3 | GSM4909301 | Human | Breast | IDC | 8.95e-08 | -2.92e-01 | 0.1577 |
| 27113 | BBC3 | GSM4909304 | Human | Breast | IDC | 7.25e-13 | -3.44e-01 | 0.1636 |
| 27113 | BBC3 | GSM4909306 | Human | Breast | IDC | 1.28e-02 | -2.35e-01 | 0.1564 |
| 27113 | BBC3 | GSM4909307 | Human | Breast | IDC | 2.56e-05 | -2.88e-01 | 0.1569 |
| 27113 | BBC3 | GSM4909308 | Human | Breast | IDC | 1.79e-03 | -2.52e-01 | 0.158 |
| 27113 | BBC3 | GSM4909309 | Human | Breast | IDC | 3.57e-02 | -1.93e-01 | 0.0483 |
| 27113 | BBC3 | GSM4909311 | Human | Breast | IDC | 1.67e-20 | -3.37e-01 | 0.1534 |
| 27113 | BBC3 | GSM4909312 | Human | Breast | IDC | 1.88e-12 | -3.23e-01 | 0.1552 |
| 27113 | BBC3 | GSM4909319 | Human | Breast | IDC | 5.40e-18 | -3.60e-01 | 0.1563 |
| 27113 | BBC3 | GSM4909320 | Human | Breast | IDC | 4.49e-04 | -3.44e-01 | 0.1575 |
| 27113 | BBC3 | GSM4909321 | Human | Breast | IDC | 2.08e-12 | -2.54e-01 | 0.1559 |
| 27113 | BBC3 | ctrl6 | Human | Breast | Precancer | 7.52e-03 | 4.74e-01 | -0.0061 |
| Page: 1 2 3 4 5 6 7 8 |
| Tissue | Expression Dynamics | Abbreviation |
| Breast |  | IDC: Invasive ductal carcinoma |
| DCIS: Ductal carcinoma in situ | ||
| Precancer(BRCA1-mut): Precancerous lesion from BRCA1 mutation carriers | ||
| Colorectum (GSE201348) |  | FAP: Familial adenomatous polyposis |
| CRC: Colorectal cancer | ||
| Colorectum (HTA11) | 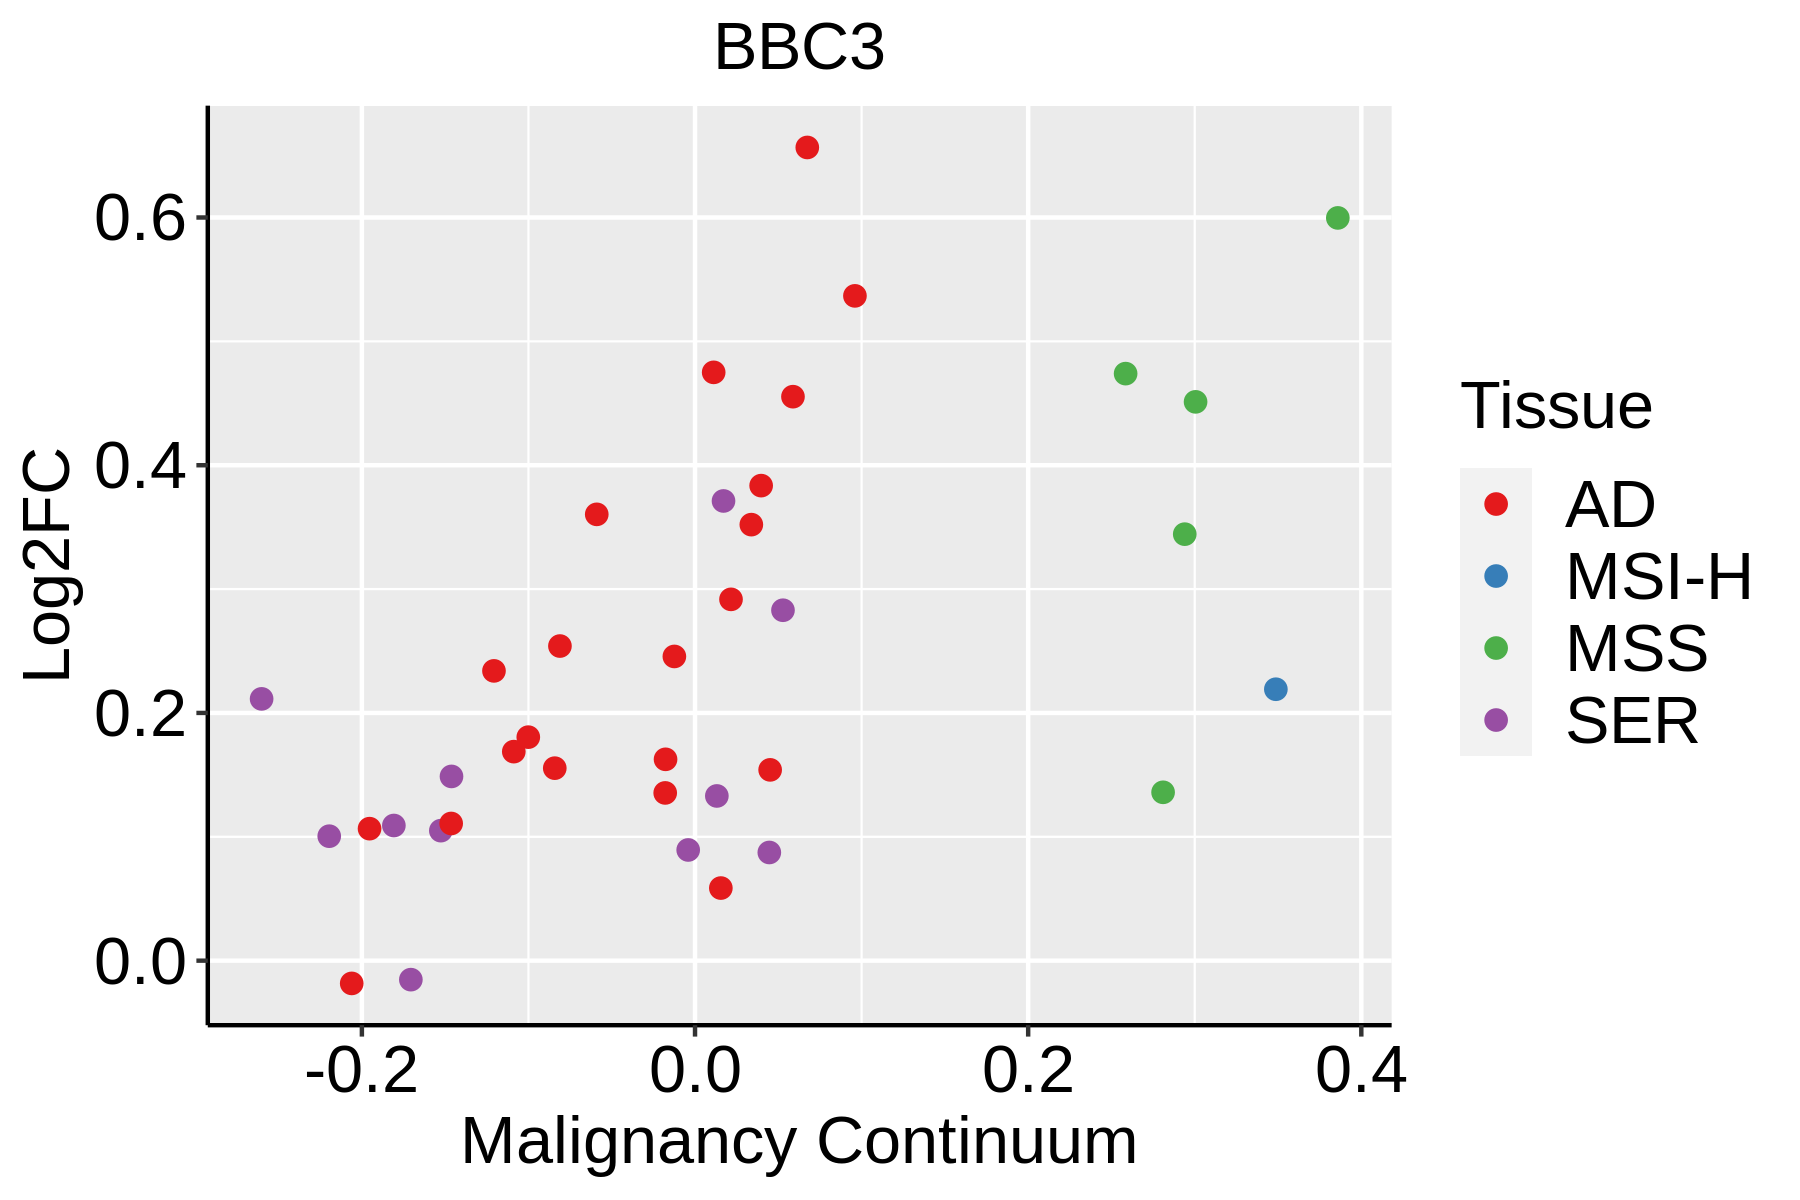 | AD: Adenomas |
| SER: Sessile serrated lesions | ||
| MSI-H: Microsatellite-high colorectal cancer | ||
| MSS: Microsatellite stable colorectal cancer | ||
| Esophagus | 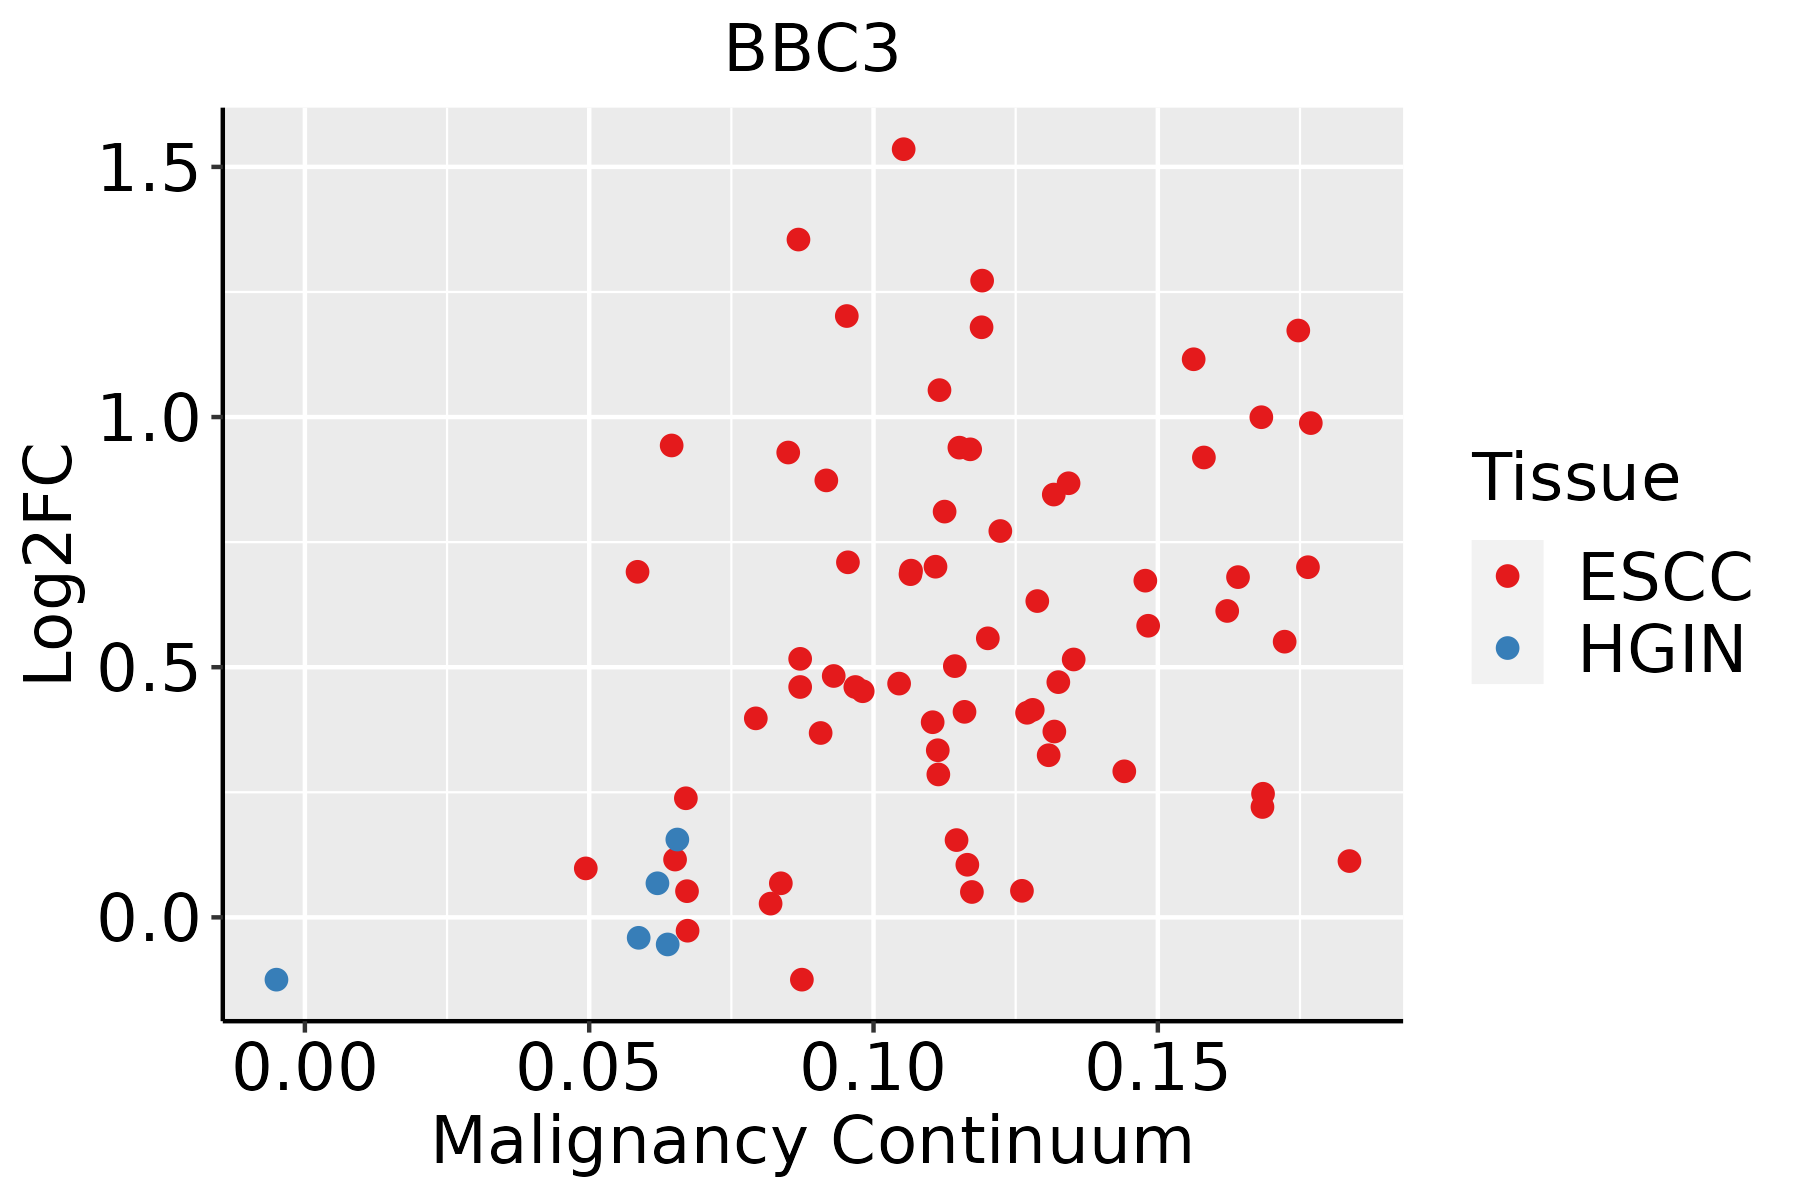 | ESCC: Esophageal squamous cell carcinoma |
| HGIN: High-grade intraepithelial neoplasias | ||
| LGIN: Low-grade intraepithelial neoplasias | ||
| Liver |  | HCC: Hepatocellular carcinoma |
| NAFLD: Non-alcoholic fatty liver disease | ||
| Oral Cavity |  | EOLP: Erosive Oral lichen planus |
| LP: leukoplakia | ||
| NEOLP: Non-erosive oral lichen planus | ||
| OSCC: Oral squamous cell carcinoma | ||
| Prostate | 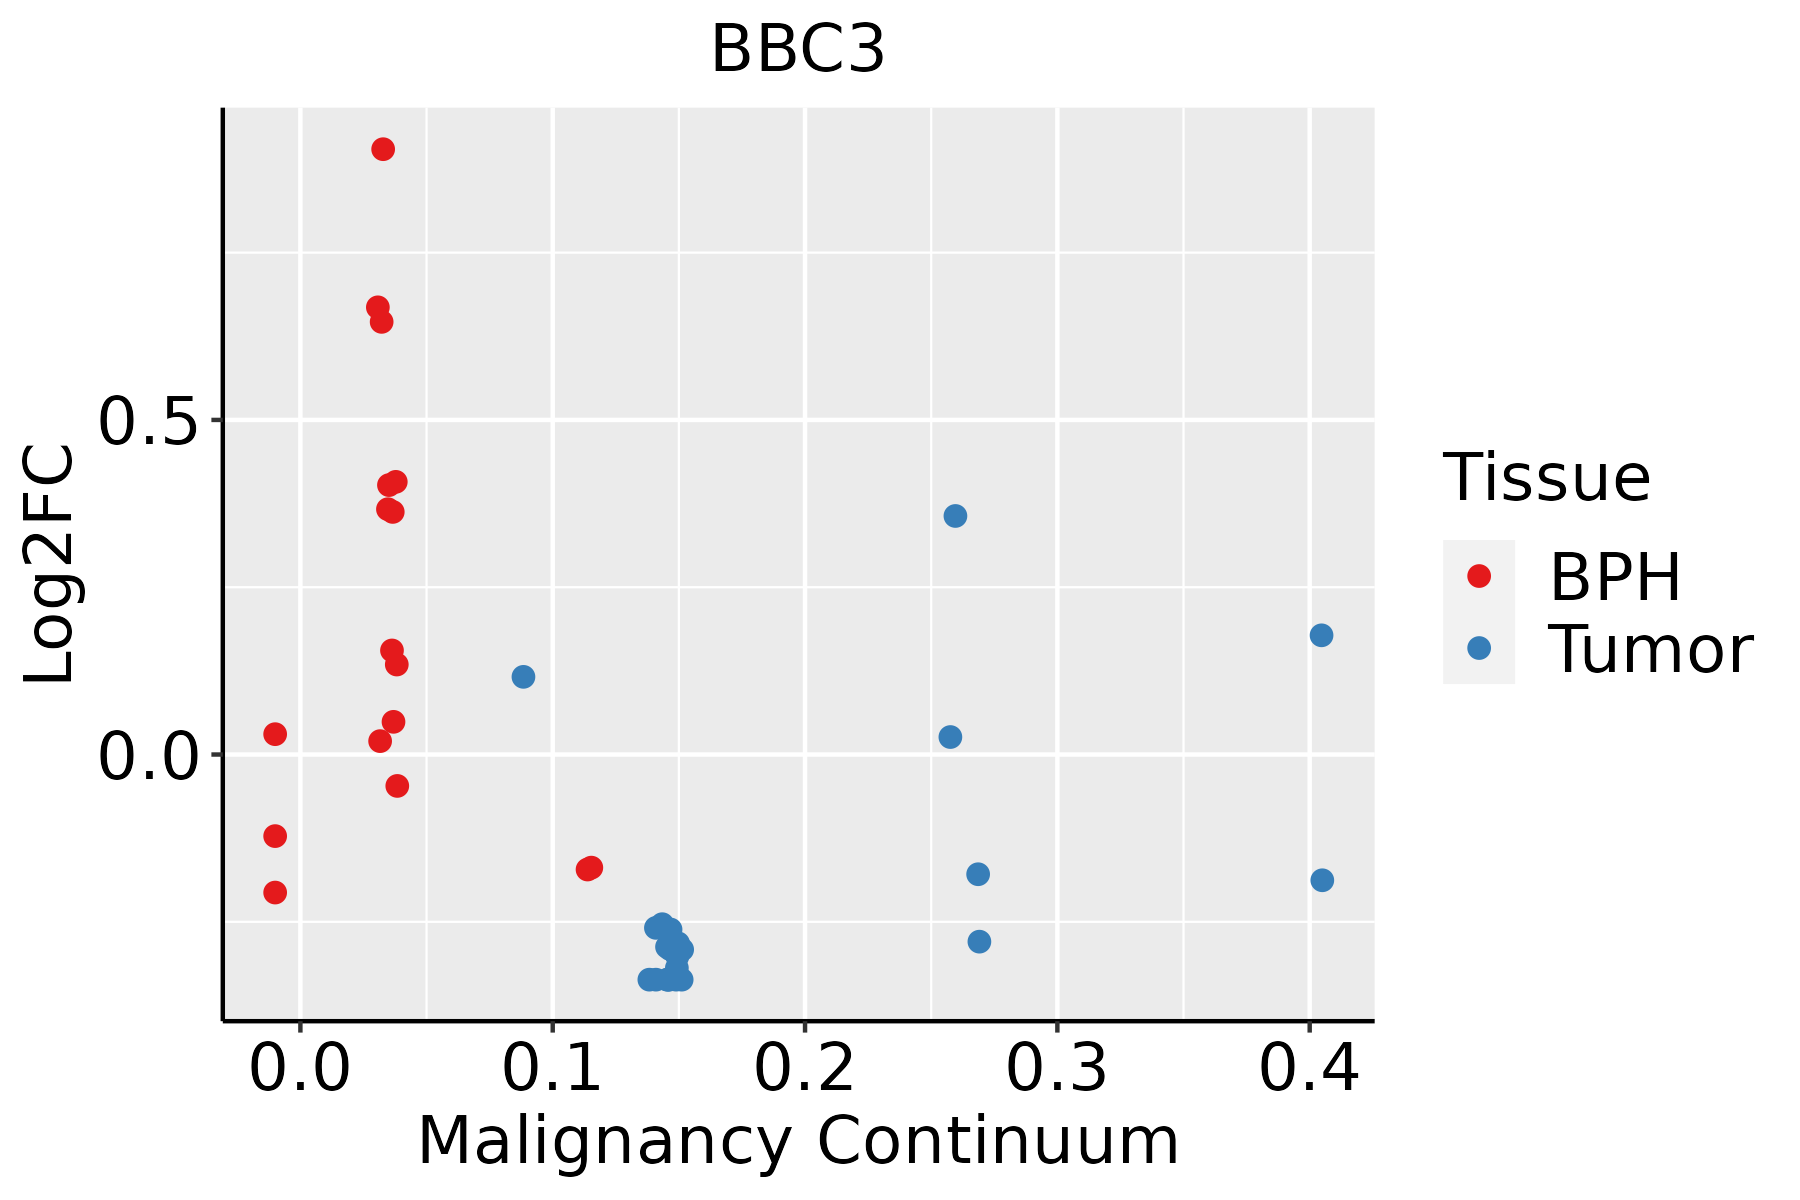 | BPH: Benign Prostatic Hyperplasia |
| Thyroid | 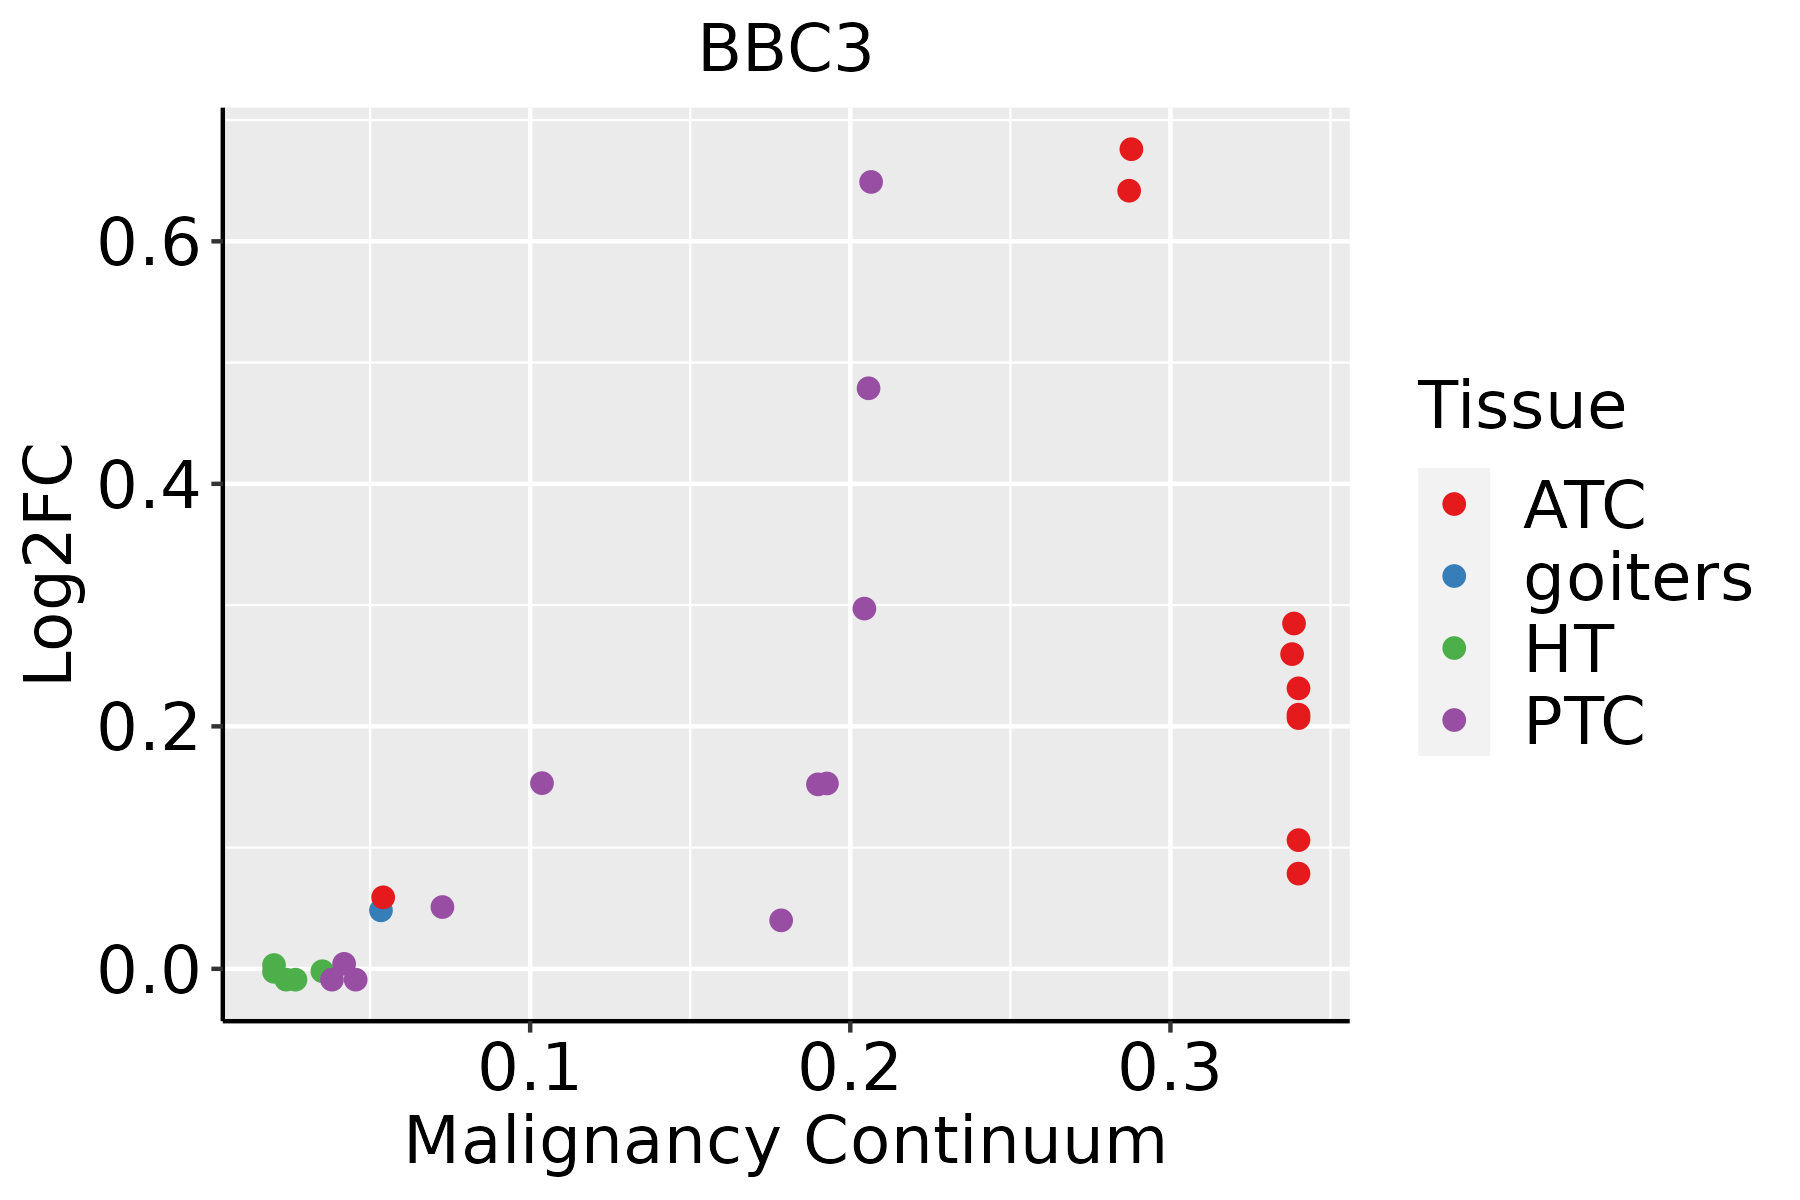 | ATC: Anaplastic thyroid cancer |
| HT: Hashimoto's thyroiditis | ||
| PTC: Papillary thyroid cancer |
| ∗log2FC in expression of this searched gene in stem-like cells from each diseased tissue sample relative to stem-like cells in normal samples in each tissue plotted against the malignancy continuum. Samples are colored based on if they are from different disease stage. |
Top |
Malignant transformation related pathway analysis |
| Find out the enriched GO biological processes and KEGG pathways involved in transition from healthy to precancer to cancer |
| Tissue | Disease Stage | Enriched GO biological Processes |
| Colorectum | AD |  |
| Colorectum | SER |  |
| Colorectum | MSS |  |
| Colorectum | MSI-H |  |
| Colorectum | FAP |  |
| ∗Top 15 enriched GO BP terms are showed in the bar plot of each disease state in each tissue. Each row represents a significant GO biological process which is colored according to the -log10(p.adjust). |
| Page: 1 2 3 4 5 6 7 8 9 |
| GO ID | Tissue | Disease Stage | Description | Gene Ratio | Bg Ratio | pvalue | p.adjust | Count |
| GO:009719335 | Thyroid | ATC | intrinsic apoptotic signaling pathway | 171/6293 | 288/18723 | 1.86e-19 | 2.67e-17 | 171 |
| GO:009031624 | Thyroid | ATC | positive regulation of intracellular protein transport | 107/6293 | 160/18723 | 6.82e-18 | 7.84e-16 | 107 |
| GO:000683929 | Thyroid | ATC | mitochondrial transport | 151/6293 | 254/18723 | 2.07e-17 | 2.14e-15 | 151 |
| GO:004586234 | Thyroid | ATC | positive regulation of proteolysis | 202/6293 | 372/18723 | 1.07e-16 | 9.42e-15 | 202 |
| GO:190495128 | Thyroid | ATC | positive regulation of establishment of protein localization | 177/6293 | 319/18723 | 5.43e-16 | 4.29e-14 | 177 |
| GO:009015031 | Thyroid | ATC | establishment of protein localization to membrane | 150/6293 | 260/18723 | 1.05e-15 | 7.96e-14 | 150 |
| GO:200124233 | Thyroid | ATC | regulation of intrinsic apoptotic signaling pathway | 103/6293 | 164/18723 | 1.67e-14 | 9.77e-13 | 103 |
| GO:005122234 | Thyroid | ATC | positive regulation of protein transport | 165/6293 | 303/18723 | 4.94e-14 | 2.69e-12 | 165 |
| GO:007058533 | Thyroid | ATC | protein localization to mitochondrion | 83/6293 | 125/18723 | 6.24e-14 | 3.37e-12 | 83 |
| GO:007265533 | Thyroid | ATC | establishment of protein localization to mitochondrion | 80/6293 | 120/18723 | 1.27e-13 | 6.46e-12 | 80 |
| GO:1905475111 | Thyroid | ATC | regulation of protein localization to membrane | 96/6293 | 175/18723 | 5.55e-09 | 1.22e-07 | 96 |
| GO:0010821112 | Thyroid | ATC | regulation of mitochondrion organization | 82/6293 | 144/18723 | 7.15e-09 | 1.54e-07 | 82 |
| GO:0007006111 | Thyroid | ATC | mitochondrial membrane organization | 69/6293 | 116/18723 | 9.55e-09 | 2.00e-07 | 69 |
| GO:200123528 | Thyroid | ATC | positive regulation of apoptotic signaling pathway | 73/6293 | 126/18723 | 1.74e-08 | 3.47e-07 | 73 |
| GO:0070059113 | Thyroid | ATC | intrinsic apoptotic signaling pathway in response to endoplasmic reticulum stress | 43/6293 | 63/18723 | 1.98e-08 | 3.90e-07 | 43 |
| GO:190374722 | Thyroid | ATC | regulation of establishment of protein localization to mitochondrion | 36/6293 | 50/18723 | 3.21e-08 | 6.00e-07 | 36 |
| GO:190374916 | Thyroid | ATC | positive regulation of establishment of protein localization to mitochondrion | 26/6293 | 36/18723 | 2.47e-06 | 2.90e-05 | 26 |
| GO:004328133 | Thyroid | ATC | regulation of cysteine-type endopeptidase activity involved in apoptotic process | 102/6293 | 209/18723 | 3.61e-06 | 4.03e-05 | 102 |
| GO:0008637112 | Thyroid | ATC | apoptotic mitochondrial changes | 59/6293 | 107/18723 | 3.69e-06 | 4.10e-05 | 59 |
| GO:1905477111 | Thyroid | ATC | positive regulation of protein localization to membrane | 58/6293 | 106/18723 | 6.14e-06 | 6.42e-05 | 58 |
| Page: 1 2 3 4 5 6 7 8 9 10 11 12 13 14 15 16 17 18 19 20 21 22 23 24 25 26 27 28 29 30 31 32 33 34 |
| Pathway ID | Tissue | Disease Stage | Description | Gene Ratio | Bg Ratio | pvalue | p.adjust | qvalue | Count |
| hsa0501616 | Breast | Precancer | Huntington disease | 98/684 | 306/8465 | 2.85e-35 | 2.25e-33 | 1.72e-33 | 98 |
| hsa042108 | Breast | Precancer | Apoptosis | 25/684 | 136/8465 | 7.61e-05 | 6.87e-04 | 5.26e-04 | 25 |
| hsa0501617 | Breast | Precancer | Huntington disease | 98/684 | 306/8465 | 2.85e-35 | 2.25e-33 | 1.72e-33 | 98 |
| hsa0421013 | Breast | Precancer | Apoptosis | 25/684 | 136/8465 | 7.61e-05 | 6.87e-04 | 5.26e-04 | 25 |
| hsa0501623 | Breast | IDC | Huntington disease | 103/867 | 306/8465 | 5.14e-30 | 4.17e-28 | 3.12e-28 | 103 |
| hsa0421022 | Breast | IDC | Apoptosis | 31/867 | 136/8465 | 1.34e-05 | 1.61e-04 | 1.20e-04 | 31 |
| hsa052109 | Breast | IDC | Colorectal cancer | 17/867 | 86/8465 | 5.70e-03 | 3.13e-02 | 2.34e-02 | 17 |
| hsa0501633 | Breast | IDC | Huntington disease | 103/867 | 306/8465 | 5.14e-30 | 4.17e-28 | 3.12e-28 | 103 |
| hsa0421032 | Breast | IDC | Apoptosis | 31/867 | 136/8465 | 1.34e-05 | 1.61e-04 | 1.20e-04 | 31 |
| hsa0521014 | Breast | IDC | Colorectal cancer | 17/867 | 86/8465 | 5.70e-03 | 3.13e-02 | 2.34e-02 | 17 |
| hsa0501643 | Breast | DCIS | Huntington disease | 101/846 | 306/8465 | 1.54e-29 | 1.24e-27 | 9.13e-28 | 101 |
| hsa0421041 | Breast | DCIS | Apoptosis | 29/846 | 136/8465 | 5.92e-05 | 5.97e-04 | 4.40e-04 | 29 |
| hsa0411521 | Breast | DCIS | p53 signaling pathway | 16/846 | 74/8465 | 2.23e-03 | 1.47e-02 | 1.08e-02 | 16 |
| hsa0521024 | Breast | DCIS | Colorectal cancer | 16/846 | 86/8465 | 1.03e-02 | 4.50e-02 | 3.32e-02 | 16 |
| hsa0501653 | Breast | DCIS | Huntington disease | 101/846 | 306/8465 | 1.54e-29 | 1.24e-27 | 9.13e-28 | 101 |
| hsa0421051 | Breast | DCIS | Apoptosis | 29/846 | 136/8465 | 5.92e-05 | 5.97e-04 | 4.40e-04 | 29 |
| hsa0411531 | Breast | DCIS | p53 signaling pathway | 16/846 | 74/8465 | 2.23e-03 | 1.47e-02 | 1.08e-02 | 16 |
| hsa0521034 | Breast | DCIS | Colorectal cancer | 16/846 | 86/8465 | 1.03e-02 | 4.50e-02 | 3.32e-02 | 16 |
| hsa05016 | Colorectum | AD | Huntington disease | 147/2092 | 306/8465 | 1.93e-19 | 9.26e-18 | 5.91e-18 | 147 |
| hsa05210 | Colorectum | AD | Colorectal cancer | 35/2092 | 86/8465 | 7.54e-04 | 5.49e-03 | 3.50e-03 | 35 |
| Page: 1 2 3 4 5 6 |
Top |
Cell-cell communication analysis |
| Identification of potential cell-cell interactions between two cell types and their ligand-receptor pairs for different disease states |
| Ligand | Receptor | LRpair | Pathway | Tissue | Disease Stage |
| Page: 1 |
Top |
Single-cell gene regulatory network inference analysis |
| Find out the significant the regulons (TFs) and the target genes of each regulon across cell types for different disease states |
| TF | Cell Type | Tissue | Disease Stage | Target Gene | RSS | Regulon Activity |
| ∗The dot plots of a searched regulon are shown for all cell subpopulations in each disease state of each tissue based on the regulon specific score inferred using pySCENIC and by calculating the average expression. |
| Page: 1 |
Top |
Somatic mutation of malignant transformation related genes |
| Annotation of somatic variants for genes involved in malignant transformation |
| Hugo Symbol | Variant Class | Variant Classification | dbSNP RS | HGVSc | HGVSp | HGVSp Short | SWISSPROT | BIOTYPE | SIFT | PolyPhen | Tumor Sample Barcode | Tissue | Histology | Sex | Age | Stage | Therapy Types | Drugs | Outcome |
| BBC3 | deletion | Frame_Shift_Del | c.667delN | p.Arg223GlufsTer6 | p.R223Efs*6 | Q96PG8 | protein_coding | TCGA-G4-6304-01 | Colorectum | colon adenocarcinoma | Female | >=65 | I/II | Chemotherapy | fluorouracil | PD | |||
| BBC3 | SNV | Missense_Mutation | rs769349350 | c.692G>A | p.Cys231Tyr | p.C231Y | Q96PG8 | protein_coding | tolerated_low_confidence(0.07) | benign(0.005) | TCGA-A5-A0G1-01 | Endometrium | uterine corpus endometrioid carcinoma | Female | >=65 | I/II | Unknown | Unknown | SD |
| BBC3 | SNV | Missense_Mutation | novel | c.649N>G | p.Gln217Glu | p.Q217E | Q96PG8 | protein_coding | deleterious_low_confidence(0.01) | benign(0.085) | TCGA-AJ-A3IA-01 | Endometrium | uterine corpus endometrioid carcinoma | Female | >=65 | I/II | Unknown | Unknown | SD |
| BBC3 | SNV | Missense_Mutation | novel | c.776N>A | p.Cys259Tyr | p.C259Y | Q96PG8 | protein_coding | deleterious_low_confidence(0) | probably_damaging(0.918) | TCGA-AJ-A3NE-01 | Endometrium | uterine corpus endometrioid carcinoma | Female | <65 | I/II | Unknown | Unknown | SD |
| BBC3 | SNV | Missense_Mutation | c.685N>T | p.Gly229Cys | p.G229C | Q96PG8 | protein_coding | deleterious_low_confidence(0) | benign(0.182) | TCGA-AP-A059-01 | Endometrium | uterine corpus endometrioid carcinoma | Female | >=65 | I/II | Unknown | Unknown | SD | |
| BBC3 | SNV | Missense_Mutation | novel | c.84N>G | p.Ile28Met | p.I28M | Q96PG8 | protein_coding | tolerated_low_confidence(0.1) | benign(0.009) | TCGA-E6-A1LX-01 | Endometrium | uterine corpus endometrioid carcinoma | Female | <65 | I/II | Unknown | Unknown | SD |
| BBC3 | deletion | Frame_Shift_Del | novel | c.725delN | p.Gly242AlafsTer48 | p.G242Afs*48 | Q96PG8 | protein_coding | TCGA-DI-A1BU-01 | Endometrium | uterine corpus endometrioid carcinoma | Female | <65 | I/II | Chemotherapy | paclitaxel | SD | ||
| BBC3 | SNV | Missense_Mutation | rs747649341 | c.694A>G | p.Thr232Ala | p.T232A | Q96PG8 | protein_coding | tolerated_low_confidence(0.05) | benign(0.062) | TCGA-69-7973-01 | Lung | lung adenocarcinoma | Female | <65 | I/II | Chemotherapy | cisplatin | SD |
| BBC3 | SNV | Missense_Mutation | rs755414185 | c.698G>A | p.Arg233His | p.R233H | Q96PG8 | protein_coding | deleterious_low_confidence(0.01) | benign(0.044) | TCGA-MP-A4SV-01 | Lung | lung adenocarcinoma | Male | >=65 | I/II | Unknown | Unknown | SD |
| BBC3 | SNV | Missense_Mutation | c.656N>T | p.Pro219Leu | p.P219L | Q96PG8 | protein_coding | deleterious_low_confidence(0) | possibly_damaging(0.625) | TCGA-18-3408-01 | Lung | lung squamous cell carcinoma | Female | >=65 | I/II | Unknown | Unknown | PD |
| Page: 1 2 |
Top |
Related drugs of malignant transformation related genes |
| Identification of chemicals and drugs interact with genes involved in malignant transfromation |
| (DGIdb 4.0) |
| Entrez ID | Symbol | Category | Interaction Types | Drug Claim Name | Drug Name | PMIDs |
| Page: 1 |

Copyright 2023-Present -The University of Texas Health Science Center at Houston |