
|
|||||
|
 | |
| |
| |
| |
| |
| |
|
Gene: TRIM28 |
Gene summary for TRIM28 |
| Gene information | Species | Human | Gene symbol | TRIM28 | Gene ID | 10155 |
| Gene name | tripartite motif containing 28 | |
| Gene Alias | KAP1 | |
| Cytomap | 19q13.43 | |
| Gene Type | protein-coding | GO ID | GO:0000003 | UniProtAcc | Q13263 |
Top |
Malignant transformation analysis |
| Identification of the aberrant gene expression in precancerous and cancerous lesions by comparing the gene expression of stem-like cells in diseased tissues with normal stem cells |
| Entrez ID | Symbol | Replicates | Species | Organ | Tissue | Adj P-value | Log2FC | Malignancy |
| 10155 | TRIM28 | HTA11_3410_2000001011 | Human | Colorectum | AD | 1.82e-62 | 1.20e+00 | 0.0155 |
| 10155 | TRIM28 | HTA11_2487_2000001011 | Human | Colorectum | SER | 6.64e-35 | 1.14e+00 | -0.1808 |
| 10155 | TRIM28 | HTA11_2951_2000001011 | Human | Colorectum | AD | 1.11e-15 | 1.06e+00 | 0.0216 |
| 10155 | TRIM28 | HTA11_1938_2000001011 | Human | Colorectum | AD | 4.78e-37 | 1.28e+00 | -0.0811 |
| 10155 | TRIM28 | HTA11_78_2000001011 | Human | Colorectum | AD | 8.87e-30 | 8.13e-01 | -0.1088 |
| 10155 | TRIM28 | HTA11_347_2000001011 | Human | Colorectum | AD | 6.59e-91 | 1.71e+00 | -0.1954 |
| 10155 | TRIM28 | HTA11_411_2000001011 | Human | Colorectum | SER | 7.50e-21 | 1.52e+00 | -0.2602 |
| 10155 | TRIM28 | HTA11_2112_2000001011 | Human | Colorectum | SER | 8.23e-04 | 7.88e-01 | -0.2196 |
| 10155 | TRIM28 | HTA11_3361_2000001011 | Human | Colorectum | AD | 4.72e-40 | 1.34e+00 | -0.1207 |
| 10155 | TRIM28 | HTA11_83_2000001011 | Human | Colorectum | SER | 4.03e-22 | 1.06e+00 | -0.1526 |
| 10155 | TRIM28 | HTA11_696_2000001011 | Human | Colorectum | AD | 4.07e-65 | 1.45e+00 | -0.1464 |
| 10155 | TRIM28 | HTA11_866_2000001011 | Human | Colorectum | AD | 1.24e-28 | 7.62e-01 | -0.1001 |
| 10155 | TRIM28 | HTA11_1391_2000001011 | Human | Colorectum | AD | 1.66e-56 | 1.48e+00 | -0.059 |
| 10155 | TRIM28 | HTA11_2992_2000001011 | Human | Colorectum | SER | 9.58e-27 | 1.77e+00 | -0.1706 |
| 10155 | TRIM28 | HTA11_5212_2000001011 | Human | Colorectum | AD | 4.00e-24 | 1.51e+00 | -0.2061 |
| 10155 | TRIM28 | HTA11_5216_2000001011 | Human | Colorectum | SER | 1.58e-28 | 1.62e+00 | -0.1462 |
| 10155 | TRIM28 | HTA11_546_2000001011 | Human | Colorectum | AD | 1.00e-30 | 1.42e+00 | -0.0842 |
| 10155 | TRIM28 | HTA11_7862_2000001011 | Human | Colorectum | AD | 2.25e-06 | 4.57e-01 | -0.0179 |
| 10155 | TRIM28 | HTA11_866_3004761011 | Human | Colorectum | AD | 1.89e-43 | 9.38e-01 | 0.096 |
| 10155 | TRIM28 | HTA11_4255_2000001011 | Human | Colorectum | SER | 1.41e-13 | 8.87e-01 | 0.0446 |
| Page: 1 2 3 4 5 6 7 8 9 |
| Tissue | Expression Dynamics | Abbreviation |
| Colorectum (GSE201348) |  | FAP: Familial adenomatous polyposis |
| CRC: Colorectal cancer | ||
| Colorectum (HTA11) |  | AD: Adenomas |
| SER: Sessile serrated lesions | ||
| MSI-H: Microsatellite-high colorectal cancer | ||
| MSS: Microsatellite stable colorectal cancer | ||
| Endometrium | 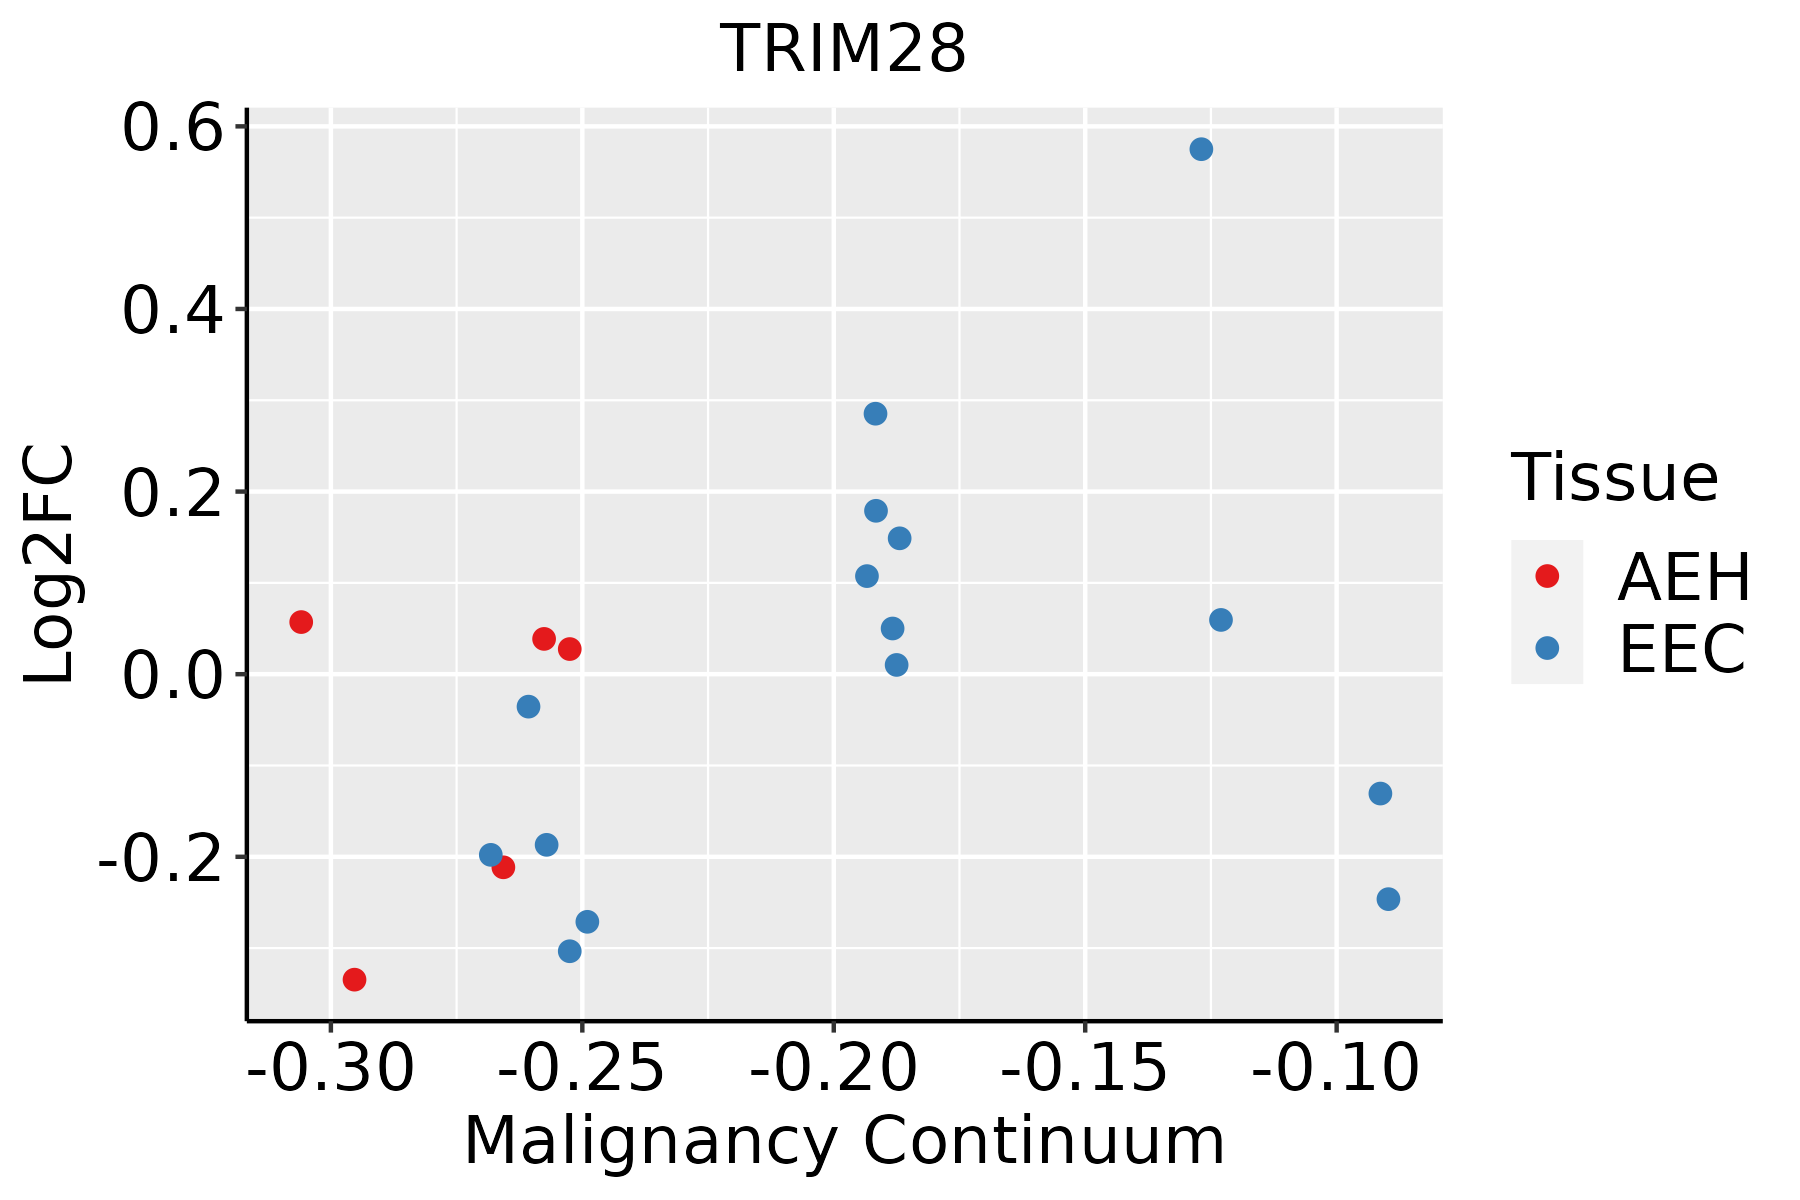 | AEH: Atypical endometrial hyperplasia |
| EEC: Endometrioid Cancer | ||
| Esophagus | 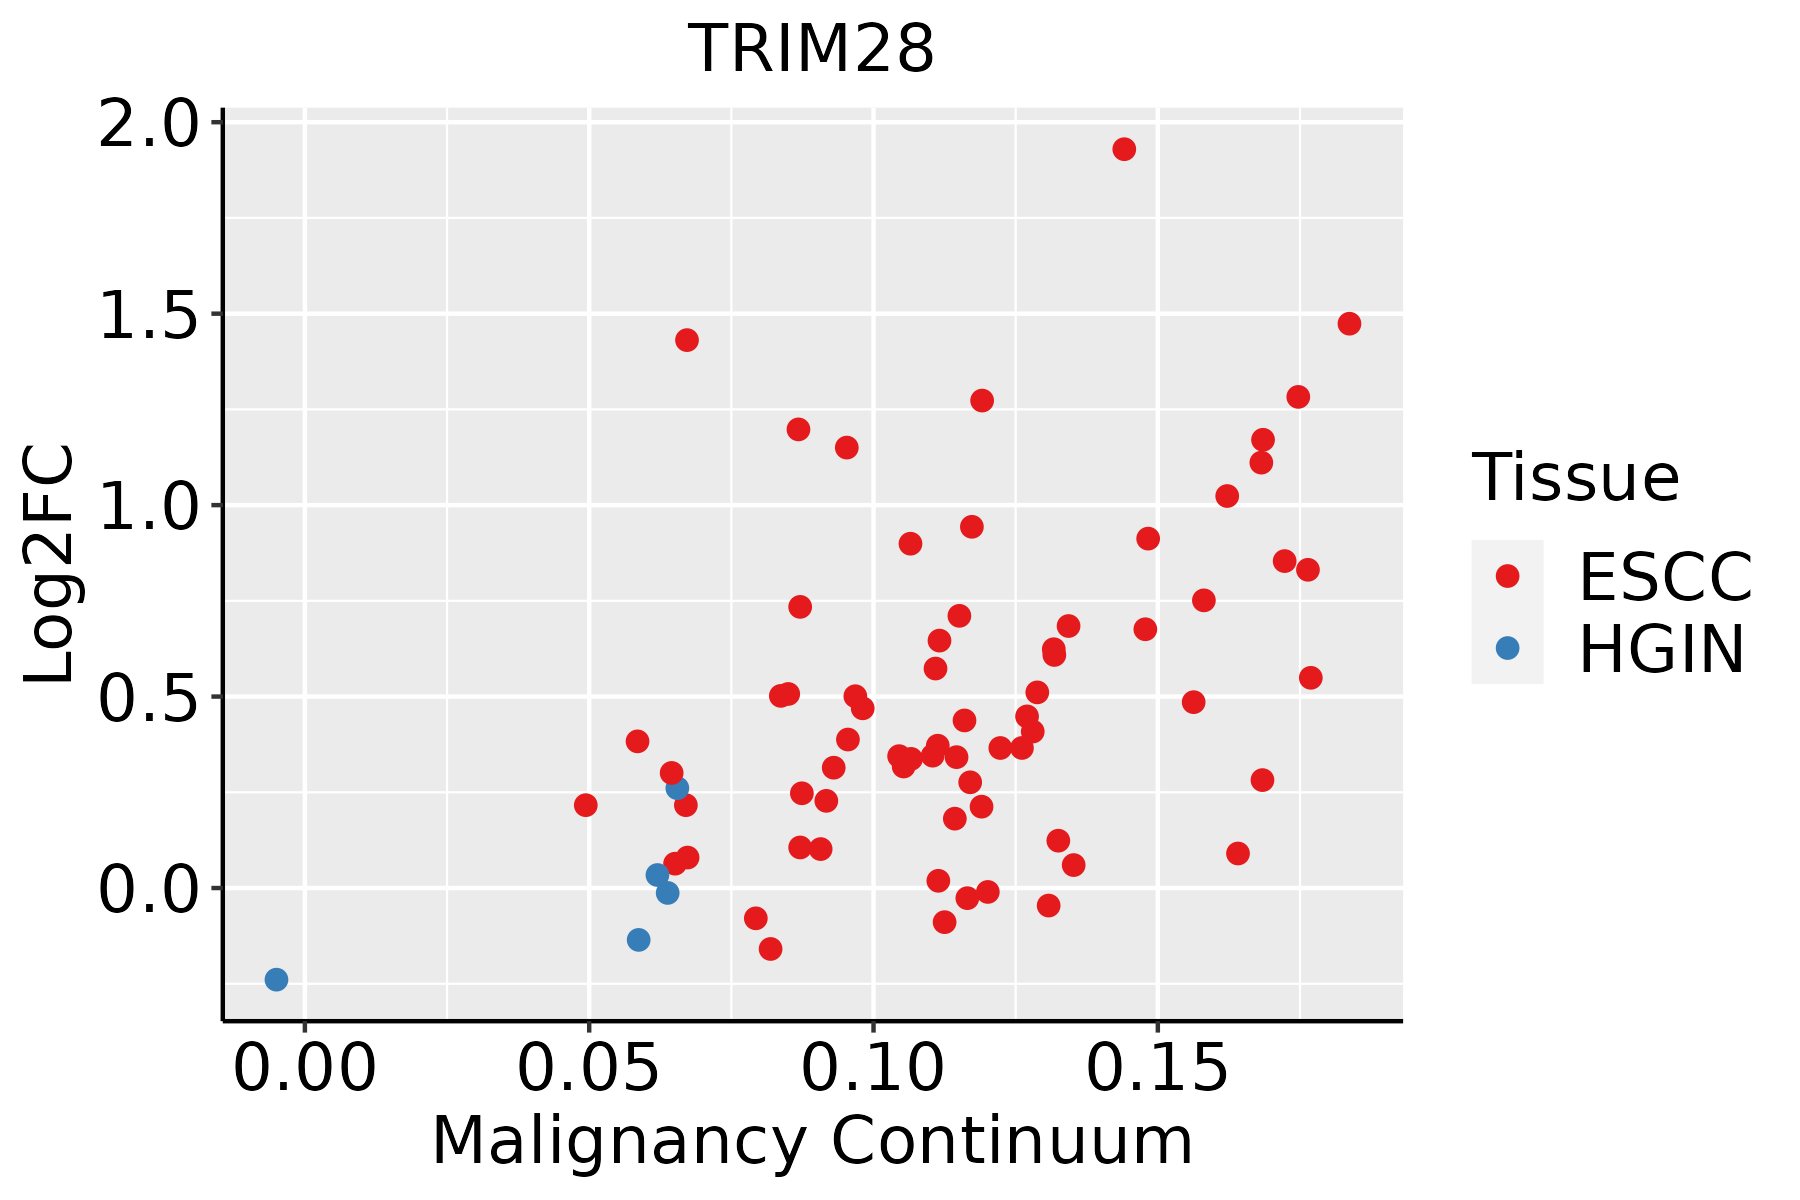 | ESCC: Esophageal squamous cell carcinoma |
| HGIN: High-grade intraepithelial neoplasias | ||
| LGIN: Low-grade intraepithelial neoplasias | ||
| Liver | 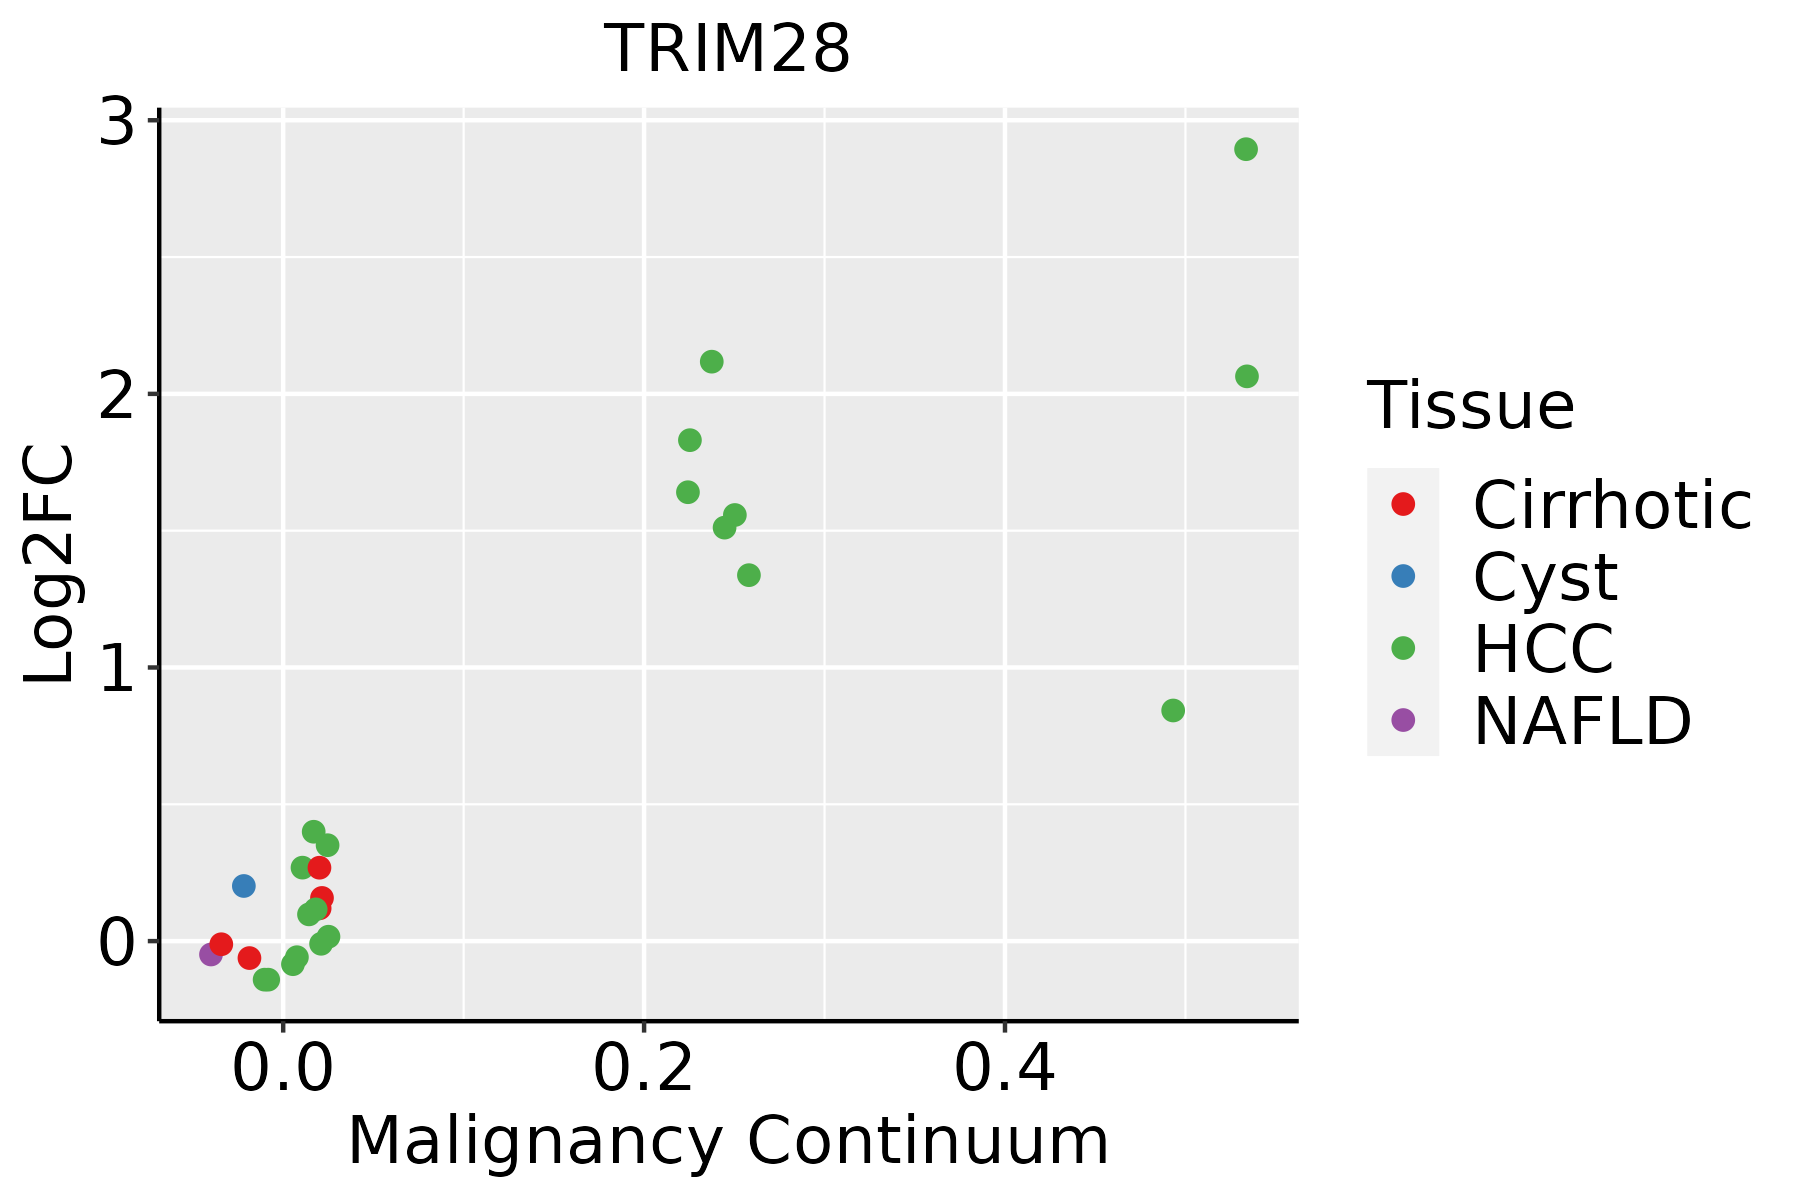 | HCC: Hepatocellular carcinoma |
| NAFLD: Non-alcoholic fatty liver disease | ||
| Lung | 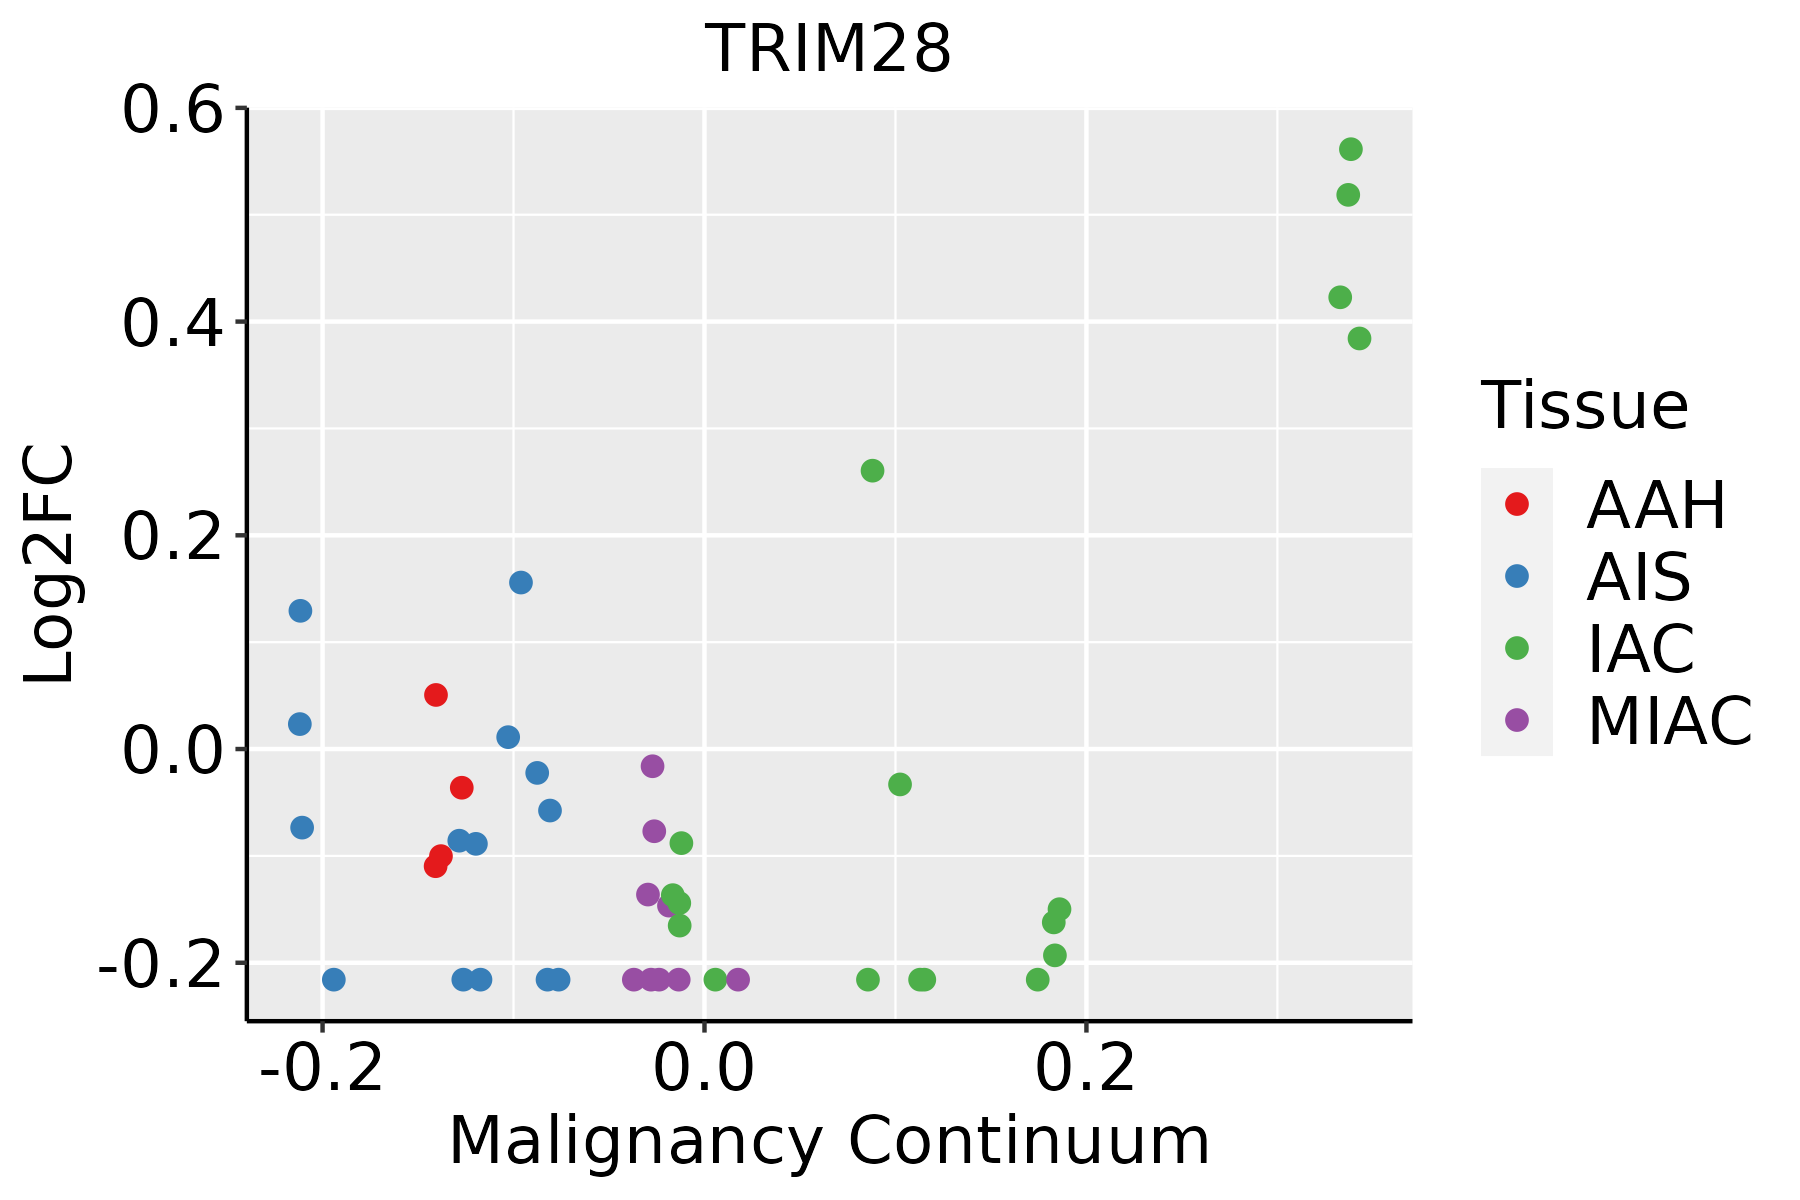 | AAH: Atypical adenomatous hyperplasia |
| AIS: Adenocarcinoma in situ | ||
| IAC: Invasive lung adenocarcinoma | ||
| MIA: Minimally invasive adenocarcinoma | ||
| Oral Cavity | 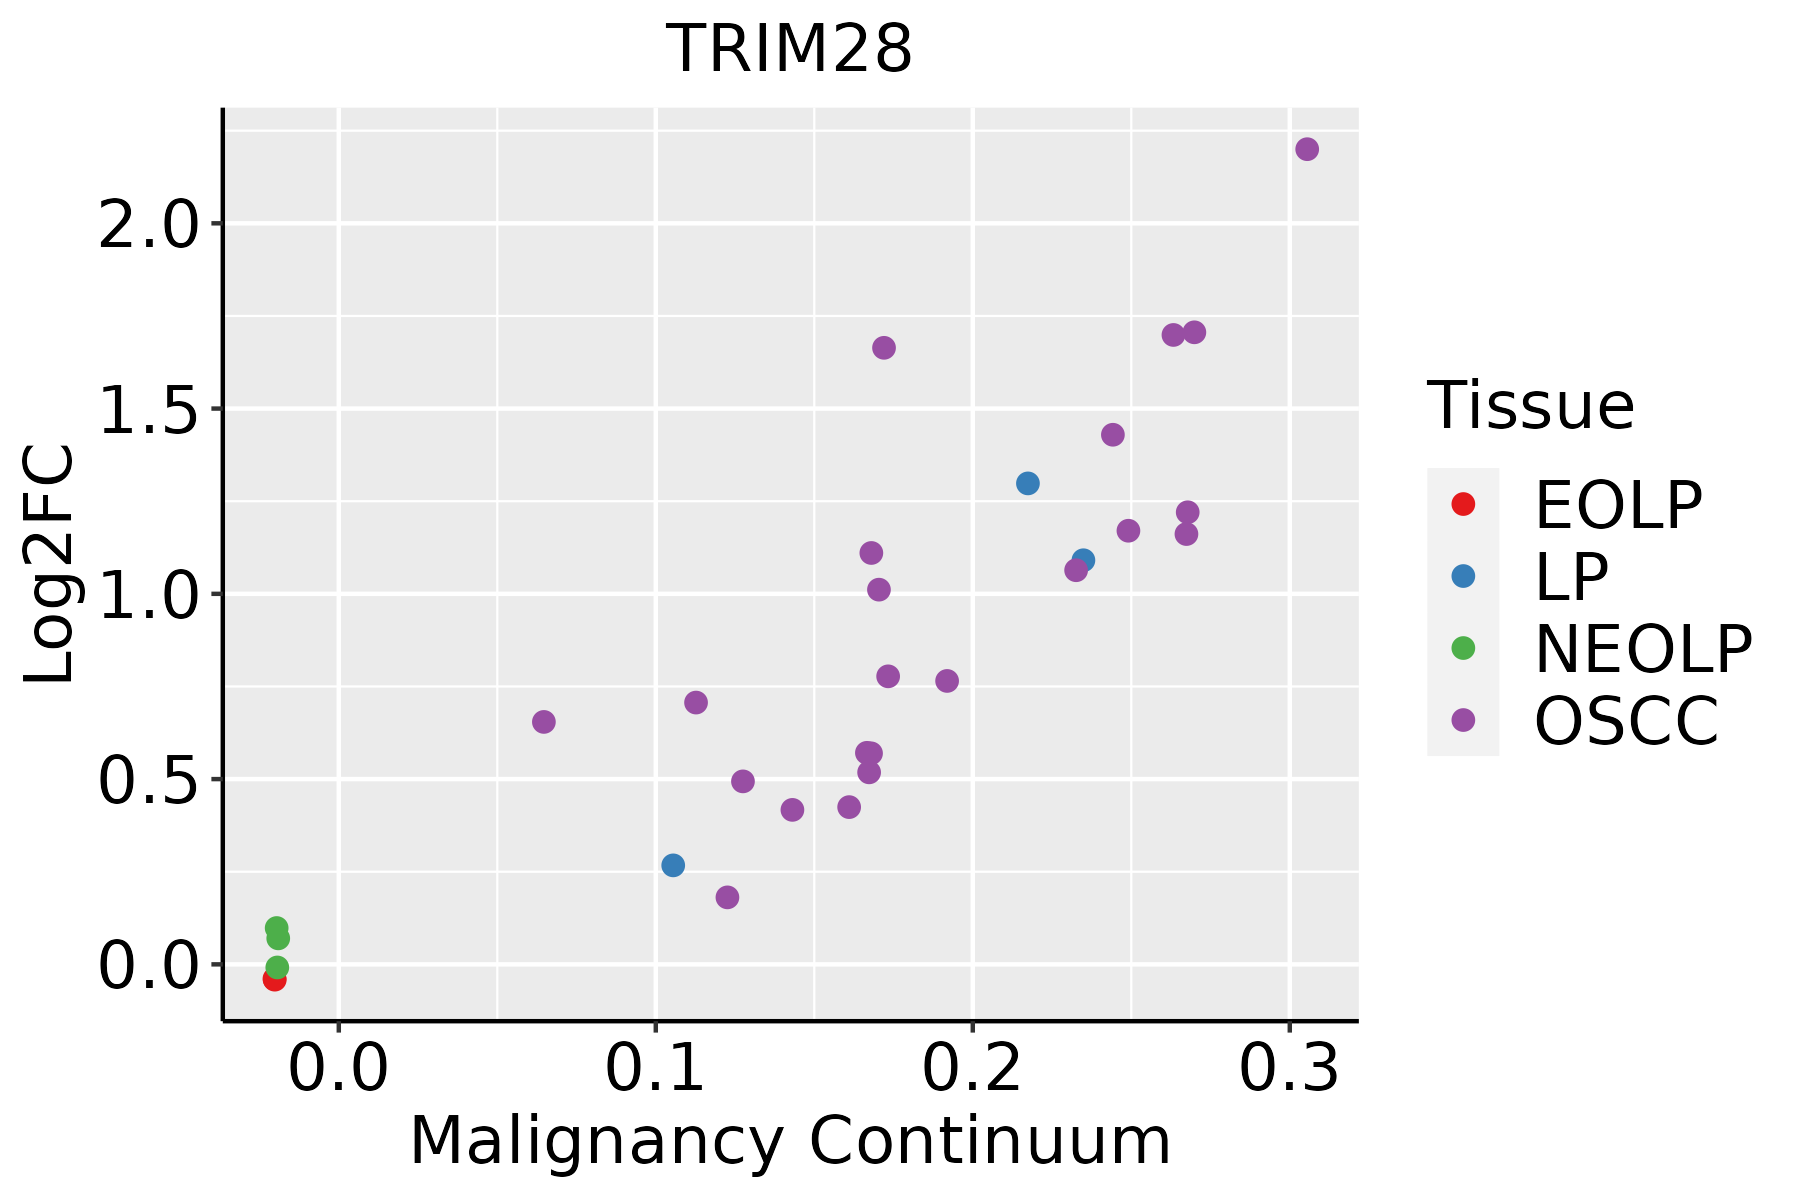 | EOLP: Erosive Oral lichen planus |
| LP: leukoplakia | ||
| NEOLP: Non-erosive oral lichen planus | ||
| OSCC: Oral squamous cell carcinoma | ||
| Skin | 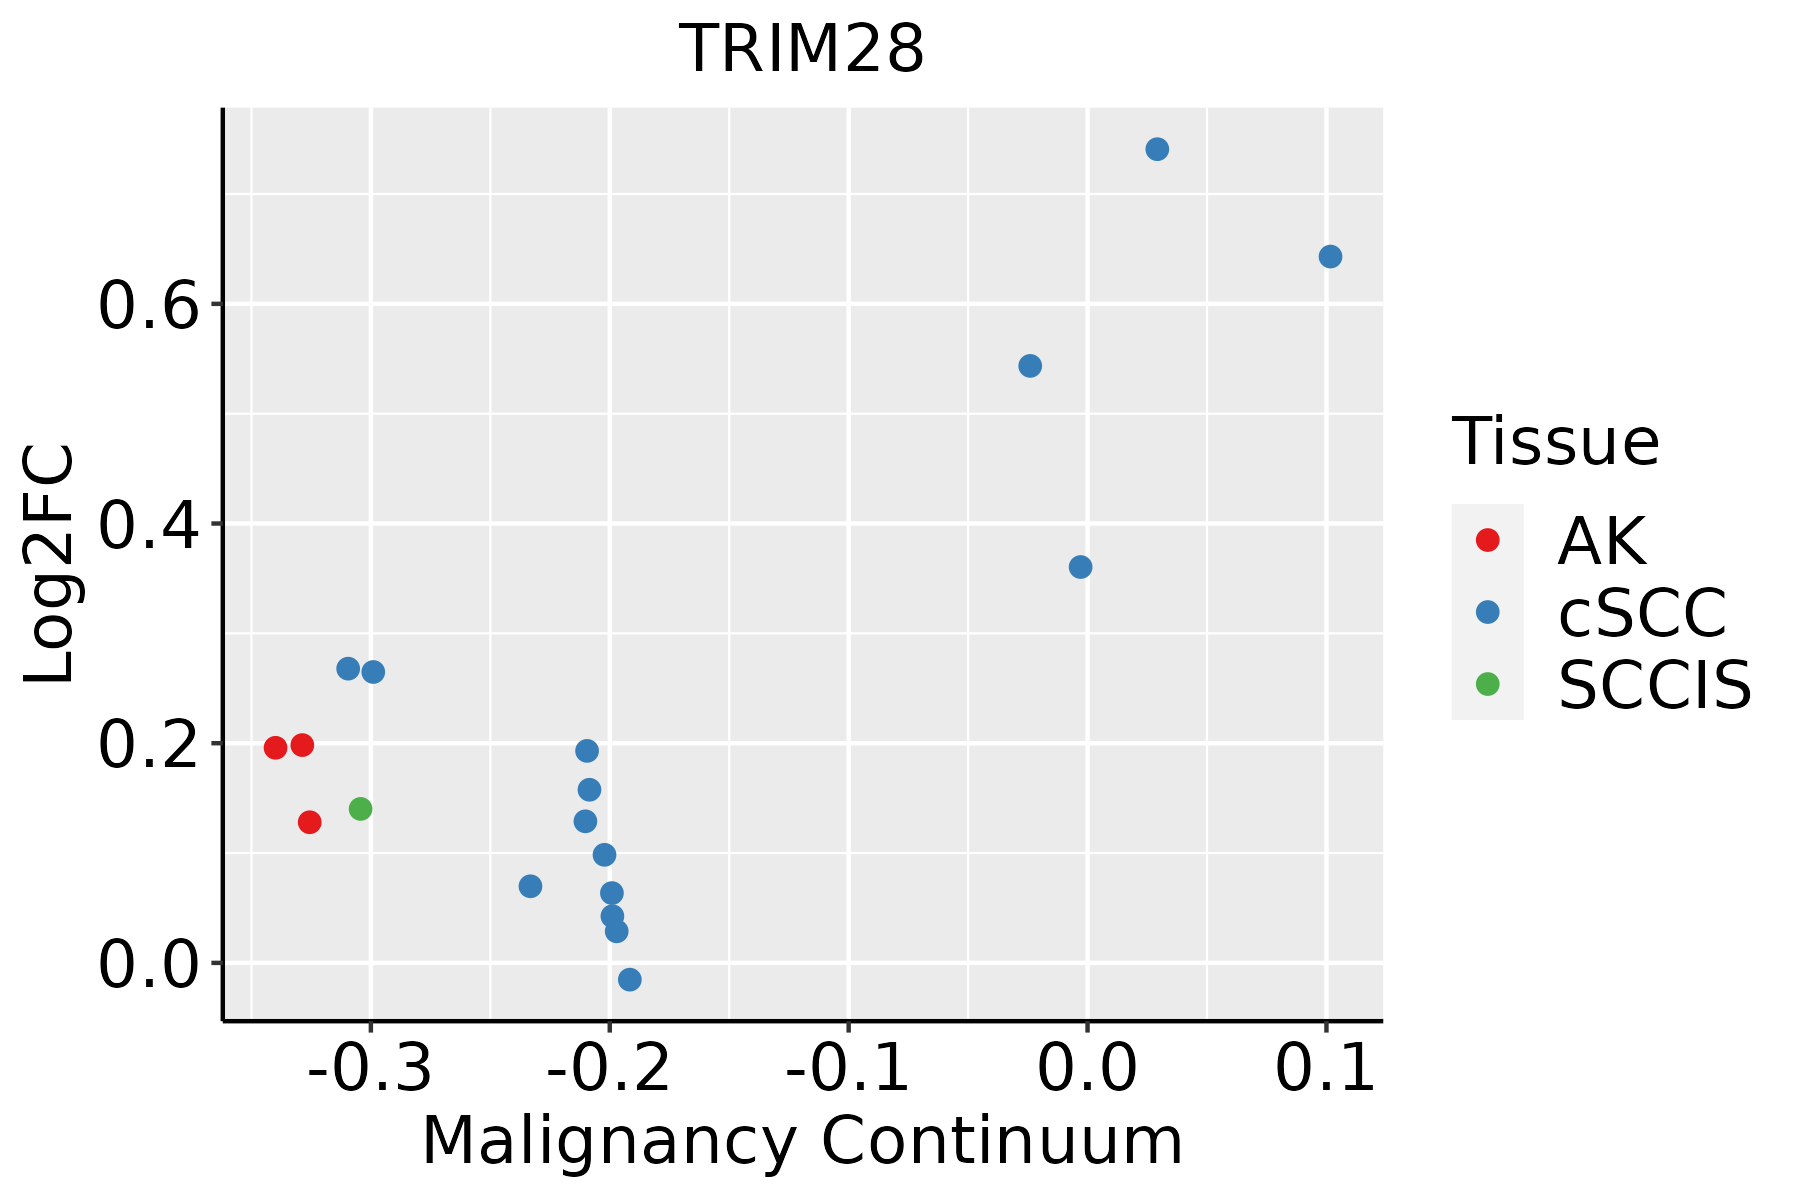 | AK: Actinic keratosis |
| cSCC: Cutaneous squamous cell carcinoma | ||
| SCCIS:squamous cell carcinoma in situ | ||
| Thyroid | 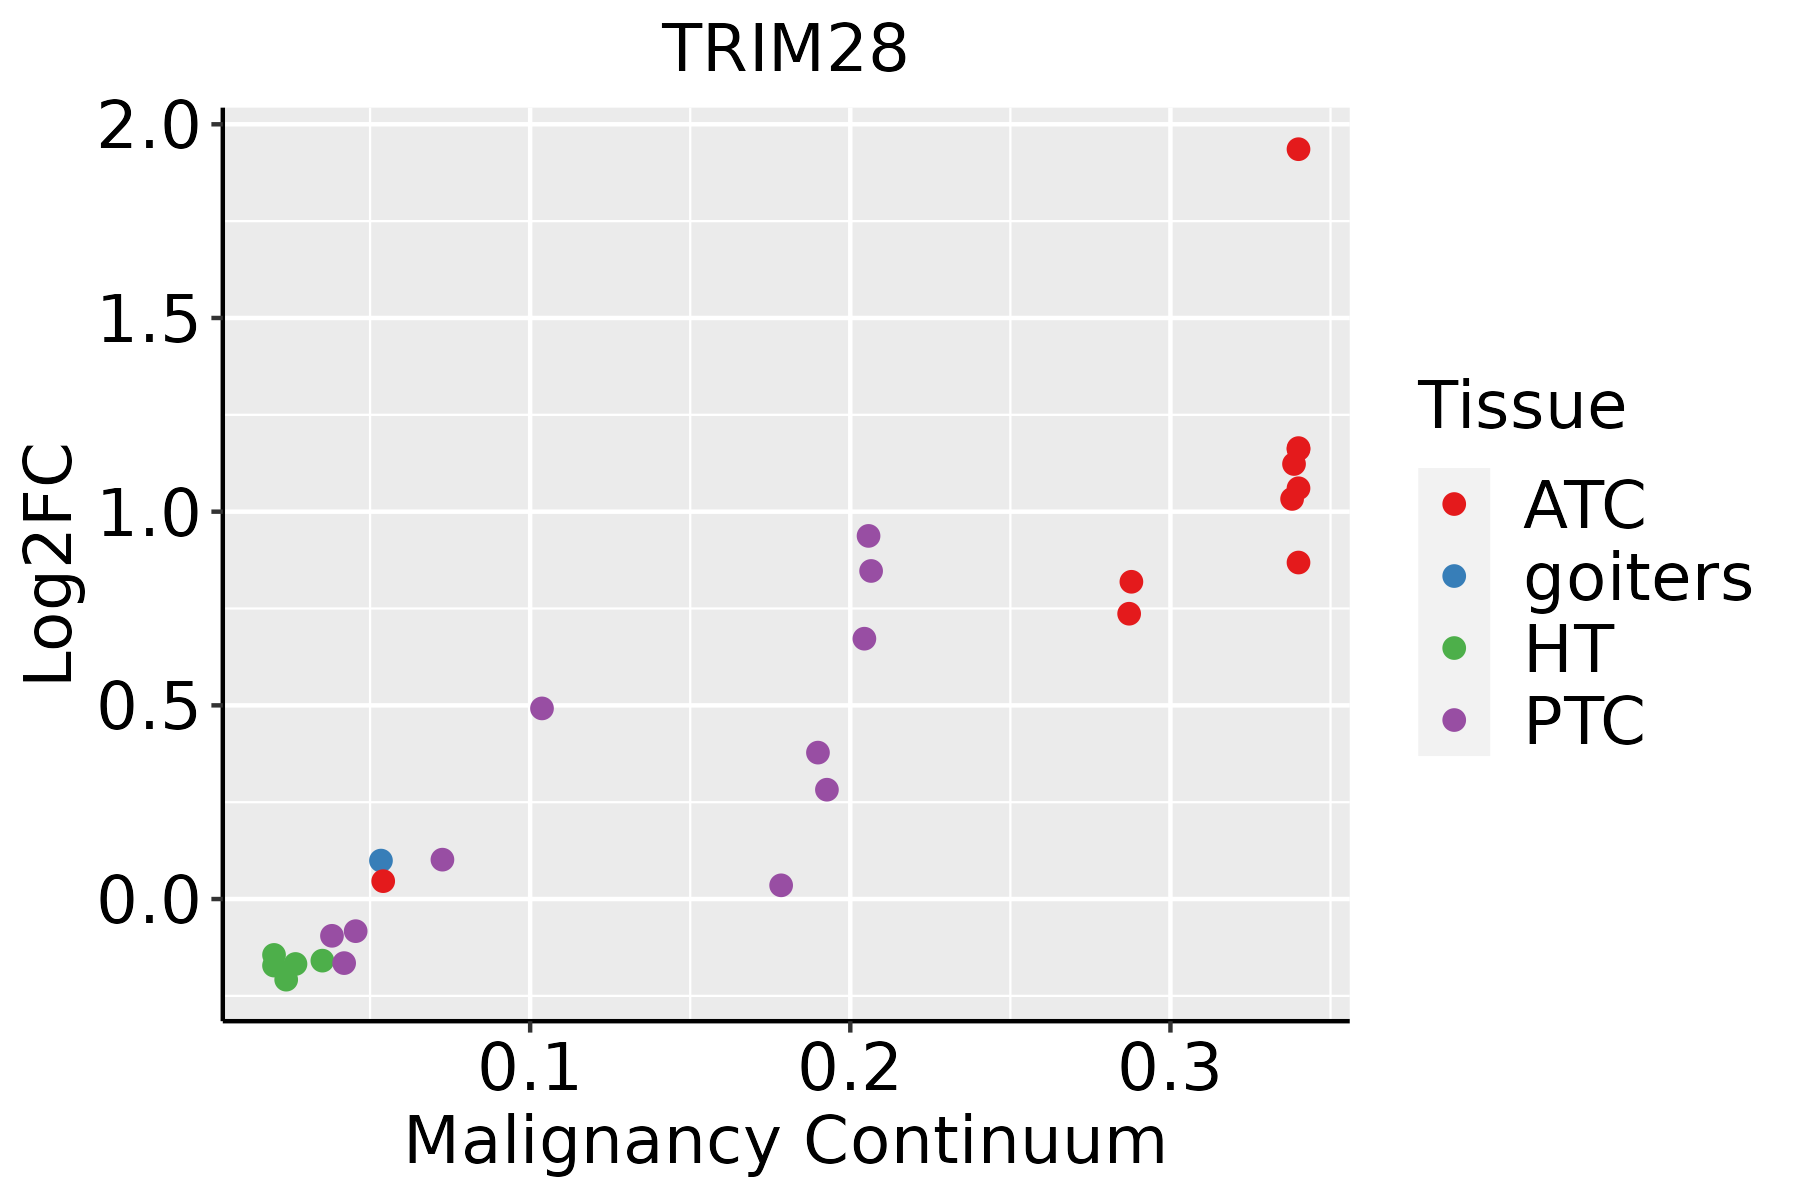 | ATC: Anaplastic thyroid cancer |
| HT: Hashimoto's thyroiditis | ||
| PTC: Papillary thyroid cancer |
| ∗log2FC in expression of this searched gene in stem-like cells from each diseased tissue sample relative to stem-like cells in normal samples in each tissue plotted against the malignancy continuum. Samples are colored based on if they are from different disease stage. |
Top |
Malignant transformation related pathway analysis |
| Find out the enriched GO biological processes and KEGG pathways involved in transition from healthy to precancer to cancer |
| Tissue | Disease Stage | Enriched GO biological Processes |
| Colorectum | AD |  |
| Colorectum | SER |  |
| Colorectum | MSS |  |
| Colorectum | MSI-H |  |
| Colorectum | FAP |  |
| ∗Top 15 enriched GO BP terms are showed in the bar plot of each disease state in each tissue. Each row represents a significant GO biological process which is colored according to the -log10(p.adjust). |
| Page: 1 2 3 4 5 6 7 8 9 |
| GO ID | Tissue | Disease Stage | Description | Gene Ratio | Bg Ratio | pvalue | p.adjust | Count |
| GO:00331577 | Lung | IAC | regulation of intracellular protein transport | 43/2061 | 229/18723 | 3.21e-04 | 5.06e-03 | 43 |
| GO:00510998 | Lung | IAC | positive regulation of binding | 34/2061 | 173/18723 | 5.58e-04 | 7.76e-03 | 34 |
| GO:00182053 | Lung | IAC | peptidyl-lysine modification | 62/2061 | 376/18723 | 7.55e-04 | 9.82e-03 | 62 |
| GO:00709881 | Lung | IAC | demethylation | 18/2061 | 73/18723 | 7.56e-04 | 9.82e-03 | 18 |
| GO:00345047 | Lung | IAC | protein localization to nucleus | 50/2061 | 290/18723 | 8.71e-04 | 1.11e-02 | 50 |
| GO:00606695 | Lung | IAC | embryonic placenta morphogenesis | 9/2061 | 26/18723 | 1.27e-03 | 1.45e-02 | 9 |
| GO:00323887 | Lung | IAC | positive regulation of intracellular transport | 37/2061 | 202/18723 | 1.29e-03 | 1.45e-02 | 37 |
| GO:00468247 | Lung | IAC | positive regulation of nucleocytoplasmic transport | 15/2061 | 62/18723 | 2.47e-03 | 2.33e-02 | 15 |
| GO:19038298 | Lung | IAC | positive regulation of cellular protein localization | 46/2061 | 276/18723 | 2.74e-03 | 2.50e-02 | 46 |
| GO:20012528 | Lung | IAC | positive regulation of chromosome organization | 18/2061 | 82/18723 | 3.09e-03 | 2.71e-02 | 18 |
| GO:00510547 | Lung | IAC | positive regulation of DNA metabolic process | 35/2061 | 201/18723 | 4.07e-03 | 3.32e-02 | 35 |
| GO:00604852 | Lung | IAC | mesenchyme development | 47/2061 | 291/18723 | 4.61e-03 | 3.64e-02 | 47 |
| GO:20010225 | Lung | IAC | positive regulation of response to DNA damage stimulus | 21/2061 | 105/18723 | 4.77e-03 | 3.71e-02 | 21 |
| GO:00487623 | Lung | IAC | mesenchymal cell differentiation | 39/2061 | 236/18723 | 6.33e-03 | 4.51e-02 | 39 |
| GO:00485684 | Lung | IAC | embryonic organ development | 64/2061 | 427/18723 | 6.46e-03 | 4.59e-02 | 64 |
| GO:00018372 | Lung | IAC | epithelial to mesenchymal transition | 28/2061 | 157/18723 | 6.84e-03 | 4.75e-02 | 28 |
| GO:00510527 | Lung | IAC | regulation of DNA metabolic process | 55/2061 | 359/18723 | 7.12e-03 | 4.87e-02 | 55 |
| GO:007259418 | Oral cavity | OSCC | establishment of protein localization to organelle | 284/7305 | 422/18723 | 1.50e-32 | 1.35e-29 | 284 |
| GO:001603220 | Oral cavity | OSCC | viral process | 274/7305 | 415/18723 | 2.42e-29 | 1.70e-26 | 274 |
| GO:000691317 | Oral cavity | OSCC | nucleocytoplasmic transport | 204/7305 | 301/18723 | 2.65e-24 | 6.98e-22 | 204 |
| Page: 1 2 3 4 5 6 7 8 9 10 11 12 13 14 15 16 17 18 19 20 21 22 23 24 25 26 27 28 29 30 31 32 33 34 35 36 37 38 39 40 41 42 43 44 45 46 47 48 49 50 51 52 |
| Pathway ID | Tissue | Disease Stage | Description | Gene Ratio | Bg Ratio | pvalue | p.adjust | qvalue | Count |
| Page: 1 |
Top |
Cell-cell communication analysis |
| Identification of potential cell-cell interactions between two cell types and their ligand-receptor pairs for different disease states |
| Ligand | Receptor | LRpair | Pathway | Tissue | Disease Stage |
| Page: 1 |
Top |
Single-cell gene regulatory network inference analysis |
| Find out the significant the regulons (TFs) and the target genes of each regulon across cell types for different disease states |
| TF | Cell Type | Tissue | Disease Stage | Target Gene | RSS | Regulon Activity |
| TRIM28 | MYOEPI | Breast | DCIS | ERBB2,PGAP3,MUC6, etc. | 1.47e-01 |  |
| TRIM28 | CD8TRM | Breast | Healthy | GNAS,TUBB4B,ODC1, etc. | 4.16e-01 |  |
| TRIM28 | CD8TRM | Breast | Precancer | GNAS,TUBB4B,ODC1, etc. | 6.11e-02 |  |
| TRIM28 | MYOFIB | Colorectum | CRC | SPINT2,MT-ATP6,MT-CYB, etc. | 5.22e-02 |  |
| TRIM28 | VFIB | Colorectum | MSS | SPINT2,MT-ATP6,MT-CYB, etc. | 3.36e-02 |  |
| TRIM28 | LUM | Endometrium | EEC | SAMD11,ZNF302,TUBB, etc. | 2.44e-02 |  |
| TRIM28 | INMON | Endometrium | ADJ | LYPD3,PTGS2,EREG, etc. | 4.02e-01 |  |
| TRIM28 | NEUT | Endometrium | ADJ | LYPD3,PTGS2,EREG, etc. | 9.61e-03 | |
| TRIM28 | NEUT | Endometrium | AEH | LYPD3,PTGS2,EREG, etc. | 2.16e-01 |  |
| TRIM28 | INMON | Endometrium | AEH | LYPD3,PTGS2,EREG, etc. | 3.00e-01 | |
| ∗The dot plots of a searched regulon are shown for all cell subpopulations in each disease state of each tissue based on the regulon specific score inferred using pySCENIC and by calculating the average expression. |
| Page: 1 2 |
Top |
Somatic mutation of malignant transformation related genes |
| Annotation of somatic variants for genes involved in malignant transformation |
| Hugo Symbol | Variant Class | Variant Classification | dbSNP RS | HGVSc | HGVSp | HGVSp Short | SWISSPROT | BIOTYPE | SIFT | PolyPhen | Tumor Sample Barcode | Tissue | Histology | Sex | Age | Stage | Therapy Types | Drugs | Outcome |
| TRIM28 | SNV | Missense_Mutation | novel | c.523G>A | p.Glu175Lys | p.E175K | Q13263 | protein_coding | deleterious(0.04) | benign(0.286) | TCGA-A2-A0CR-01 | Breast | breast invasive carcinoma | Female | <65 | I/II | Chemotherapy | adriamycin | CR |
| TRIM28 | SNV | Missense_Mutation | rs759243122 | c.1234N>T | p.Arg412Cys | p.R412C | Q13263 | protein_coding | tolerated(0.06) | probably_damaging(0.99) | TCGA-AO-A0J3-01 | Breast | breast invasive carcinoma | Female | >=65 | I/II | Chemotherapy | cyclophosphamide | SD |
| TRIM28 | SNV | Missense_Mutation | c.932G>A | p.Arg311His | p.R311H | Q13263 | protein_coding | tolerated(0.1) | benign(0.003) | TCGA-AO-A128-01 | Breast | breast invasive carcinoma | Female | <65 | I/II | Chemotherapy | doxorubicin | SD | |
| TRIM28 | SNV | Missense_Mutation | c.1310N>G | p.Ser437Cys | p.S437C | Q13263 | protein_coding | deleterious(0.01) | possibly_damaging(0.635) | TCGA-BH-A0DZ-01 | Breast | breast invasive carcinoma | Female | <65 | I/II | Chemotherapy | docetaxel | SD | |
| TRIM28 | SNV | Missense_Mutation | novel | c.667N>G | p.Ser223Gly | p.S223G | Q13263 | protein_coding | deleterious(0) | possibly_damaging(0.867) | TCGA-EW-A1OY-01 | Breast | breast invasive carcinoma | Female | <65 | I/II | Chemotherapy | doxorubicin | SD |
| TRIM28 | deletion | Frame_Shift_Del | novel | c.479delN | p.Pro161GlnfsTer18 | p.P161Qfs*18 | Q13263 | protein_coding | TCGA-D8-A27V-01 | Breast | breast invasive carcinoma | Female | <65 | I/II | Hormone Therapy | tamoxiphen | SD | ||
| TRIM28 | deletion | Frame_Shift_Del | novel | c.2049delN | p.Leu684TrpfsTer57 | p.L684Wfs*57 | Q13263 | protein_coding | TCGA-EW-A2FV-01 | Breast | breast invasive carcinoma | Female | <65 | III/IV | Chemotherapy | docetaxel | SD | ||
| TRIM28 | SNV | Missense_Mutation | novel | c.1486N>A | p.Asp496Asn | p.D496N | Q13263 | protein_coding | tolerated(0.82) | probably_damaging(0.977) | TCGA-2W-A8YY-01 | Cervix | cervical & endocervical cancer | Female | <65 | I/II | Chemotherapy | cisplatin | CR |
| TRIM28 | SNV | Missense_Mutation | novel | c.2377G>A | p.Glu793Lys | p.E793K | Q13263 | protein_coding | deleterious(0.03) | benign(0.014) | TCGA-C5-A7X5-01 | Cervix | cervical & endocervical cancer | Female | >=65 | I/II | Chemotherapy | carboplatin | PD |
| TRIM28 | SNV | Missense_Mutation | novel | c.736N>C | p.Glu246Gln | p.E246Q | Q13263 | protein_coding | deleterious(0.02) | probably_damaging(0.991) | TCGA-DS-A1OC-01 | Cervix | cervical & endocervical cancer | Female | <65 | I/II | Chemotherapy | gemcitabine | SD |
| Page: 1 2 3 4 5 6 7 8 |
Top |
Related drugs of malignant transformation related genes |
| Identification of chemicals and drugs interact with genes involved in malignant transfromation |
| (DGIdb 4.0) |
| Entrez ID | Symbol | Category | Interaction Types | Drug Claim Name | Drug Name | PMIDs |
| Page: 1 |

Copyright 2023-Present -The University of Texas Health Science Center at Houston |