
|
|||||
|
 | |
| |
| |
| |
| |
| |
|
Gene: PRNP |
Gene summary for PRNP |
| Gene information | Species | Human | Gene symbol | PRNP | Gene ID | 5621 |
| Gene name | prion protein | |
| Gene Alias | ASCR | |
| Cytomap | 20p13 | |
| Gene Type | protein-coding | GO ID | GO:0001775 | UniProtAcc | P04156 |
Top |
Malignant transformation analysis |
| Identification of the aberrant gene expression in precancerous and cancerous lesions by comparing the gene expression of stem-like cells in diseased tissues with normal stem cells |
| Entrez ID | Symbol | Replicates | Species | Organ | Tissue | Adj P-value | Log2FC | Malignancy |
| 5621 | PRNP | LZE3D | Human | Esophagus | HGIN | 6.78e-03 | -4.03e-01 | 0.0668 |
| 5621 | PRNP | LZE4T | Human | Esophagus | ESCC | 6.47e-07 | 8.46e-01 | 0.0811 |
| 5621 | PRNP | LZE5T | Human | Esophagus | ESCC | 9.88e-08 | -5.14e-01 | 0.0514 |
| 5621 | PRNP | LZE7T | Human | Esophagus | ESCC | 5.84e-07 | -4.77e-01 | 0.0667 |
| 5621 | PRNP | LZE8T | Human | Esophagus | ESCC | 8.06e-07 | -2.83e-01 | 0.067 |
| 5621 | PRNP | LZE22D1 | Human | Esophagus | HGIN | 1.67e-16 | -9.25e-01 | 0.0595 |
| 5621 | PRNP | P2T-E | Human | Esophagus | ESCC | 2.71e-40 | 1.43e+00 | 0.1177 |
| 5621 | PRNP | P4T-E | Human | Esophagus | ESCC | 1.35e-14 | 1.05e+00 | 0.1323 |
| 5621 | PRNP | P5T-E | Human | Esophagus | ESCC | 4.29e-12 | -2.40e-01 | 0.1327 |
| 5621 | PRNP | P8T-E | Human | Esophagus | ESCC | 3.42e-05 | 3.37e-01 | 0.0889 |
| 5621 | PRNP | P10T-E | Human | Esophagus | ESCC | 2.17e-10 | 4.30e-01 | 0.116 |
| 5621 | PRNP | P11T-E | Human | Esophagus | ESCC | 1.24e-23 | 2.50e+00 | 0.1426 |
| 5621 | PRNP | P12T-E | Human | Esophagus | ESCC | 1.74e-22 | 1.00e+00 | 0.1122 |
| 5621 | PRNP | P15T-E | Human | Esophagus | ESCC | 6.94e-06 | 7.08e-01 | 0.1149 |
| 5621 | PRNP | P16T-E | Human | Esophagus | ESCC | 1.03e-24 | 1.07e+00 | 0.1153 |
| 5621 | PRNP | P17T-E | Human | Esophagus | ESCC | 2.89e-08 | 1.32e+00 | 0.1278 |
| 5621 | PRNP | P19T-E | Human | Esophagus | ESCC | 3.74e-06 | 1.29e+00 | 0.1662 |
| 5621 | PRNP | P20T-E | Human | Esophagus | ESCC | 1.29e-06 | 6.10e-01 | 0.1124 |
| 5621 | PRNP | P21T-E | Human | Esophagus | ESCC | 7.41e-44 | 2.40e+00 | 0.1617 |
| 5621 | PRNP | P22T-E | Human | Esophagus | ESCC | 5.74e-04 | 8.48e-02 | 0.1236 |
| Page: 1 2 3 4 5 6 7 |
| Tissue | Expression Dynamics | Abbreviation |
| Esophagus |  | ESCC: Esophageal squamous cell carcinoma |
| HGIN: High-grade intraepithelial neoplasias | ||
| LGIN: Low-grade intraepithelial neoplasias | ||
| Liver | 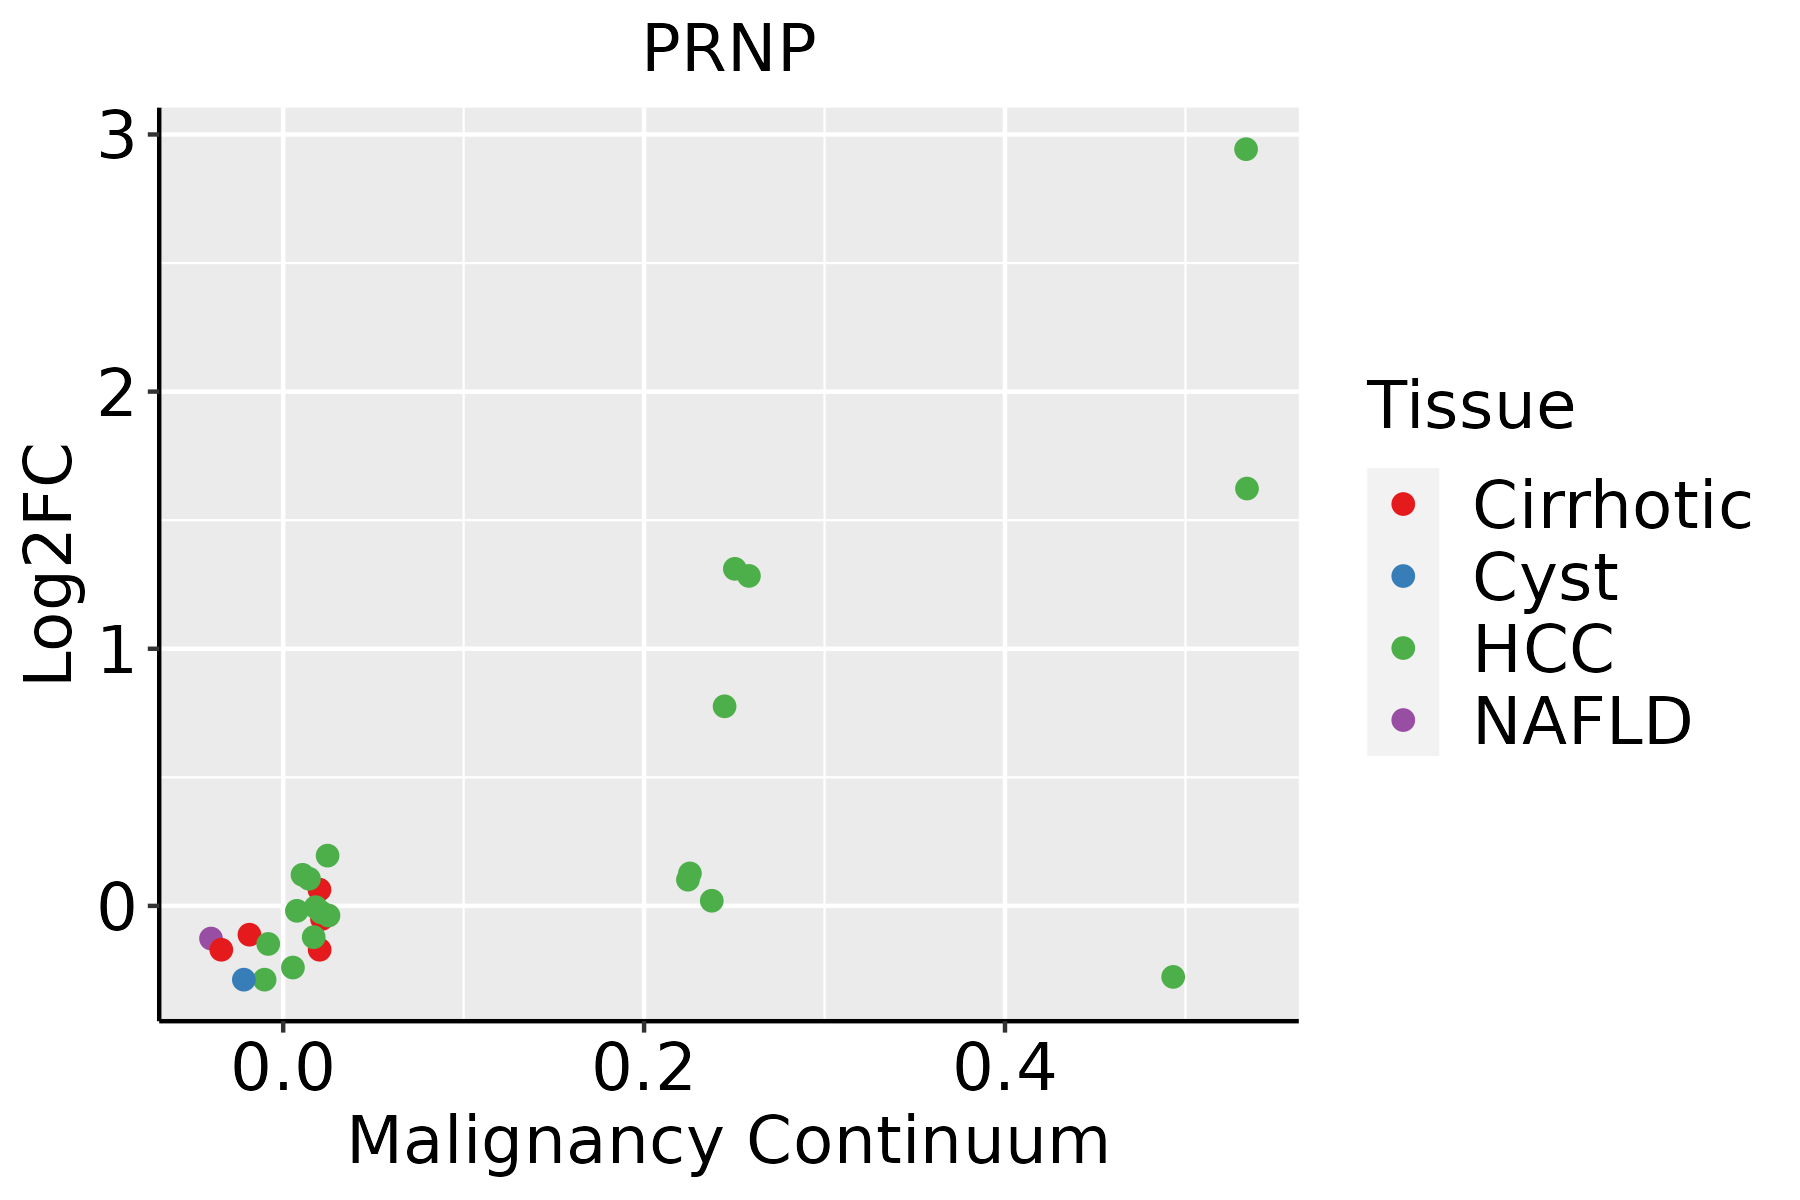 | HCC: Hepatocellular carcinoma |
| NAFLD: Non-alcoholic fatty liver disease | ||
| Oral Cavity |  | EOLP: Erosive Oral lichen planus |
| LP: leukoplakia | ||
| NEOLP: Non-erosive oral lichen planus | ||
| OSCC: Oral squamous cell carcinoma | ||
| Prostate | 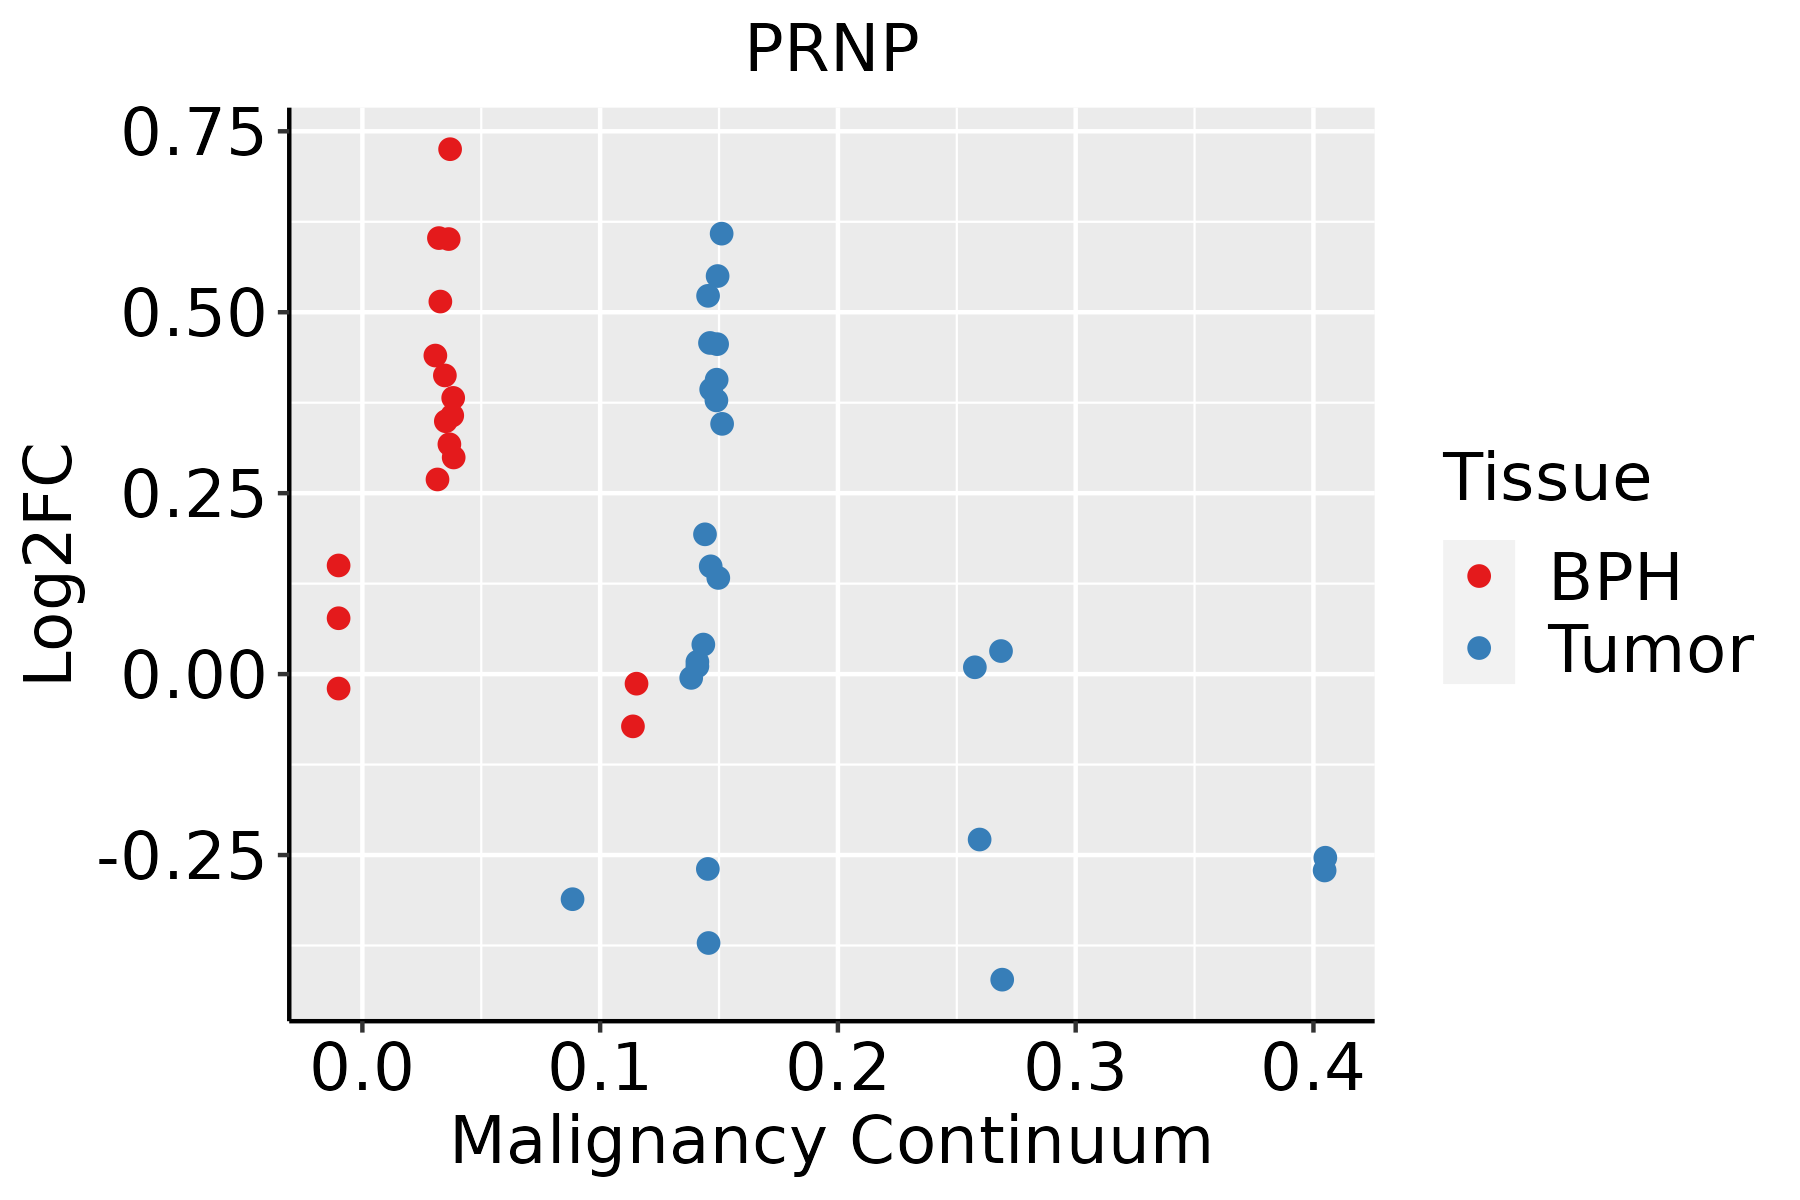 | BPH: Benign Prostatic Hyperplasia |
| Skin |  | AK: Actinic keratosis |
| cSCC: Cutaneous squamous cell carcinoma | ||
| SCCIS:squamous cell carcinoma in situ | ||
| Thyroid | 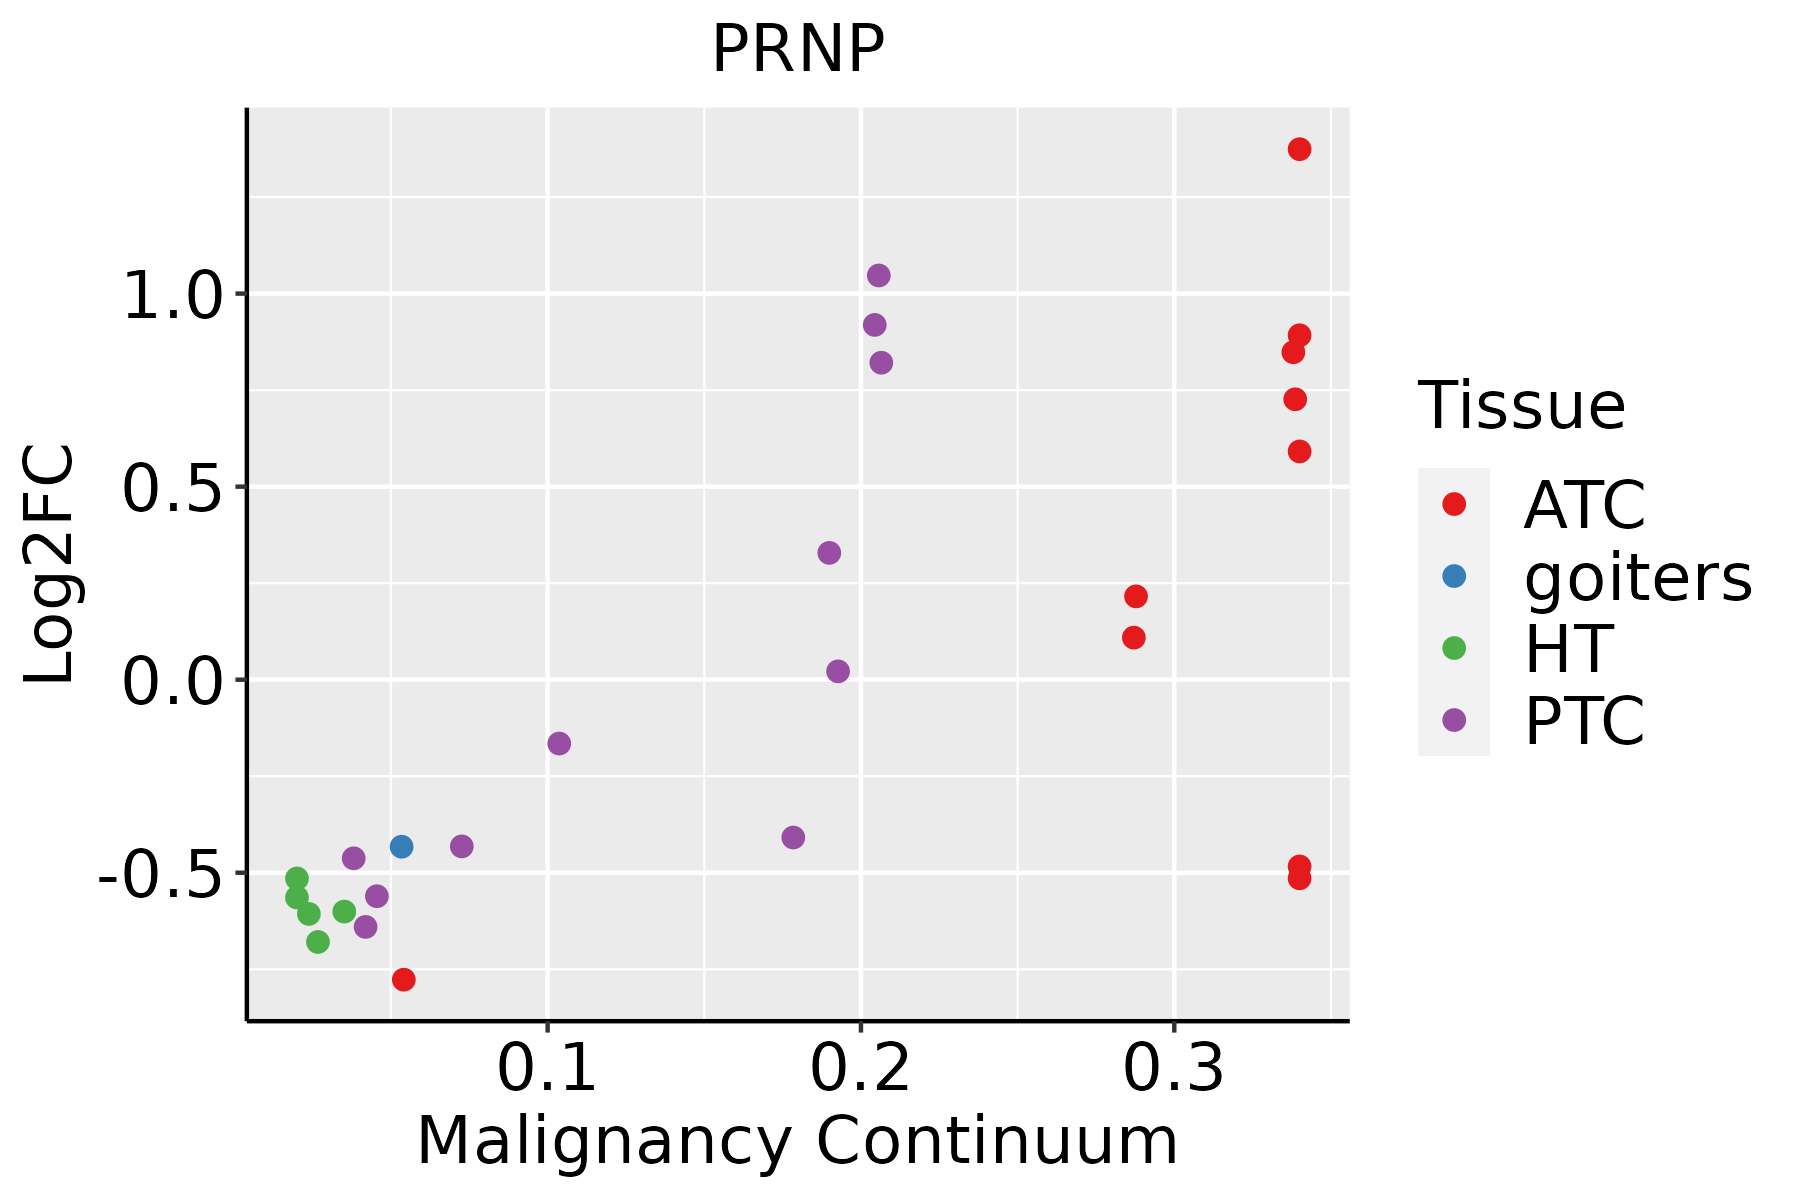 | ATC: Anaplastic thyroid cancer |
| HT: Hashimoto's thyroiditis | ||
| PTC: Papillary thyroid cancer |
| ∗log2FC in expression of this searched gene in stem-like cells from each diseased tissue sample relative to stem-like cells in normal samples in each tissue plotted against the malignancy continuum. Samples are colored based on if they are from different disease stage. |
Top |
Malignant transformation related pathway analysis |
| Find out the enriched GO biological processes and KEGG pathways involved in transition from healthy to precancer to cancer |
| Tissue | Disease Stage | Enriched GO biological Processes |
| Colorectum | AD |  |
| Colorectum | SER |  |
| Colorectum | MSS |  |
| Colorectum | MSI-H |  |
| Colorectum | FAP |  |
| ∗Top 15 enriched GO BP terms are showed in the bar plot of each disease state in each tissue. Each row represents a significant GO biological process which is colored according to the -log10(p.adjust). |
| Page: 1 2 3 4 5 6 7 8 9 |
| GO ID | Tissue | Disease Stage | Description | Gene Ratio | Bg Ratio | pvalue | p.adjust | Count |
| GO:001046626 | Skin | cSCC | negative regulation of peptidase activity | 91/4864 | 262/18723 | 9.73e-04 | 6.58e-03 | 91 |
| GO:00068782 | Skin | cSCC | cellular copper ion homeostasis | 10/4864 | 15/18723 | 1.10e-03 | 7.24e-03 | 10 |
| GO:190437723 | Skin | cSCC | positive regulation of protein localization to cell periphery | 30/4864 | 69/18723 | 1.19e-03 | 7.75e-03 | 30 |
| GO:00164858 | Skin | cSCC | protein processing | 79/4864 | 225/18723 | 1.43e-03 | 9.02e-03 | 79 |
| GO:190307823 | Skin | cSCC | positive regulation of protein localization to plasma membrane | 27/4864 | 62/18723 | 1.99e-03 | 1.19e-02 | 27 |
| GO:006109721 | Skin | cSCC | regulation of protein tyrosine kinase activity | 36/4864 | 90/18723 | 2.48e-03 | 1.42e-02 | 36 |
| GO:003367425 | Skin | cSCC | positive regulation of kinase activity | 148/4864 | 467/18723 | 3.00e-03 | 1.66e-02 | 148 |
| GO:004586025 | Skin | cSCC | positive regulation of protein kinase activity | 123/4864 | 386/18723 | 5.23e-03 | 2.64e-02 | 123 |
| GO:000716224 | Skin | cSCC | negative regulation of cell adhesion | 98/4864 | 303/18723 | 7.45e-03 | 3.50e-02 | 98 |
| GO:00109554 | Skin | cSCC | negative regulation of protein processing | 14/4864 | 29/18723 | 8.08e-03 | 3.74e-02 | 14 |
| GO:19033184 | Skin | cSCC | negative regulation of protein maturation | 14/4864 | 29/18723 | 8.08e-03 | 3.74e-02 | 14 |
| GO:004352319 | Skin | cSCC | regulation of neuron apoptotic process | 71/4864 | 212/18723 | 8.71e-03 | 4.01e-02 | 71 |
| GO:004298713 | Skin | cSCC | amyloid precursor protein catabolic process | 27/4864 | 68/18723 | 9.07e-03 | 4.16e-02 | 27 |
| GO:005085221 | Skin | cSCC | T cell receptor signaling pathway | 44/4864 | 123/18723 | 1.02e-02 | 4.47e-02 | 44 |
| GO:000697930 | Thyroid | HT | response to oxidative stress | 81/1272 | 446/18723 | 2.53e-16 | 1.17e-13 | 81 |
| GO:003164730 | Thyroid | HT | regulation of protein stability | 57/1272 | 298/18723 | 8.04e-13 | 1.79e-10 | 57 |
| GO:005254729 | Thyroid | HT | regulation of peptidase activity | 71/1272 | 461/18723 | 6.39e-11 | 9.11e-09 | 71 |
| GO:005254829 | Thyroid | HT | regulation of endopeptidase activity | 64/1272 | 432/18723 | 2.80e-09 | 2.68e-07 | 64 |
| GO:004586129 | Thyroid | HT | negative regulation of proteolysis | 54/1272 | 351/18723 | 1.31e-08 | 1.08e-06 | 54 |
| GO:005086319 | Thyroid | HT | regulation of T cell activation | 51/1272 | 329/18723 | 2.58e-08 | 1.97e-06 | 51 |
| Page: 1 2 3 4 5 6 7 8 9 10 11 12 13 14 15 16 17 18 19 20 21 22 23 24 25 26 27 28 29 30 31 32 33 34 35 36 37 38 39 40 41 42 |
| Pathway ID | Tissue | Disease Stage | Description | Gene Ratio | Bg Ratio | pvalue | p.adjust | qvalue | Count |
| hsa0502030 | Esophagus | HGIN | Prion disease | 117/1383 | 273/8465 | 4.15e-26 | 3.38e-24 | 2.69e-24 | 117 |
| hsa0502230 | Esophagus | HGIN | Pathways of neurodegeneration - multiple diseases | 153/1383 | 476/8465 | 1.22e-18 | 4.41e-17 | 3.50e-17 | 153 |
| hsa0421628 | Esophagus | HGIN | Ferroptosis | 15/1383 | 41/8465 | 1.35e-03 | 1.26e-02 | 1.00e-02 | 15 |
| hsa05020113 | Esophagus | HGIN | Prion disease | 117/1383 | 273/8465 | 4.15e-26 | 3.38e-24 | 2.69e-24 | 117 |
| hsa05022113 | Esophagus | HGIN | Pathways of neurodegeneration - multiple diseases | 153/1383 | 476/8465 | 1.22e-18 | 4.41e-17 | 3.50e-17 | 153 |
| hsa04216111 | Esophagus | HGIN | Ferroptosis | 15/1383 | 41/8465 | 1.35e-03 | 1.26e-02 | 1.00e-02 | 15 |
| hsa05022210 | Esophagus | ESCC | Pathways of neurodegeneration - multiple diseases | 318/4205 | 476/8465 | 6.10e-15 | 2.04e-13 | 1.05e-13 | 318 |
| hsa05020210 | Esophagus | ESCC | Prion disease | 193/4205 | 273/8465 | 6.42e-13 | 1.34e-11 | 6.89e-12 | 193 |
| hsa0421629 | Esophagus | ESCC | Ferroptosis | 33/4205 | 41/8465 | 4.58e-05 | 1.99e-04 | 1.02e-04 | 33 |
| hsa0502238 | Esophagus | ESCC | Pathways of neurodegeneration - multiple diseases | 318/4205 | 476/8465 | 6.10e-15 | 2.04e-13 | 1.05e-13 | 318 |
| hsa0502038 | Esophagus | ESCC | Prion disease | 193/4205 | 273/8465 | 6.42e-13 | 1.34e-11 | 6.89e-12 | 193 |
| hsa0421638 | Esophagus | ESCC | Ferroptosis | 33/4205 | 41/8465 | 4.58e-05 | 1.99e-04 | 1.02e-04 | 33 |
| hsa0502014 | Liver | Cirrhotic | Prion disease | 152/2530 | 273/8465 | 1.84e-19 | 8.78e-18 | 5.41e-18 | 152 |
| hsa0502214 | Liver | Cirrhotic | Pathways of neurodegeneration - multiple diseases | 217/2530 | 476/8465 | 7.30e-14 | 2.03e-12 | 1.25e-12 | 217 |
| hsa0421621 | Liver | Cirrhotic | Ferroptosis | 23/2530 | 41/8465 | 4.09e-04 | 2.57e-03 | 1.58e-03 | 23 |
| hsa0502015 | Liver | Cirrhotic | Prion disease | 152/2530 | 273/8465 | 1.84e-19 | 8.78e-18 | 5.41e-18 | 152 |
| hsa0502215 | Liver | Cirrhotic | Pathways of neurodegeneration - multiple diseases | 217/2530 | 476/8465 | 7.30e-14 | 2.03e-12 | 1.25e-12 | 217 |
| hsa0421631 | Liver | Cirrhotic | Ferroptosis | 23/2530 | 41/8465 | 4.09e-04 | 2.57e-03 | 1.58e-03 | 23 |
| hsa0502022 | Liver | HCC | Prion disease | 195/4020 | 273/8465 | 3.26e-16 | 1.56e-14 | 8.67e-15 | 195 |
| hsa0502222 | Liver | HCC | Pathways of neurodegeneration - multiple diseases | 298/4020 | 476/8465 | 6.59e-12 | 1.30e-10 | 7.22e-11 | 298 |
| Page: 1 2 3 |
Top |
Cell-cell communication analysis |
| Identification of potential cell-cell interactions between two cell types and their ligand-receptor pairs for different disease states |
| Ligand | Receptor | LRpair | Pathway | Tissue | Disease Stage |
| Page: 1 |
Top |
Single-cell gene regulatory network inference analysis |
| Find out the significant the regulons (TFs) and the target genes of each regulon across cell types for different disease states |
| TF | Cell Type | Tissue | Disease Stage | Target Gene | RSS | Regulon Activity |
| PRNP | MYOEPI | Breast | ADJ | ACTN1,ITGB1,MT2A, etc. | 6.07e-01 |  |
| PRNP | MYOEPI | Breast | Precancer | ACTN1,ITGB1,MT2A, etc. | 5.92e-01 |  |
| ∗The dot plots of a searched regulon are shown for all cell subpopulations in each disease state of each tissue based on the regulon specific score inferred using pySCENIC and by calculating the average expression. |
| Page: 1 |
Top |
Somatic mutation of malignant transformation related genes |
| Annotation of somatic variants for genes involved in malignant transformation |
| Hugo Symbol | Variant Class | Variant Classification | dbSNP RS | HGVSc | HGVSp | HGVSp Short | SWISSPROT | BIOTYPE | SIFT | PolyPhen | Tumor Sample Barcode | Tissue | Histology | Sex | Age | Stage | Therapy Types | Drugs | Outcome |
| PRNP | SNV | Missense_Mutation | rs74315410 | c.392N>T | p.Gly131Val | p.G131V | P04156 | protein_coding | deleterious(0) | probably_damaging(0.999) | TCGA-IR-A3LK-01 | Cervix | cervical & endocervical cancer | Female | >=65 | I/II | Chemotherapy | cisplatin | PD |
| PRNP | SNV | Missense_Mutation | rs74315408 | c.538N>A | p.Val180Ile | p.V180I | P04156 | protein_coding | tolerated(0.06) | benign(0.101) | TCGA-CK-5916-01 | Colorectum | colon adenocarcinoma | Female | >=65 | I/II | Unknown | Unknown | PD |
| PRNP | SNV | Missense_Mutation | c.77C>T | p.Pro26Leu | p.P26L | P04156 | protein_coding | deleterious(0) | probably_damaging(0.979) | TCGA-AG-A002-01 | Colorectum | rectum adenocarcinoma | Male | <65 | I/II | Unknown | Unknown | SD | |
| PRNP | SNV | Missense_Mutation | novel | c.52N>A | p.Asp18Asn | p.D18N | P04156 | protein_coding | deleterious(0) | benign(0.084) | TCGA-A5-A0G2-01 | Endometrium | uterine corpus endometrioid carcinoma | Female | <65 | III/IV | Unknown | Unknown | SD |
| PRNP | SNV | Missense_Mutation | novel | c.31N>A | p.Leu11Ile | p.L11I | P04156 | protein_coding | deleterious(0) | benign(0.2) | TCGA-AJ-A3EL-01 | Endometrium | uterine corpus endometrioid carcinoma | Female | <65 | I/II | Unknown | Unknown | SD |
| PRNP | SNV | Missense_Mutation | novel | c.653A>G | p.Tyr218Cys | p.Y218C | P04156 | protein_coding | deleterious(0) | probably_damaging(1) | TCGA-AP-A1DV-01 | Endometrium | uterine corpus endometrioid carcinoma | Female | <65 | I/II | Unknown | Unknown | SD |
| PRNP | SNV | Missense_Mutation | c.612G>T | p.Lys204Asn | p.K204N | P04156 | protein_coding | deleterious(0) | probably_damaging(0.947) | TCGA-B5-A0JY-01 | Endometrium | uterine corpus endometrioid carcinoma | Female | <65 | III/IV | Chemotherapy | doxorubicin | SD | |
| PRNP | SNV | Missense_Mutation | novel | c.100N>A | p.Gly34Arg | p.G34R | P04156 | protein_coding | tolerated(0.08) | probably_damaging(0.97) | TCGA-BG-A222-01 | Endometrium | uterine corpus endometrioid carcinoma | Female | <65 | I/II | Unknown | Unknown | SD |
| PRNP | SNV | Missense_Mutation | c.499N>A | p.Asp167Asn | p.D167N | P04156 | protein_coding | tolerated(0.16) | benign(0.061) | TCGA-D1-A17Q-01 | Endometrium | uterine corpus endometrioid carcinoma | Female | <65 | I/II | Unknown | Unknown | SD | |
| PRNP | SNV | Missense_Mutation | c.689C>T | p.Ser230Leu | p.S230L | P04156 | protein_coding | tolerated(0.15) | benign(0.331) | TCGA-DF-A2KU-01 | Endometrium | uterine corpus endometrioid carcinoma | Female | Unknown | I/II | Unknown | Unknown | SD |
| Page: 1 2 3 |
Top |
Related drugs of malignant transformation related genes |
| Identification of chemicals and drugs interact with genes involved in malignant transfromation |
| (DGIdb 4.0) |
| Entrez ID | Symbol | Category | Interaction Types | Drug Claim Name | Drug Name | PMIDs |
| 5621 | PRNP | CELL SURFACE, TRANSPORTER, DRUGGABLE GENOME | BREFELDIN A | BREFELDIN A |
| Page: 1 |

Copyright 2023-Present -The University of Texas Health Science Center at Houston |