
|
|||||
|
 | |
| |
| |
| |
| |
| |
|
Gene: NME1 |
Gene summary for NME1 |
| Gene information | Species | Human | Gene symbol | NME1 | Gene ID | 4830 |
| Gene name | NME/NM23 nucleoside diphosphate kinase 1 | |
| Gene Alias | AWD | |
| Cytomap | 17q21.33 | |
| Gene Type | protein-coding | GO ID | GO:0001678 | UniProtAcc | P15531 |
Top |
Malignant transformation analysis |
| Identification of the aberrant gene expression in precancerous and cancerous lesions by comparing the gene expression of stem-like cells in diseased tissues with normal stem cells |
| Entrez ID | Symbol | Replicates | Species | Organ | Tissue | Adj P-value | Log2FC | Malignancy |
| 4830 | NME1 | GSM4909281 | Human | Breast | IDC | 9.95e-08 | 3.53e-01 | 0.21 |
| 4830 | NME1 | GSM4909285 | Human | Breast | IDC | 2.28e-15 | 4.53e-01 | 0.21 |
| 4830 | NME1 | GSM4909286 | Human | Breast | IDC | 1.69e-27 | 5.09e-01 | 0.1081 |
| 4830 | NME1 | GSM4909287 | Human | Breast | IDC | 5.44e-03 | 2.98e-01 | 0.2057 |
| 4830 | NME1 | GSM4909288 | Human | Breast | IDC | 1.70e-03 | 2.13e-01 | 0.0988 |
| 4830 | NME1 | GSM4909290 | Human | Breast | IDC | 7.29e-13 | 5.42e-01 | 0.2096 |
| 4830 | NME1 | GSM4909294 | Human | Breast | IDC | 1.55e-12 | 4.65e-01 | 0.2022 |
| 4830 | NME1 | GSM4909297 | Human | Breast | IDC | 1.34e-07 | -1.36e-02 | 0.1517 |
| 4830 | NME1 | GSM4909298 | Human | Breast | IDC | 1.78e-03 | 2.18e-01 | 0.1551 |
| 4830 | NME1 | GSM4909307 | Human | Breast | IDC | 1.41e-08 | 3.85e-01 | 0.1569 |
| 4830 | NME1 | GSM4909308 | Human | Breast | IDC | 7.12e-19 | 5.31e-01 | 0.158 |
| 4830 | NME1 | GSM4909311 | Human | Breast | IDC | 2.09e-20 | 3.57e-04 | 0.1534 |
| 4830 | NME1 | GSM4909312 | Human | Breast | IDC | 3.64e-07 | 1.60e-01 | 0.1552 |
| 4830 | NME1 | GSM4909319 | Human | Breast | IDC | 1.90e-34 | 3.23e-02 | 0.1563 |
| 4830 | NME1 | GSM4909321 | Human | Breast | IDC | 2.22e-14 | 3.47e-01 | 0.1559 |
| 4830 | NME1 | brca1 | Human | Breast | Precancer | 1.43e-32 | 6.83e-01 | -0.0338 |
| 4830 | NME1 | brca2 | Human | Breast | Precancer | 1.19e-21 | 5.47e-01 | -0.024 |
| 4830 | NME1 | brca3 | Human | Breast | Precancer | 2.38e-06 | 4.15e-01 | -0.0263 |
| 4830 | NME1 | M1 | Human | Breast | IDC | 4.22e-08 | 4.70e-01 | 0.1577 |
| 4830 | NME1 | M2 | Human | Breast | IDC | 6.81e-07 | 4.67e-01 | 0.21 |
| Page: 1 2 3 4 5 6 7 8 9 10 11 12 |
| Tissue | Expression Dynamics | Abbreviation |
| Breast | 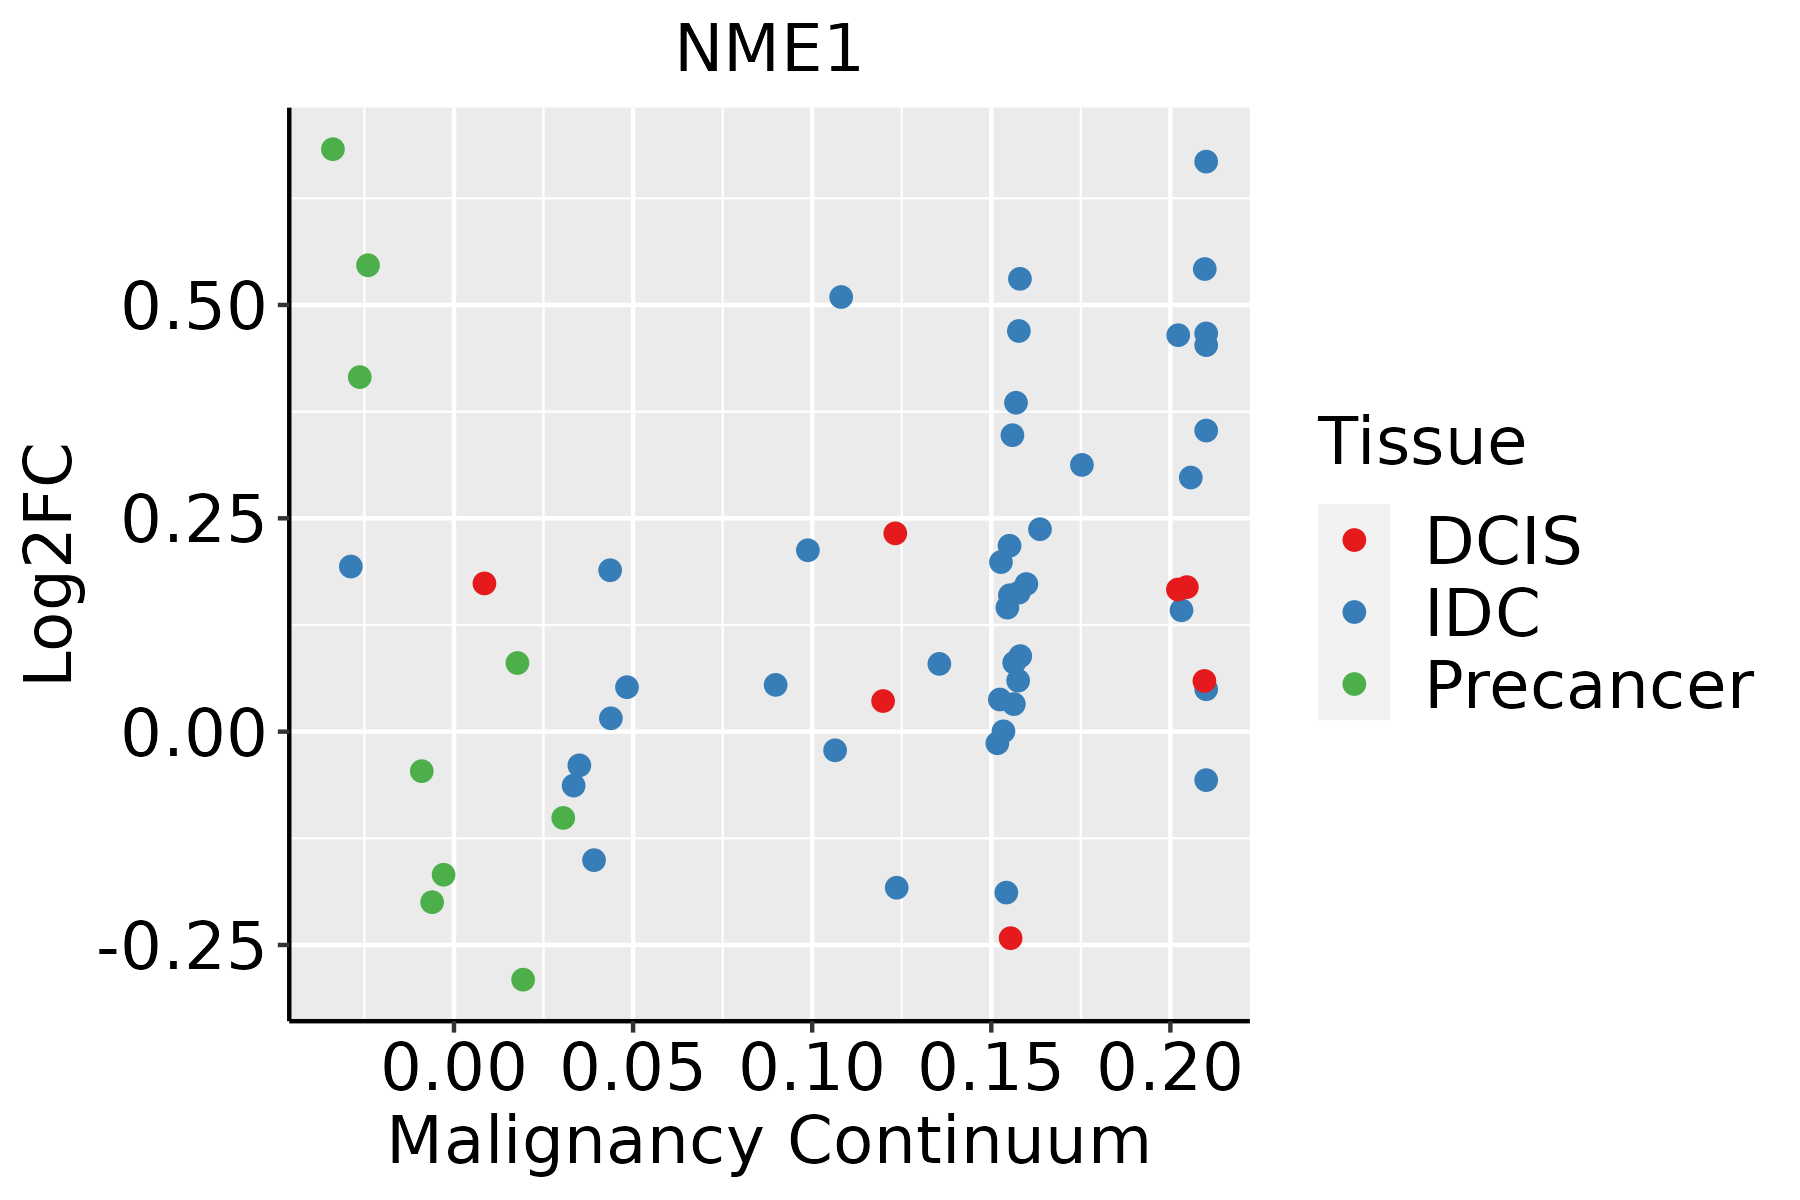 | IDC: Invasive ductal carcinoma |
| DCIS: Ductal carcinoma in situ | ||
| Precancer(BRCA1-mut): Precancerous lesion from BRCA1 mutation carriers | ||
| Colorectum (GSE201348) |  | FAP: Familial adenomatous polyposis |
| CRC: Colorectal cancer | ||
| Colorectum (HTA11) | 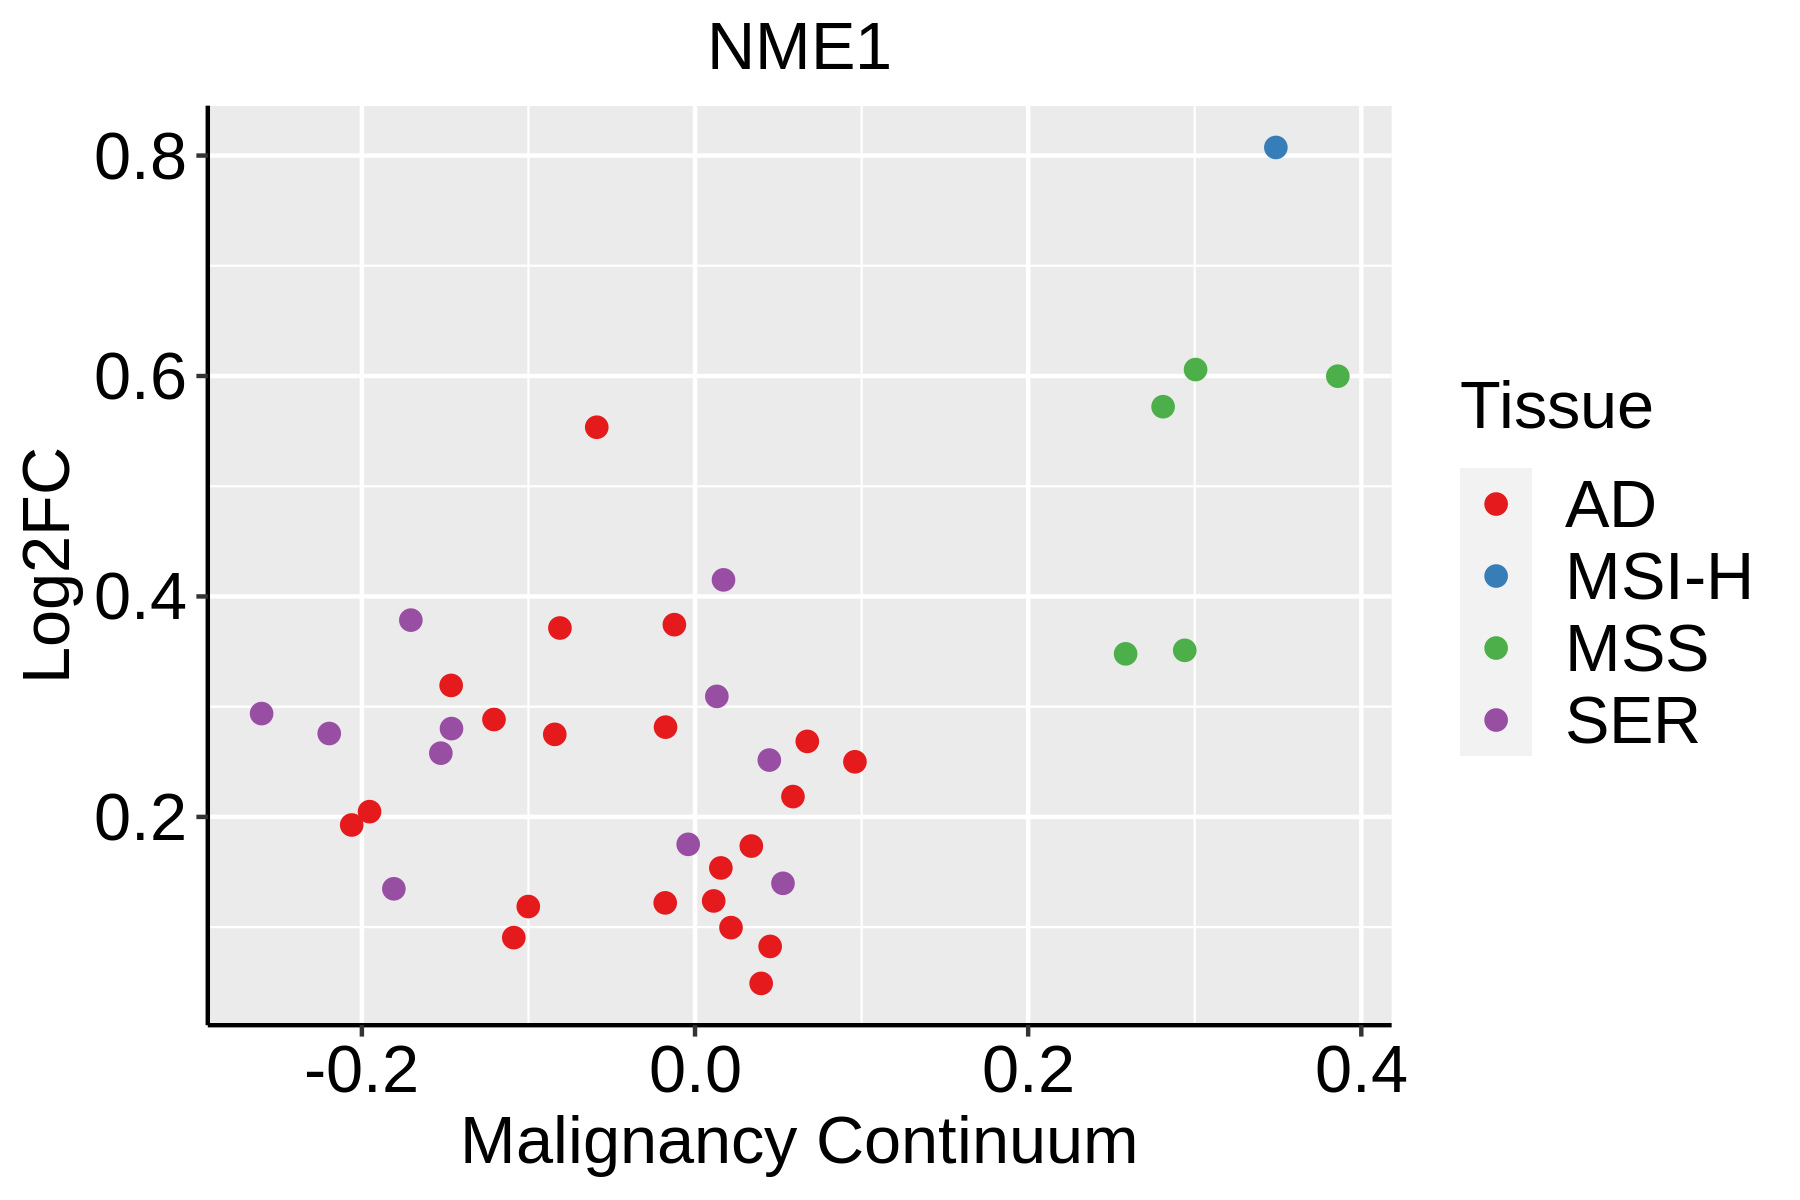 | AD: Adenomas |
| SER: Sessile serrated lesions | ||
| MSI-H: Microsatellite-high colorectal cancer | ||
| MSS: Microsatellite stable colorectal cancer | ||
| Endometrium | 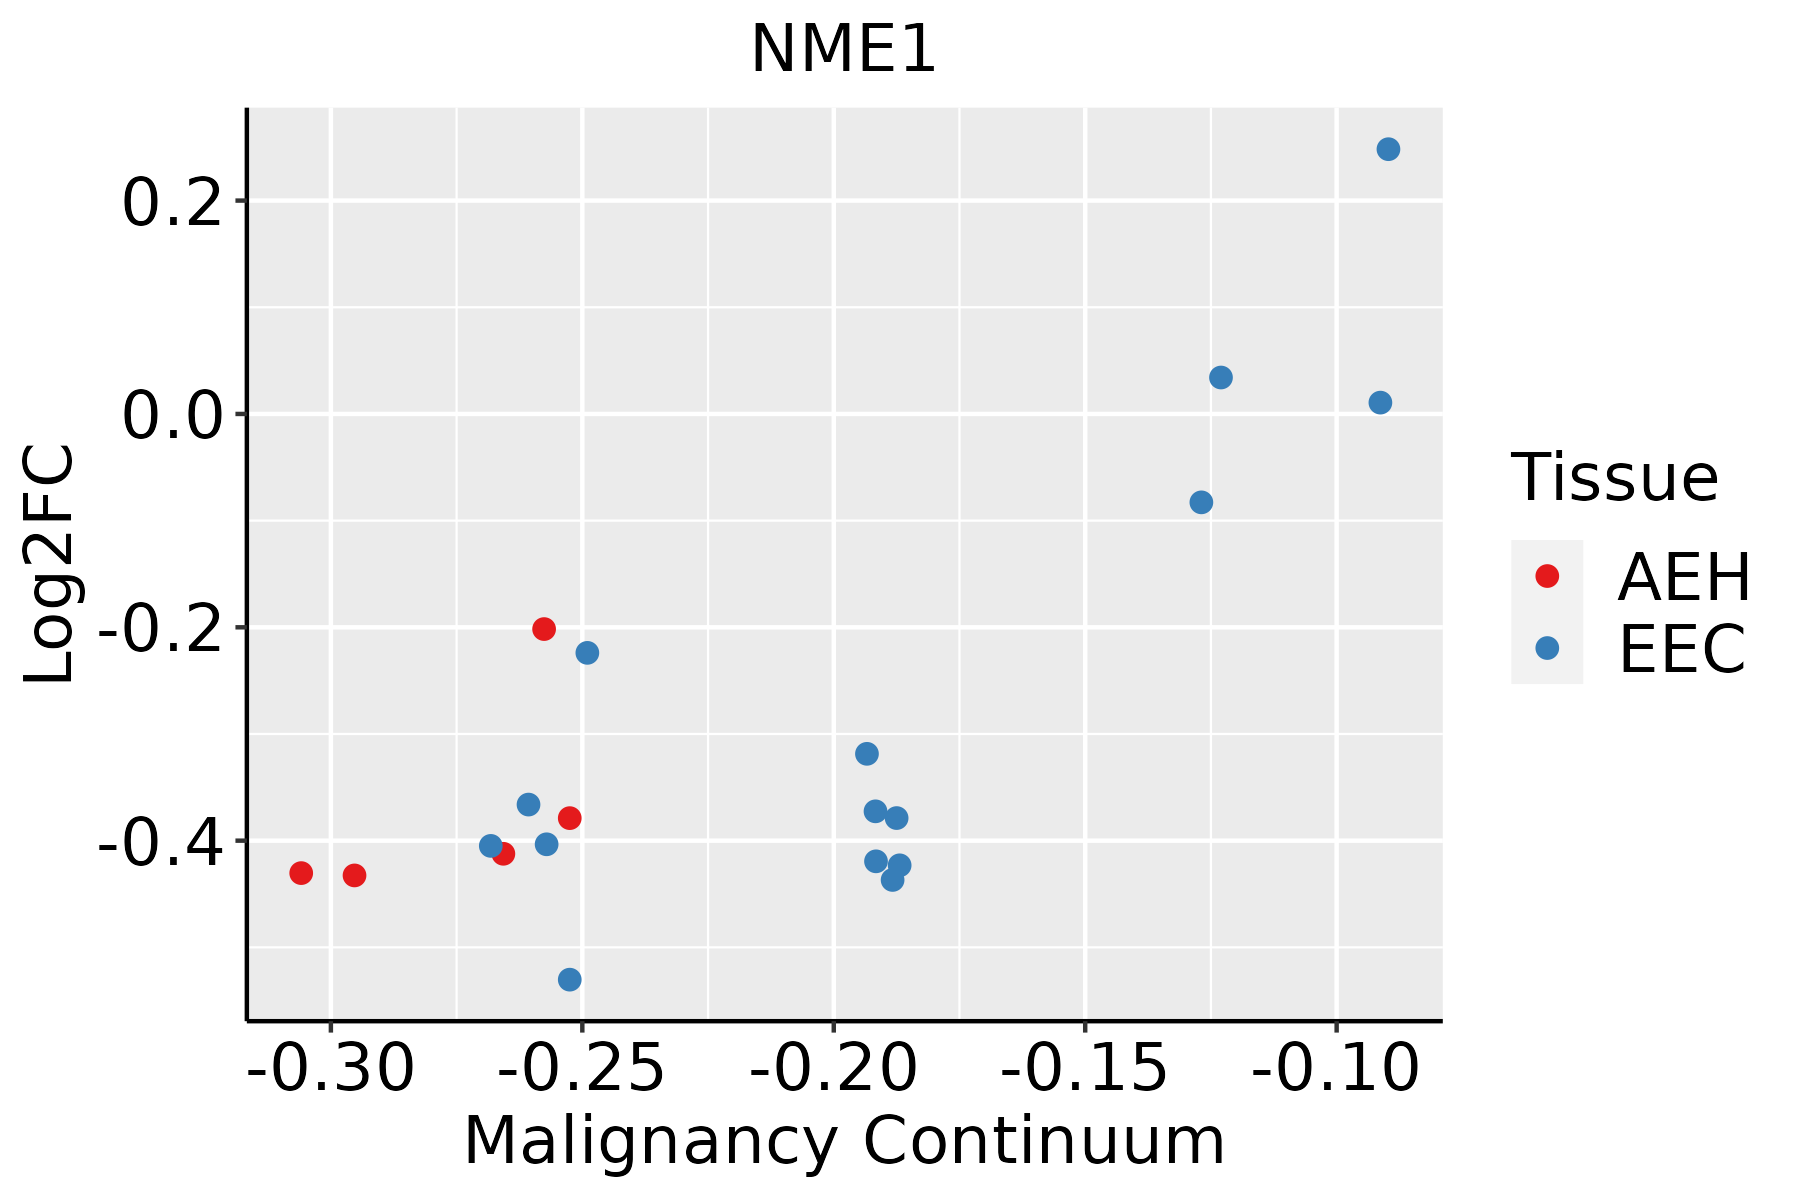 | AEH: Atypical endometrial hyperplasia |
| EEC: Endometrioid Cancer | ||
| Esophagus | 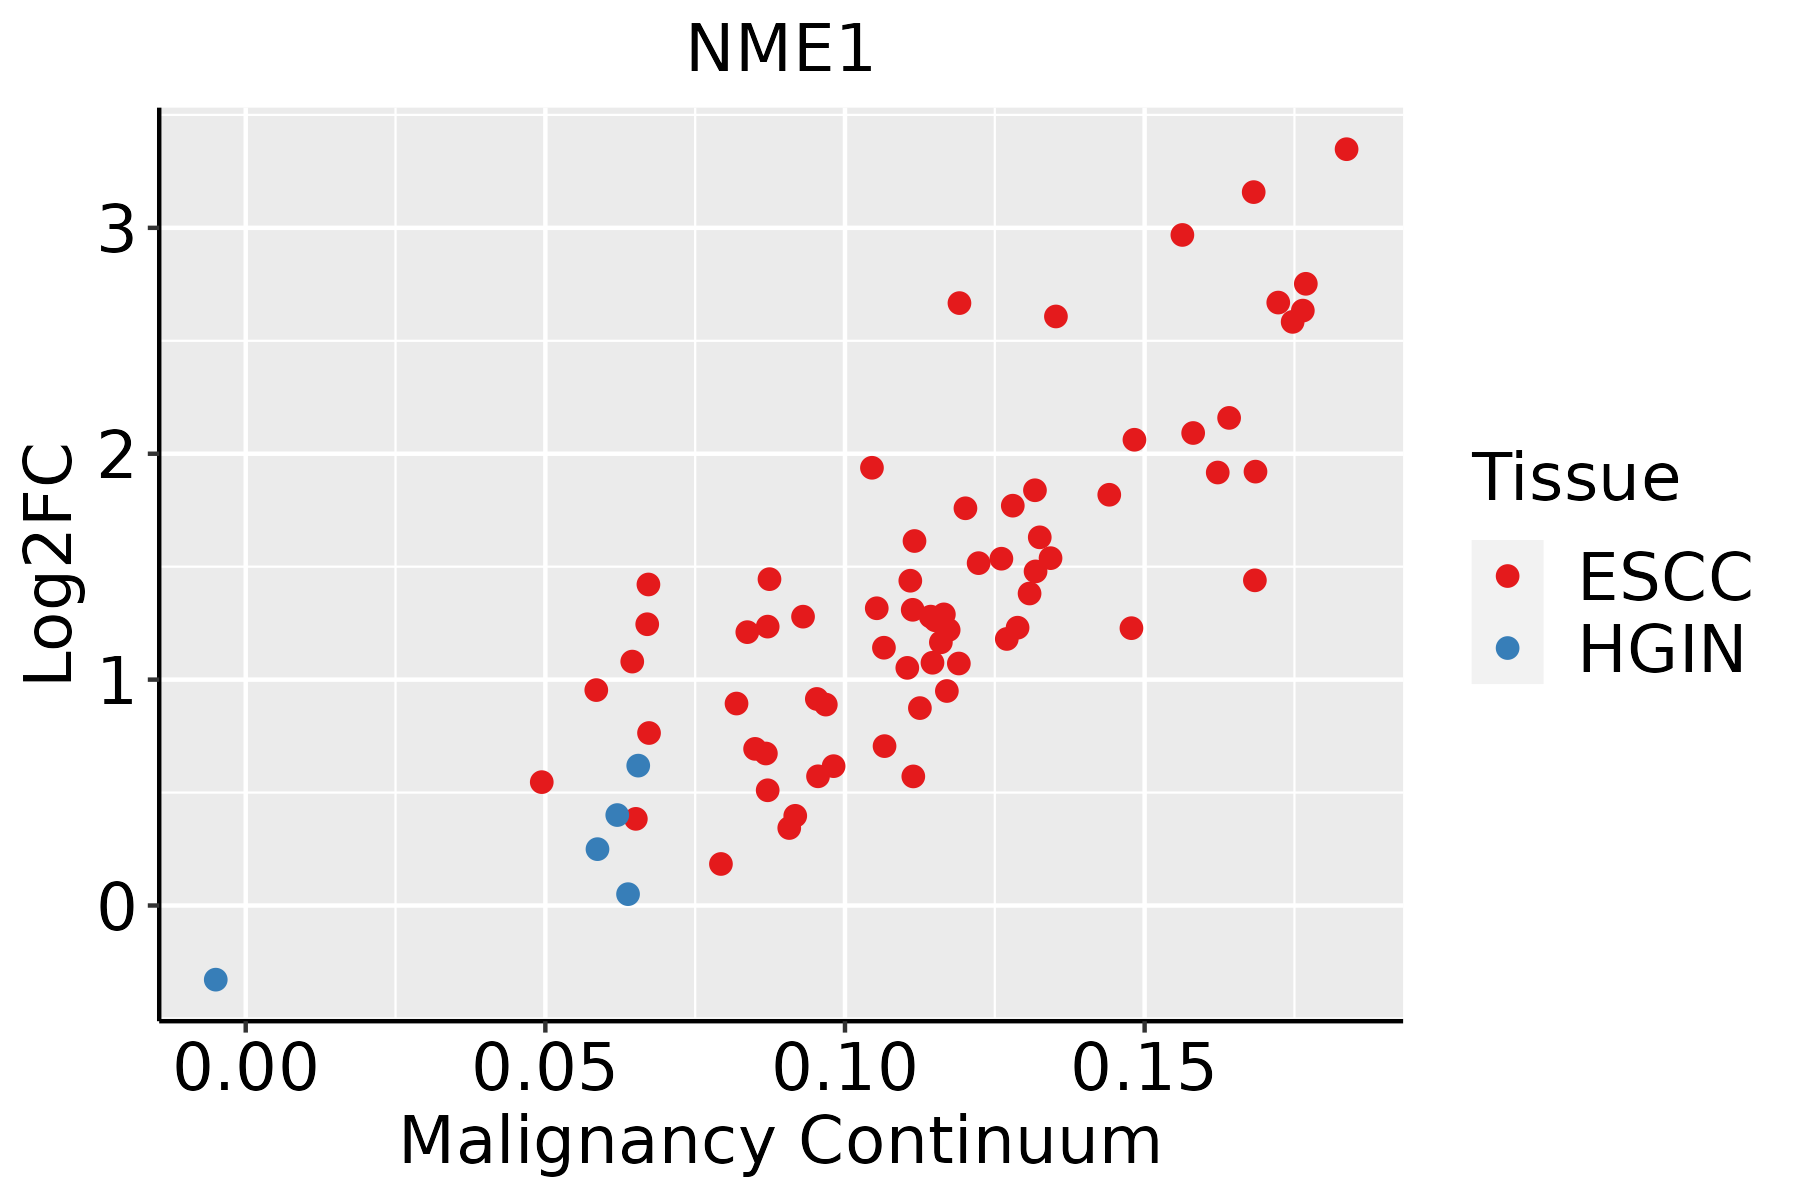 | ESCC: Esophageal squamous cell carcinoma |
| HGIN: High-grade intraepithelial neoplasias | ||
| LGIN: Low-grade intraepithelial neoplasias | ||
| GC | 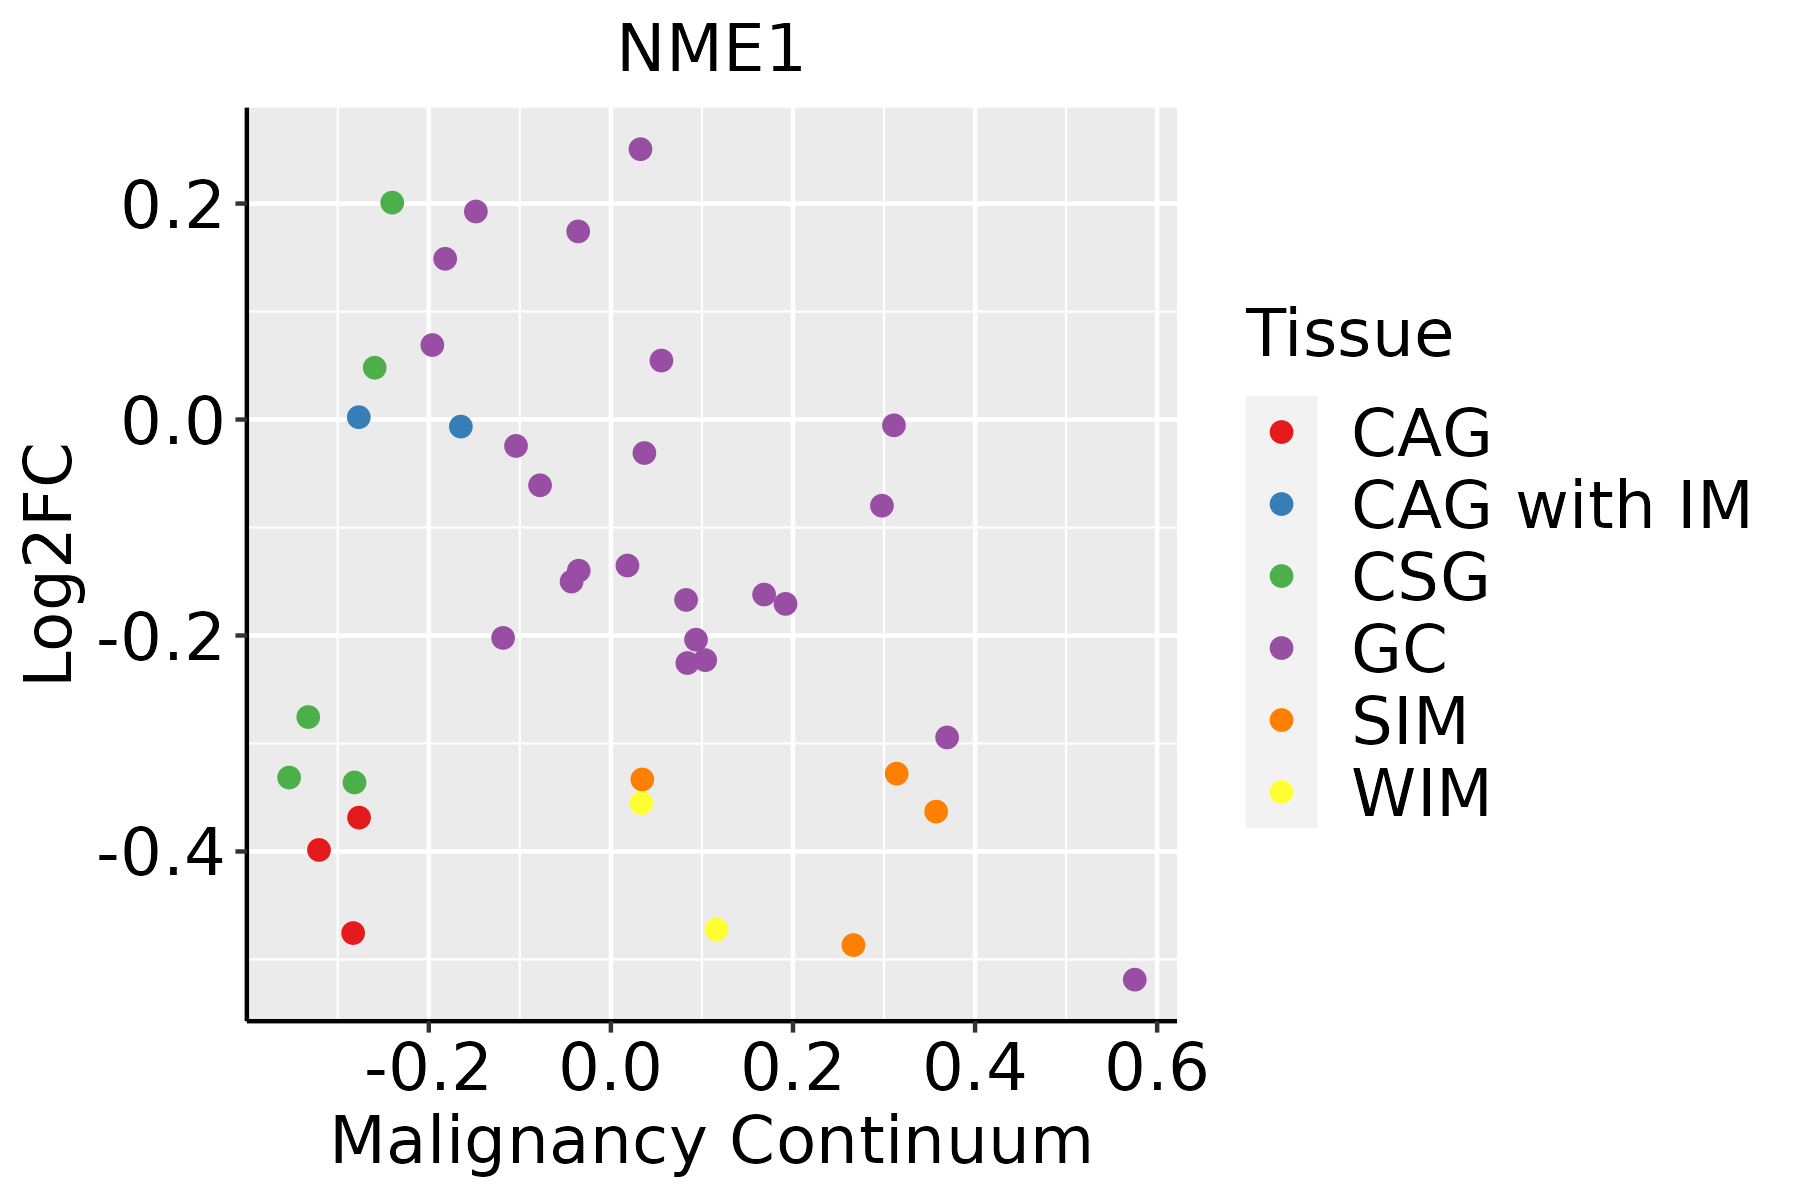 | CAG: Chronic atrophic gastritis |
| CAG with IM: Chronic atrophic gastritis with intestinal metaplasia | ||
| CSG: Chronic superficial gastritis | ||
| GC: Gastric cancer | ||
| SIM: Severe intestinal metaplasia | ||
| WIM: Wild intestinal metaplasia | ||
| Liver | 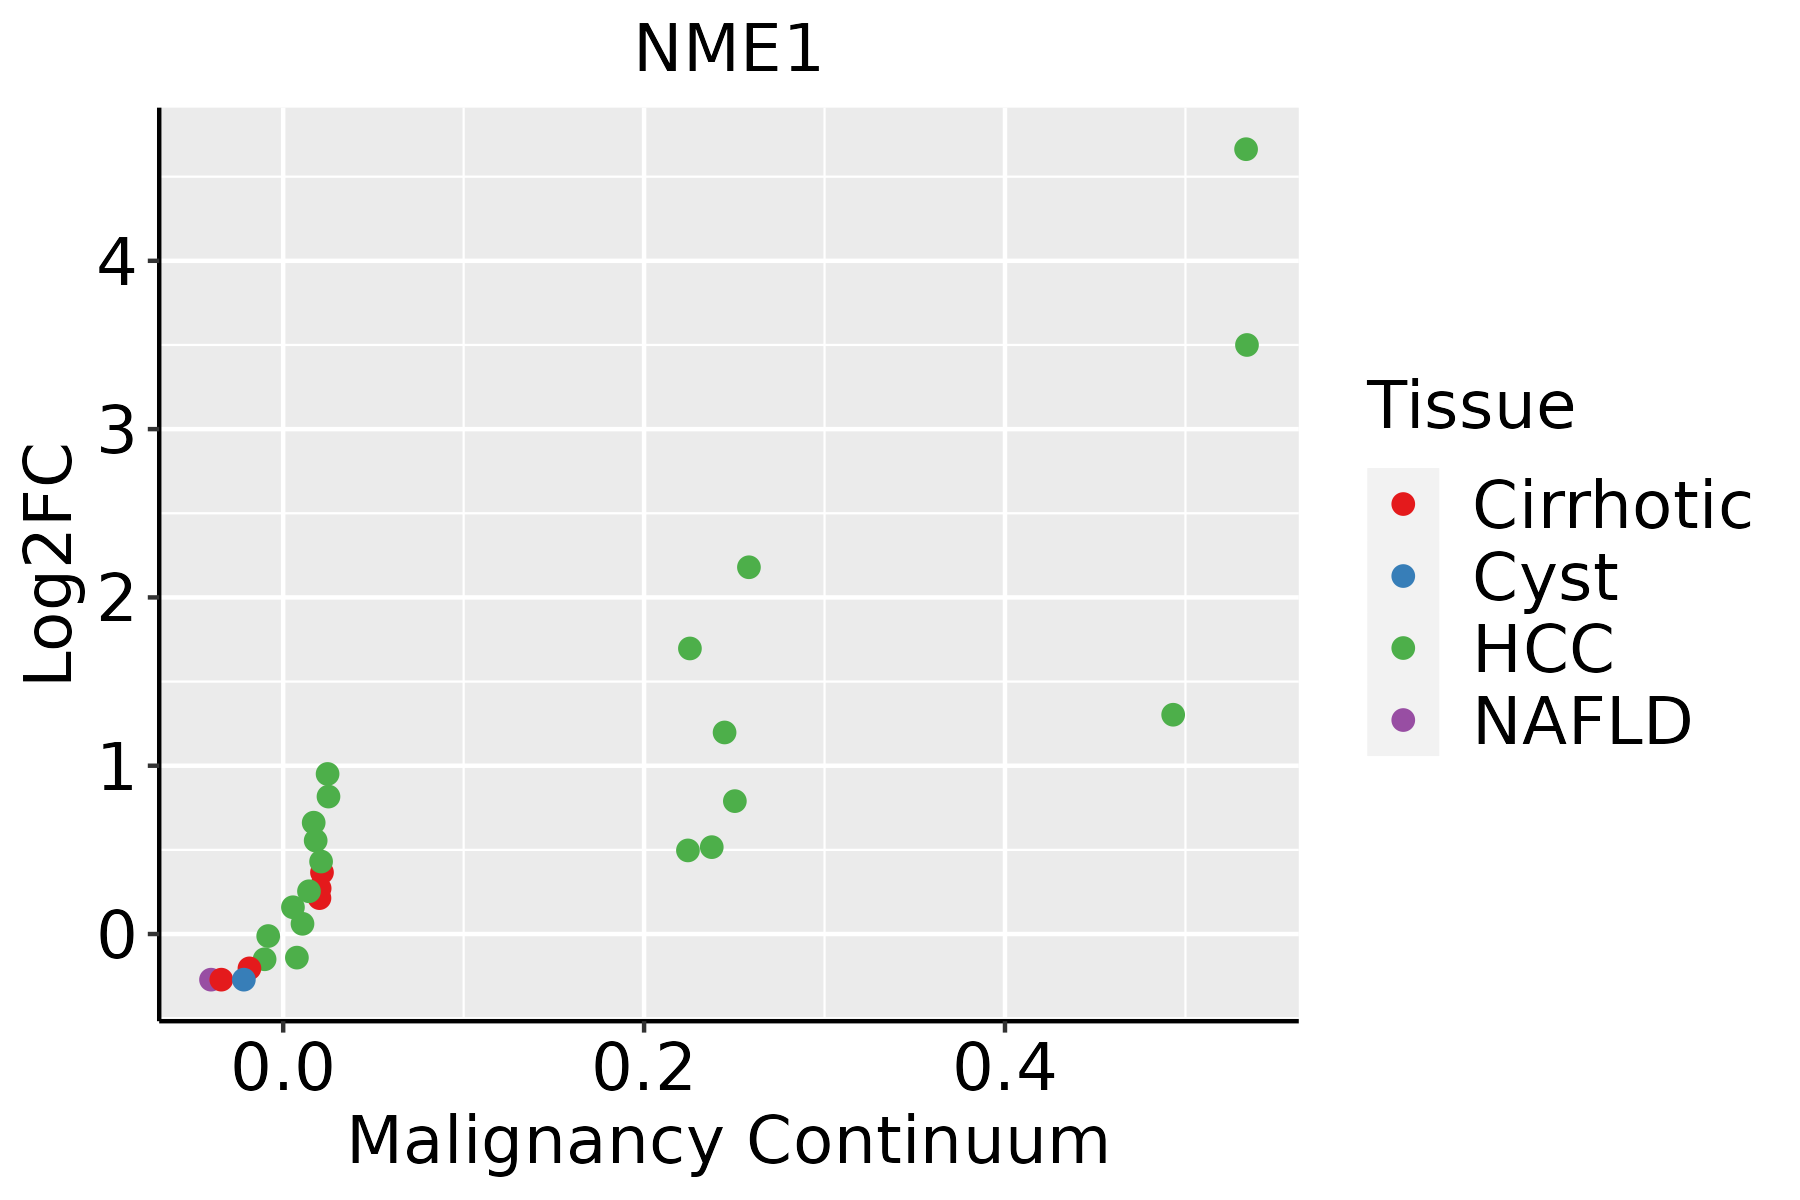 | HCC: Hepatocellular carcinoma |
| NAFLD: Non-alcoholic fatty liver disease | ||
| Oral Cavity | 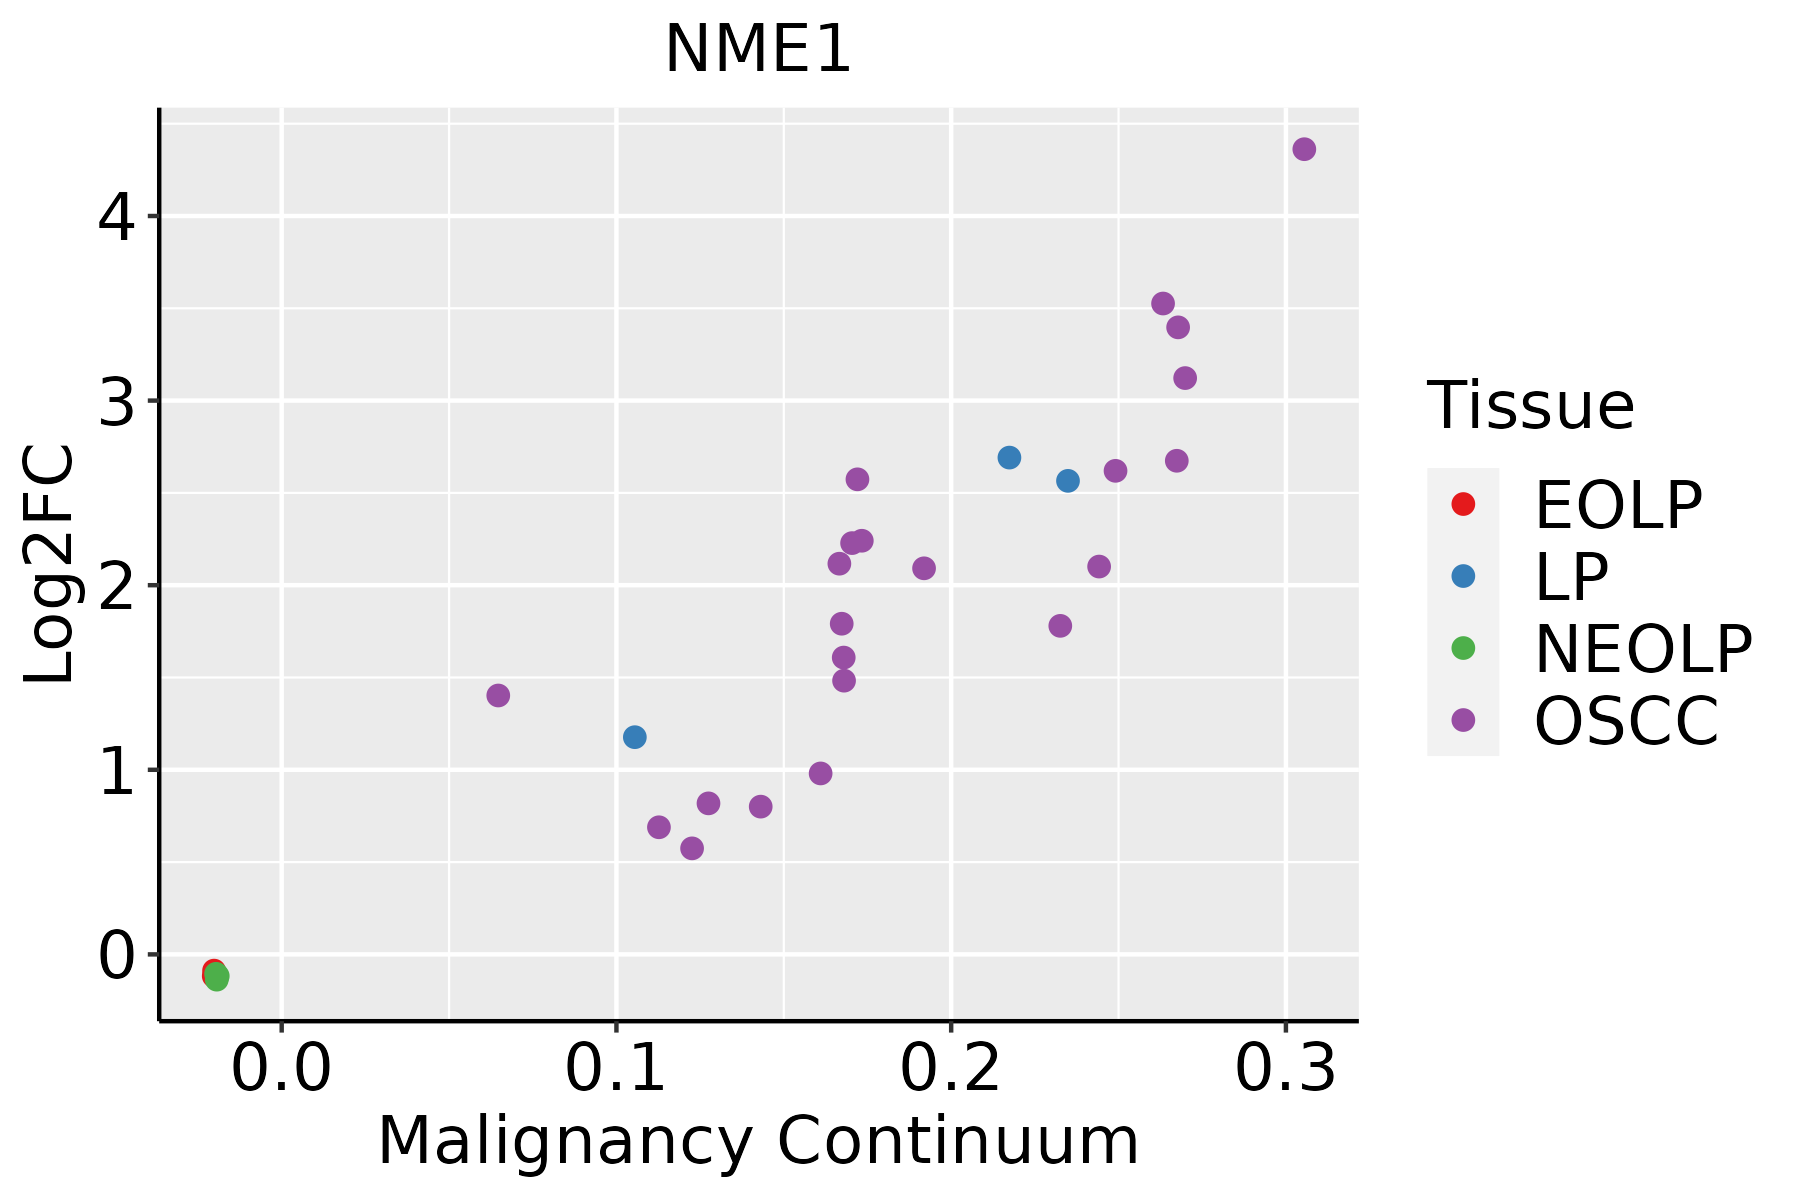 | EOLP: Erosive Oral lichen planus |
| LP: leukoplakia | ||
| NEOLP: Non-erosive oral lichen planus | ||
| OSCC: Oral squamous cell carcinoma | ||
| Prostate | 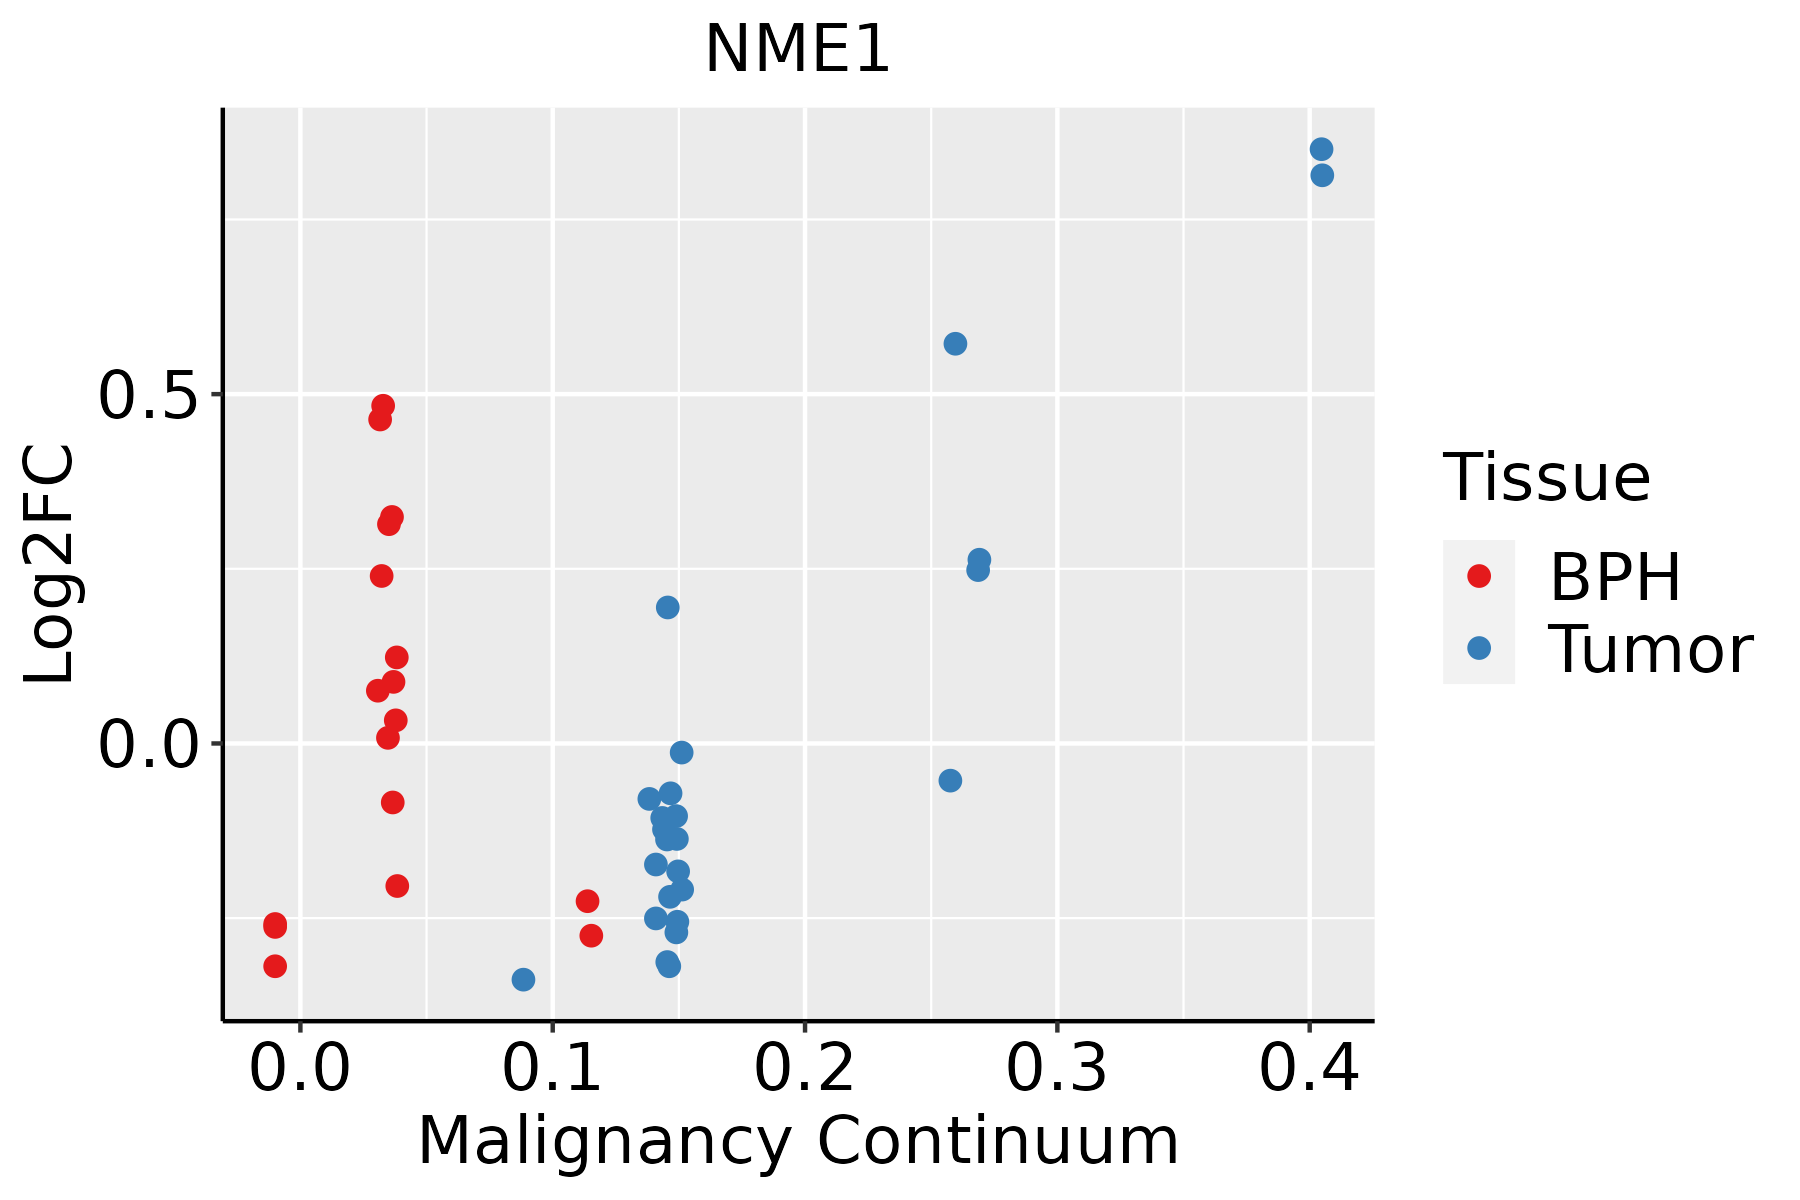 | BPH: Benign Prostatic Hyperplasia |
| Skin | 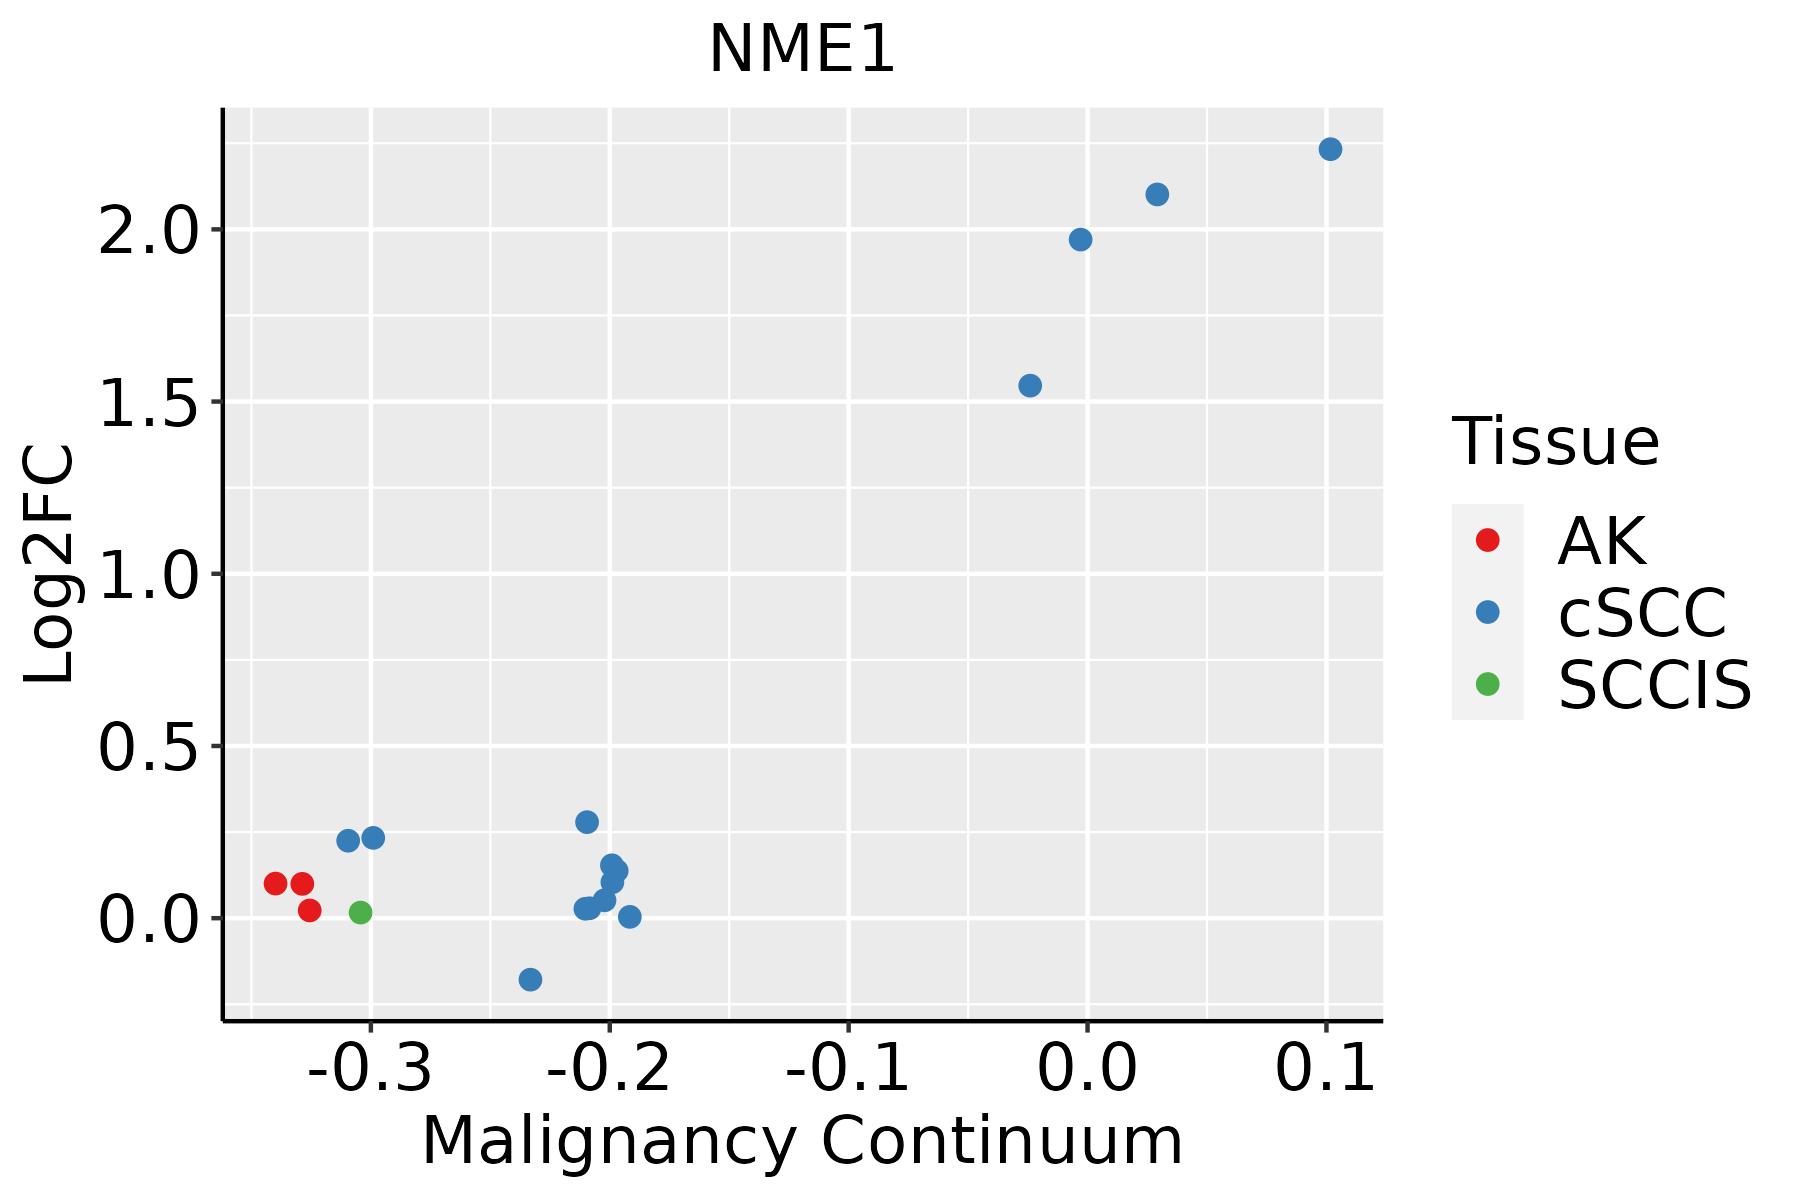 | AK: Actinic keratosis |
| cSCC: Cutaneous squamous cell carcinoma | ||
| SCCIS:squamous cell carcinoma in situ | ||
| Thyroid | 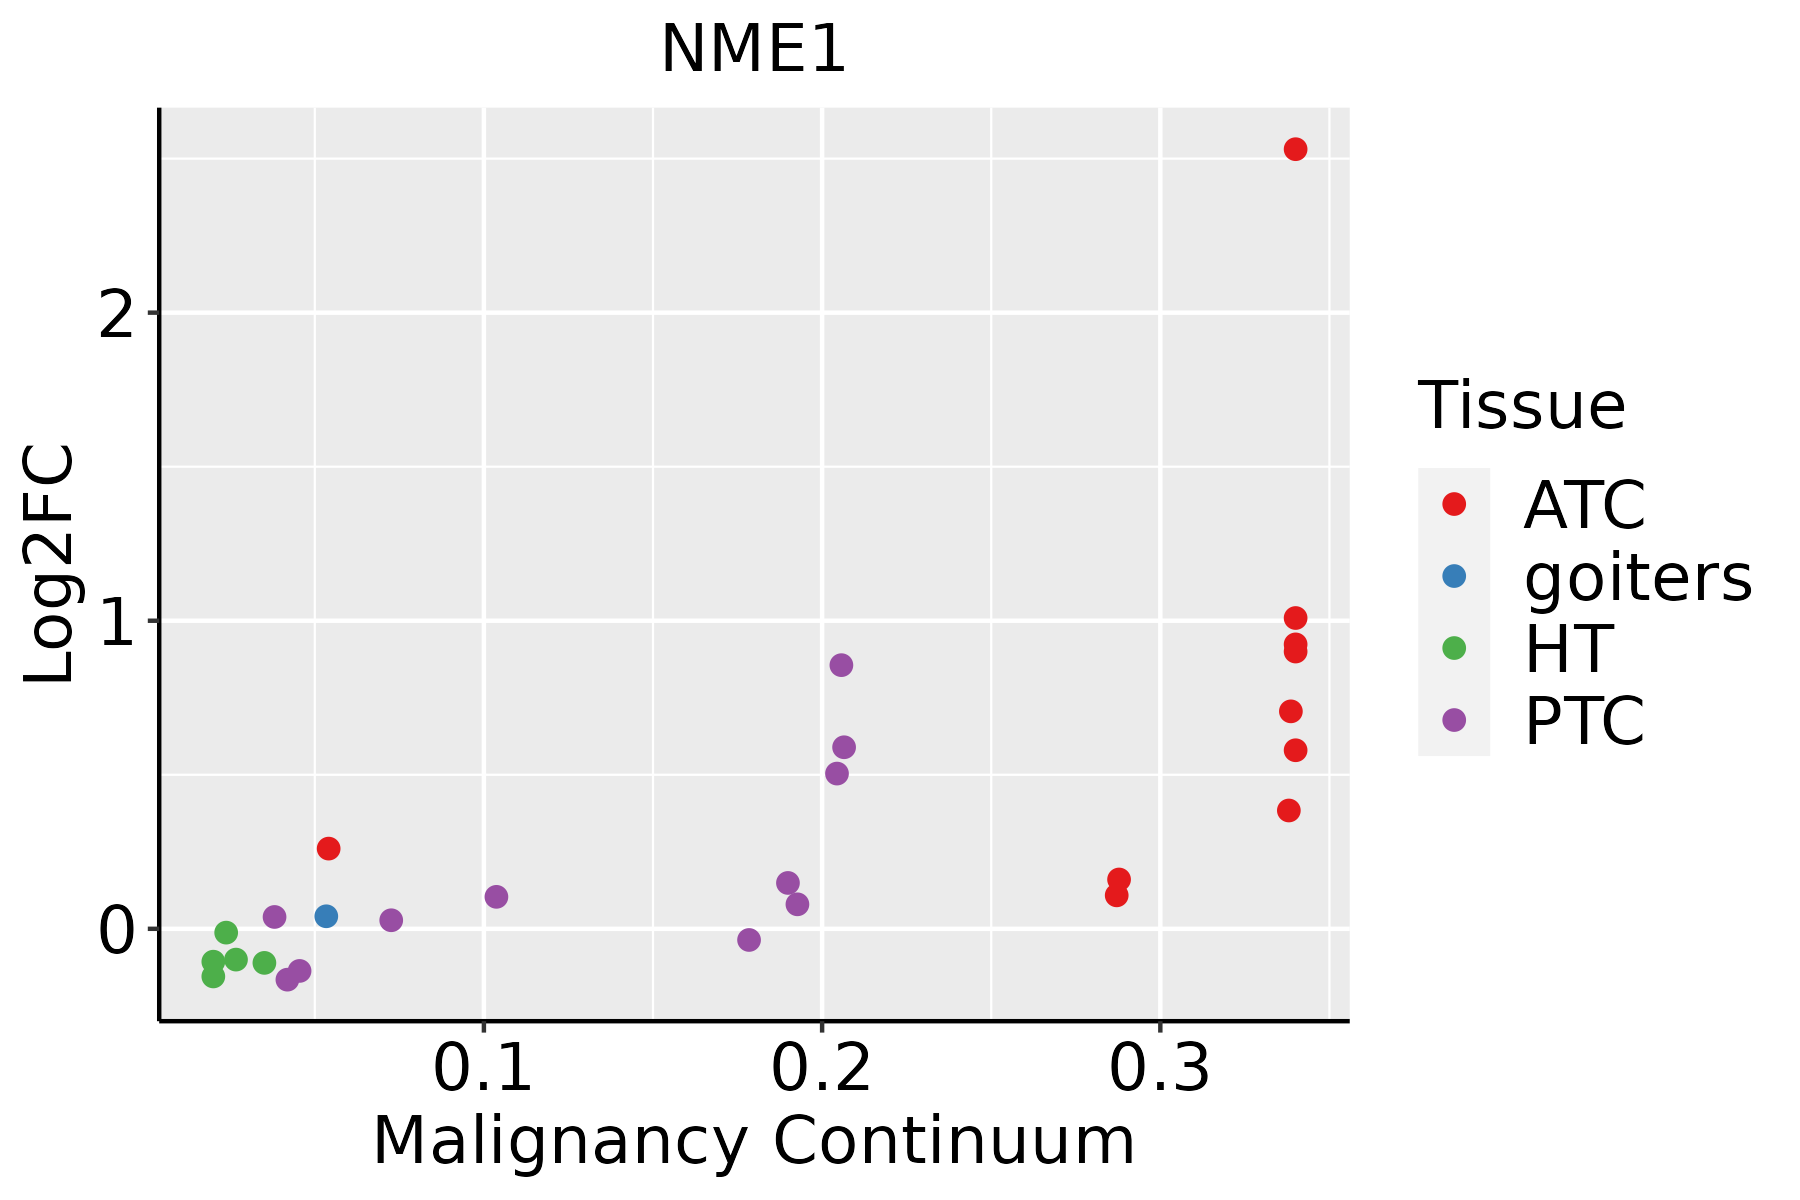 | ATC: Anaplastic thyroid cancer |
| HT: Hashimoto's thyroiditis | ||
| PTC: Papillary thyroid cancer |
| ∗log2FC in expression of this searched gene in stem-like cells from each diseased tissue sample relative to stem-like cells in normal samples in each tissue plotted against the malignancy continuum. Samples are colored based on if they are from different disease stage. |
Top |
Malignant transformation related pathway analysis |
| Find out the enriched GO biological processes and KEGG pathways involved in transition from healthy to precancer to cancer |
| Tissue | Disease Stage | Enriched GO biological Processes |
| Colorectum | AD |  |
| Colorectum | SER |  |
| Colorectum | MSS |  |
| Colorectum | MSI-H |  |
| Colorectum | FAP |  |
| ∗Top 15 enriched GO BP terms are showed in the bar plot of each disease state in each tissue. Each row represents a significant GO biological process which is colored according to the -log10(p.adjust). |
| Page: 1 2 3 4 5 6 7 8 9 |
| GO ID | Tissue | Disease Stage | Description | Gene Ratio | Bg Ratio | pvalue | p.adjust | Count |
| GO:19012934 | Liver | Cirrhotic | nucleoside phosphate biosynthetic process | 89/4634 | 256/18723 | 1.97e-04 | 1.82e-03 | 89 |
| GO:00511017 | Liver | Cirrhotic | regulation of DNA binding | 47/4634 | 118/18723 | 2.07e-04 | 1.90e-03 | 47 |
| GO:0006220 | Liver | Cirrhotic | pyrimidine nucleotide metabolic process | 24/4634 | 50/18723 | 3.06e-04 | 2.68e-03 | 24 |
| GO:00091526 | Liver | Cirrhotic | purine ribonucleotide biosynthetic process | 62/4634 | 169/18723 | 3.52e-04 | 3.00e-03 | 62 |
| GO:007139811 | Liver | Cirrhotic | cellular response to fatty acid | 19/4634 | 38/18723 | 6.75e-04 | 5.06e-03 | 19 |
| GO:00713336 | Liver | Cirrhotic | cellular response to glucose stimulus | 55/4634 | 151/18723 | 8.93e-04 | 6.41e-03 | 55 |
| GO:00091416 | Liver | Cirrhotic | nucleoside triphosphate metabolic process | 43/4634 | 112/18723 | 9.31e-04 | 6.62e-03 | 43 |
| GO:005159112 | Liver | Cirrhotic | response to cAMP | 37/4634 | 93/18723 | 9.58e-04 | 6.78e-03 | 37 |
| GO:000167812 | Liver | Cirrhotic | cellular glucose homeostasis | 61/4634 | 172/18723 | 1.06e-03 | 7.40e-03 | 61 |
| GO:004259312 | Liver | Cirrhotic | glucose homeostasis | 86/4634 | 258/18723 | 1.12e-03 | 7.73e-03 | 86 |
| GO:00725225 | Liver | Cirrhotic | purine-containing compound biosynthetic process | 69/4634 | 200/18723 | 1.22e-03 | 8.24e-03 | 69 |
| GO:00713316 | Liver | Cirrhotic | cellular response to hexose stimulus | 55/4634 | 153/18723 | 1.27e-03 | 8.56e-03 | 55 |
| GO:003350012 | Liver | Cirrhotic | carbohydrate homeostasis | 86/4634 | 259/18723 | 1.28e-03 | 8.61e-03 | 86 |
| GO:00713266 | Liver | Cirrhotic | cellular response to monosaccharide stimulus | 55/4634 | 154/18723 | 1.51e-03 | 9.91e-03 | 55 |
| GO:001407411 | Liver | Cirrhotic | response to purine-containing compound | 53/4634 | 148/18723 | 1.70e-03 | 1.08e-02 | 53 |
| GO:00713226 | Liver | Cirrhotic | cellular response to carbohydrate stimulus | 57/4634 | 163/18723 | 2.18e-03 | 1.34e-02 | 57 |
| GO:00025735 | Liver | Cirrhotic | myeloid leukocyte differentiation | 70/4634 | 208/18723 | 2.34e-03 | 1.42e-02 | 70 |
| GO:00061645 | Liver | Cirrhotic | purine nucleotide biosynthetic process | 65/4634 | 191/18723 | 2.42e-03 | 1.46e-02 | 65 |
| GO:005087812 | Liver | Cirrhotic | regulation of body fluid levels | 118/4634 | 379/18723 | 2.65e-03 | 1.55e-02 | 118 |
| GO:00091446 | Liver | Cirrhotic | purine nucleoside triphosphate metabolic process | 34/4634 | 88/18723 | 2.68e-03 | 1.57e-02 | 34 |
| Page: 1 2 3 4 5 6 7 8 9 10 11 12 13 14 15 16 17 18 19 20 21 22 23 24 25 26 27 28 29 30 31 32 33 34 35 36 37 38 39 40 41 42 43 44 45 46 47 48 49 50 51 52 53 54 55 56 57 58 59 60 61 62 63 64 65 66 67 68 |
| Pathway ID | Tissue | Disease Stage | Description | Gene Ratio | Bg Ratio | pvalue | p.adjust | qvalue | Count |
| hsa012325 | Esophagus | ESCC | Nucleotide metabolism | 59/4205 | 85/8465 | 1.67e-04 | 6.58e-04 | 3.37e-04 | 59 |
| hsa012405 | Esophagus | ESCC | Biosynthesis of cofactors | 97/4205 | 153/8465 | 3.88e-04 | 1.35e-03 | 6.94e-04 | 97 |
| hsa002405 | Esophagus | ESCC | Pyrimidine metabolism | 41/4205 | 58/8465 | 9.14e-04 | 2.92e-03 | 1.49e-03 | 41 |
| hsa0123212 | Esophagus | ESCC | Nucleotide metabolism | 59/4205 | 85/8465 | 1.67e-04 | 6.58e-04 | 3.37e-04 | 59 |
| hsa0124012 | Esophagus | ESCC | Biosynthesis of cofactors | 97/4205 | 153/8465 | 3.88e-04 | 1.35e-03 | 6.94e-04 | 97 |
| hsa0024012 | Esophagus | ESCC | Pyrimidine metabolism | 41/4205 | 58/8465 | 9.14e-04 | 2.92e-03 | 1.49e-03 | 41 |
| hsa01240 | Liver | Cirrhotic | Biosynthesis of cofactors | 66/2530 | 153/8465 | 3.11e-04 | 1.99e-03 | 1.23e-03 | 66 |
| hsa01232 | Liver | Cirrhotic | Nucleotide metabolism | 39/2530 | 85/8465 | 1.27e-03 | 6.73e-03 | 4.15e-03 | 39 |
| hsa00240 | Liver | Cirrhotic | Pyrimidine metabolism | 27/2530 | 58/8465 | 5.31e-03 | 1.88e-02 | 1.16e-02 | 27 |
| hsa00983 | Liver | Cirrhotic | Drug metabolism - other enzymes | 34/2530 | 80/8465 | 1.08e-02 | 3.57e-02 | 2.20e-02 | 34 |
| hsa012401 | Liver | Cirrhotic | Biosynthesis of cofactors | 66/2530 | 153/8465 | 3.11e-04 | 1.99e-03 | 1.23e-03 | 66 |
| hsa012321 | Liver | Cirrhotic | Nucleotide metabolism | 39/2530 | 85/8465 | 1.27e-03 | 6.73e-03 | 4.15e-03 | 39 |
| hsa002401 | Liver | Cirrhotic | Pyrimidine metabolism | 27/2530 | 58/8465 | 5.31e-03 | 1.88e-02 | 1.16e-02 | 27 |
| hsa009831 | Liver | Cirrhotic | Drug metabolism - other enzymes | 34/2530 | 80/8465 | 1.08e-02 | 3.57e-02 | 2.20e-02 | 34 |
| hsa012402 | Liver | HCC | Biosynthesis of cofactors | 103/4020 | 153/8465 | 4.67e-07 | 5.05e-06 | 2.81e-06 | 103 |
| hsa002402 | Liver | HCC | Pyrimidine metabolism | 44/4020 | 58/8465 | 9.34e-06 | 7.11e-05 | 3.95e-05 | 44 |
| hsa012322 | Liver | HCC | Nucleotide metabolism | 59/4020 | 85/8465 | 3.30e-05 | 1.88e-04 | 1.04e-04 | 59 |
| hsa009832 | Liver | HCC | Drug metabolism - other enzymes | 54/4020 | 80/8465 | 2.25e-04 | 1.09e-03 | 6.08e-04 | 54 |
| hsa012403 | Liver | HCC | Biosynthesis of cofactors | 103/4020 | 153/8465 | 4.67e-07 | 5.05e-06 | 2.81e-06 | 103 |
| hsa002403 | Liver | HCC | Pyrimidine metabolism | 44/4020 | 58/8465 | 9.34e-06 | 7.11e-05 | 3.95e-05 | 44 |
| Page: 1 2 |
Top |
Cell-cell communication analysis |
| Identification of potential cell-cell interactions between two cell types and their ligand-receptor pairs for different disease states |
| Ligand | Receptor | LRpair | Pathway | Tissue | Disease Stage |
| Page: 1 |
Top |
Single-cell gene regulatory network inference analysis |
| Find out the significant the regulons (TFs) and the target genes of each regulon across cell types for different disease states |
| TF | Cell Type | Tissue | Disease Stage | Target Gene | RSS | Regulon Activity |
| ∗The dot plots of a searched regulon are shown for all cell subpopulations in each disease state of each tissue based on the regulon specific score inferred using pySCENIC and by calculating the average expression. |
| Page: 1 |
Top |
Somatic mutation of malignant transformation related genes |
| Annotation of somatic variants for genes involved in malignant transformation |
| Hugo Symbol | Variant Class | Variant Classification | dbSNP RS | HGVSc | HGVSp | HGVSp Short | SWISSPROT | BIOTYPE | SIFT | PolyPhen | Tumor Sample Barcode | Tissue | Histology | Sex | Age | Stage | Therapy Types | Drugs | Outcome |
| NME1 | SNV | Missense_Mutation | novel | c.244N>T | p.Asp82Tyr | p.D82Y | P15531 | protein_coding | deleterious(0) | possibly_damaging(0.748) | TCGA-2W-A8YY-01 | Cervix | cervical & endocervical cancer | Female | <65 | I/II | Chemotherapy | cisplatin | CR |
| NME1 | SNV | Missense_Mutation | rs549666032 | c.92G>A | p.Arg31His | p.R31H | P15531 | protein_coding | tolerated(0.05) | benign(0.125) | TCGA-B5-A3FA-01 | Endometrium | uterine corpus endometrioid carcinoma | Female | >=65 | I/II | Unknown | Unknown | SD |
| NME1 | SNV | Missense_Mutation | rs749825423 | c.248G>A | p.Arg83His | p.R83H | P15531 | protein_coding | tolerated(0.14) | benign(0.013) | TCGA-D1-A17Q-01 | Endometrium | uterine corpus endometrioid carcinoma | Female | <65 | I/II | Unknown | Unknown | SD |
| NME1 | SNV | Missense_Mutation | novel | c.293T>C | p.Val98Ala | p.V98A | P15531 | protein_coding | deleterious(0) | possibly_damaging(0.515) | TCGA-D1-A2G5-01 | Endometrium | uterine corpus endometrioid carcinoma | Female | <65 | I/II | Unknown | Unknown | PD |
| NME1 | SNV | Missense_Mutation | rs765050521 | c.176N>A | p.Arg59His | p.R59H | P15531 | protein_coding | tolerated(0.09) | benign(0.019) | TCGA-4R-AA8I-01 | Liver | liver hepatocellular carcinoma | Male | >=65 | I/II | Unknown | Unknown | PD |
| NME1 | SNV | Missense_Mutation | c.461N>T | p.Glu154Val | p.E154V | P15531 | protein_coding | deleterious(0) | probably_damaging(1) | TCGA-CC-A7IH-01 | Liver | liver hepatocellular carcinoma | Male | <65 | III/IV | Unknown | Unknown | SD | |
| NME1 | SNV | Missense_Mutation | novel | c.142N>C | p.Glu48Gln | p.E48Q | P15531 | protein_coding | deleterious(0.05) | benign(0.118) | TCGA-60-2707-01 | Lung | lung squamous cell carcinoma | Male | >=65 | I/II | Chemotherapy | gemcitabine | PD |
| NME1 | SNV | Missense_Mutation | novel | c.442N>A | p.Val148Met | p.V148M | P15531 | protein_coding | deleterious(0) | benign(0.347) | TCGA-XA-A8JR-01 | Prostate | prostate adenocarcinoma | Male | >=65 | 7 | Unknown | Unknown | SD |
| Page: 1 |
Top |
Related drugs of malignant transformation related genes |
| Identification of chemicals and drugs interact with genes involved in malignant transfromation |
| (DGIdb 4.0) |
| Entrez ID | Symbol | Category | Interaction Types | Drug Claim Name | Drug Name | PMIDs |
| 4830 | NME1 | KINASE | tenofovir | TENOFOVIR | ||
| 4830 | NME1 | KINASE | lamivudine | LAMIVUDINE | ||
| 4830 | NME1 | KINASE | zidovudine | ZIDOVUDINE | 22960662 | |
| 4830 | NME1 | KINASE | LYCOPENE | LYCOPENE | 16140886 | |
| 4830 | NME1 | KINASE | adefovir dipivoxil |
| Page: 1 |

Copyright 2023-Present -The University of Texas Health Science Center at Houston |