Schematic overview of the cellular and molecular mechanisms involved in the cancer progression, including the proposed cellular and molecular mechanisms in cancer cells trajectory. AT1: alveolar type 1 cells; AT2: alveolar type 2 cells; AAH: atypical adenomatous hyperplasia; AIS: adenocarcinoma in situ; MIA: minimally invasive adenocarcinoma; IA: invasive adenocarcinoma; EMT: epithelial-mesenchymal transition

Home

Download

Statistics

Help

Contact

Center for Computational Systems Medicine
leaf

Gene summary

leaf

Malignant transformation analysis

leaf

Malignant transformation related pathway analysis

leaf

Cell-cell communication analysis

leaf

Single-cell gene regulatory network inference analysis

leaf

Somatic mutation of malignant transformation related genes

leaf

Related drugs of malignant transformation related genes

Gene: KDM1A

Gene summary for KDM1A

check button Gene summary.

Gene informationSpeciesHuman
Gene symbol

KDM1A

Gene ID

23028

Gene namelysine demethylase 1A
Gene AliasAOF2
Cytomap1p36.12
Gene Typeprotein-coding
GO ID

GO:0000018

UniProtAcc

O60341


Top

Malignant transformation analysis

check button Identification of the aberrant gene expression in precancerous and cancerous lesions by comparing the gene expression of stem-like cells in diseased tissues with normal stem cells
check button Malignant transformation involving gene list.
Entrez IDSymbolReplicatesSpeciesOrganTissueAdj P-valueLog2FCMalignancy
23028KDM1ALZE4THumanEsophagusESCC4.48e-026.20e-020.0811
23028KDM1ALZE20THumanEsophagusESCC4.39e-021.20e-010.0662
23028KDM1ALZE24THumanEsophagusESCC1.20e-052.14e-010.0596
23028KDM1AP1T-EHumanEsophagusESCC2.80e-082.74e-010.0875
23028KDM1AP2T-EHumanEsophagusESCC1.84e-589.23e-010.1177
23028KDM1AP4T-EHumanEsophagusESCC3.06e-174.34e-010.1323
23028KDM1AP5T-EHumanEsophagusESCC5.26e-163.03e-010.1327
23028KDM1AP8T-EHumanEsophagusESCC6.81e-121.67e-010.0889
23028KDM1AP9T-EHumanEsophagusESCC6.03e-171.68e-010.1131
23028KDM1AP10T-EHumanEsophagusESCC1.54e-254.72e-010.116
23028KDM1AP11T-EHumanEsophagusESCC9.05e-032.35e-010.1426
23028KDM1AP12T-EHumanEsophagusESCC1.57e-142.41e-010.1122
23028KDM1AP15T-EHumanEsophagusESCC5.24e-102.98e-010.1149
23028KDM1AP16T-EHumanEsophagusESCC9.99e-091.43e-010.1153
23028KDM1AP17T-EHumanEsophagusESCC3.63e-132.88e-010.1278
23028KDM1AP20T-EHumanEsophagusESCC1.04e-143.48e-010.1124
23028KDM1AP21T-EHumanEsophagusESCC1.28e-173.35e-010.1617
23028KDM1AP22T-EHumanEsophagusESCC5.86e-141.73e-010.1236
23028KDM1AP23T-EHumanEsophagusESCC3.15e-153.15e-010.108
23028KDM1AP24T-EHumanEsophagusESCC5.78e-132.29e-010.1287
Page: 1 2 3 4 5 6 7 

check button Transcriptomic changes along malignancy continuum.
TissueExpression DynamicsAbbreviation
EsophagusThe image shows the transcriptomic changes along malignancy continuum.log2FC in expression of this searched gene in stem-like cells from each diseased tissue sample relative to stem-like cells in normal samples in each tissue plotted against the malignancy continuum. Samples are colored based on if they are from different disease stage.ESCC: Esophageal squamous cell carcinoma
HGIN: High-grade intraepithelial neoplasias
LGIN: Low-grade intraepithelial neoplasias
LiverThe image shows the transcriptomic changes along malignancy continuum.log2FC in expression of this searched gene in stem-like cells from each diseased tissue sample relative to stem-like cells in normal samples in each tissue plotted against the malignancy continuum. Samples are colored based on if they are from different disease stage.
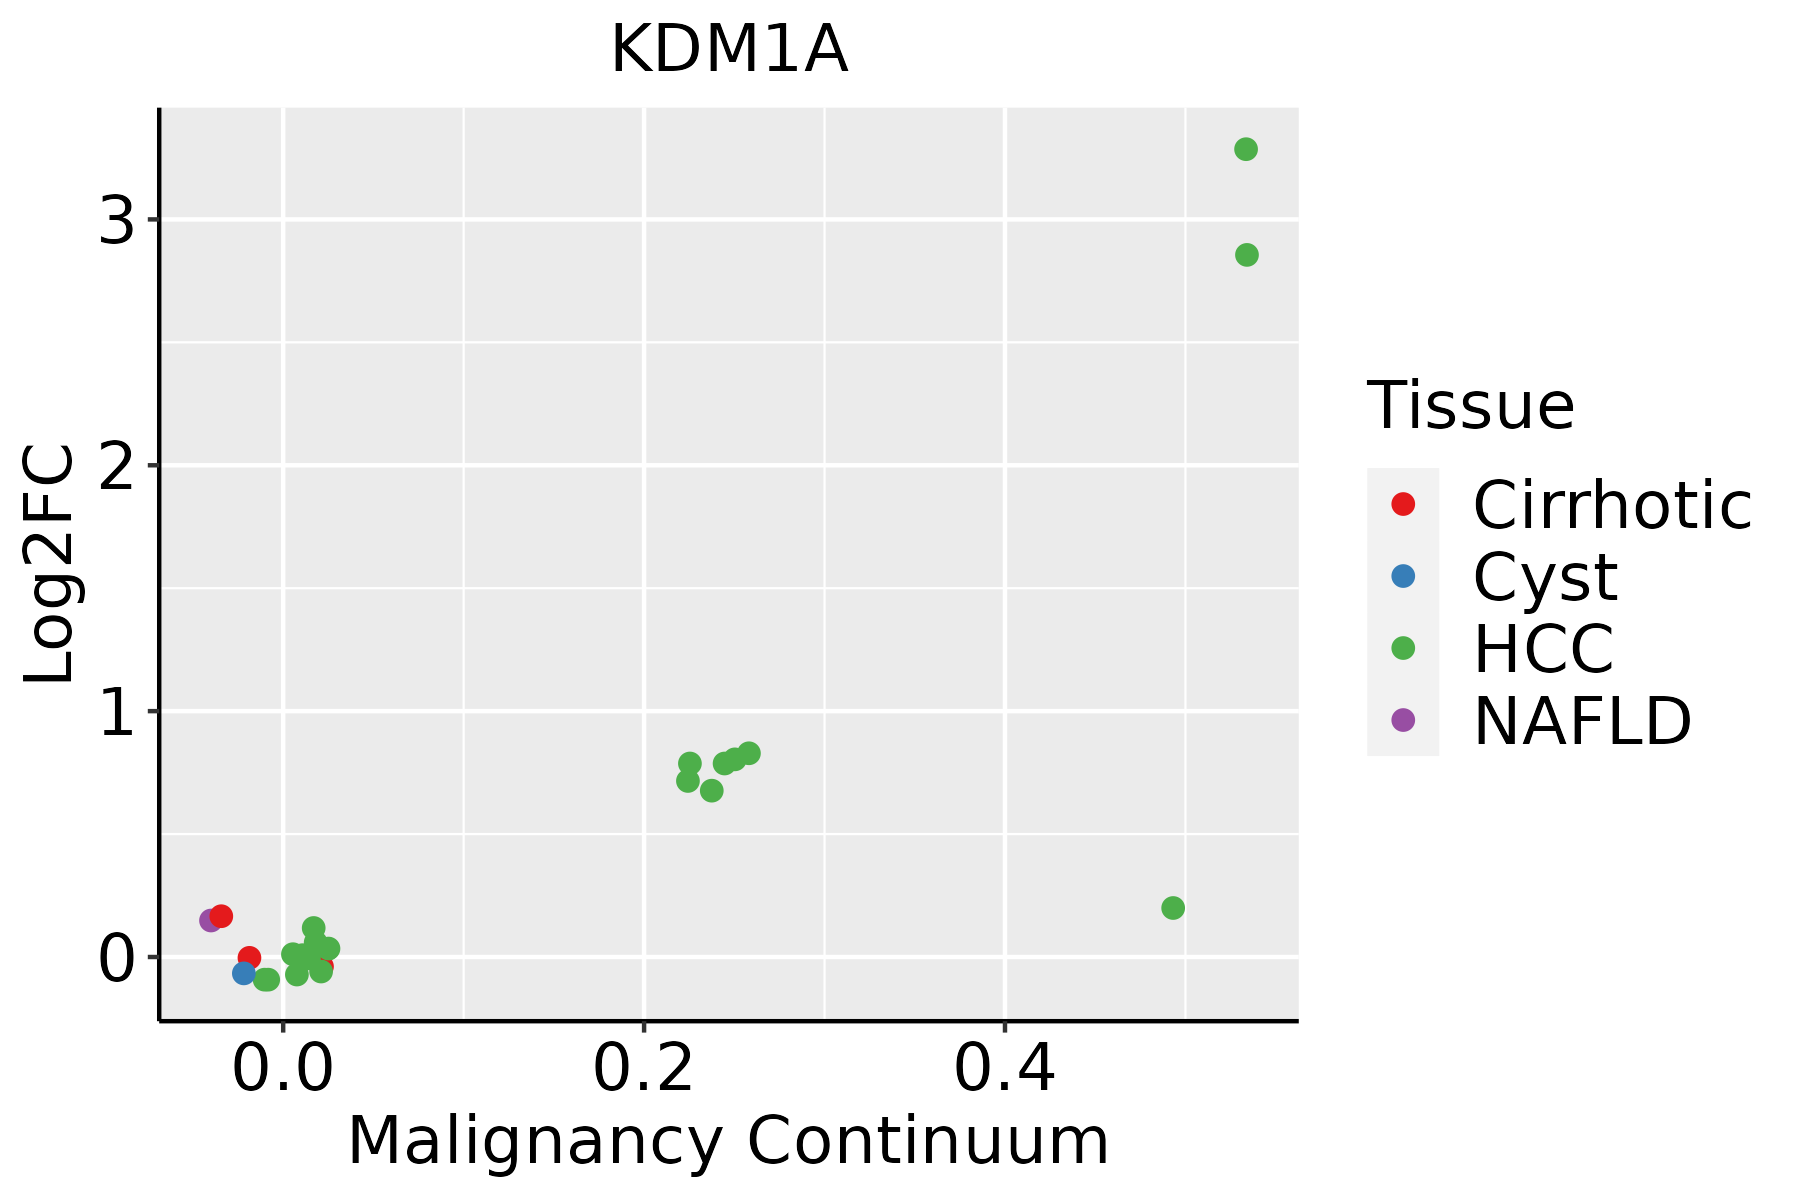
HCC: Hepatocellular carcinoma
NAFLD: Non-alcoholic fatty liver disease
LungThe image shows the transcriptomic changes along malignancy continuum.log2FC in expression of this searched gene in stem-like cells from each diseased tissue sample relative to stem-like cells in normal samples in each tissue plotted against the malignancy continuum. Samples are colored based on if they are from different disease stage.
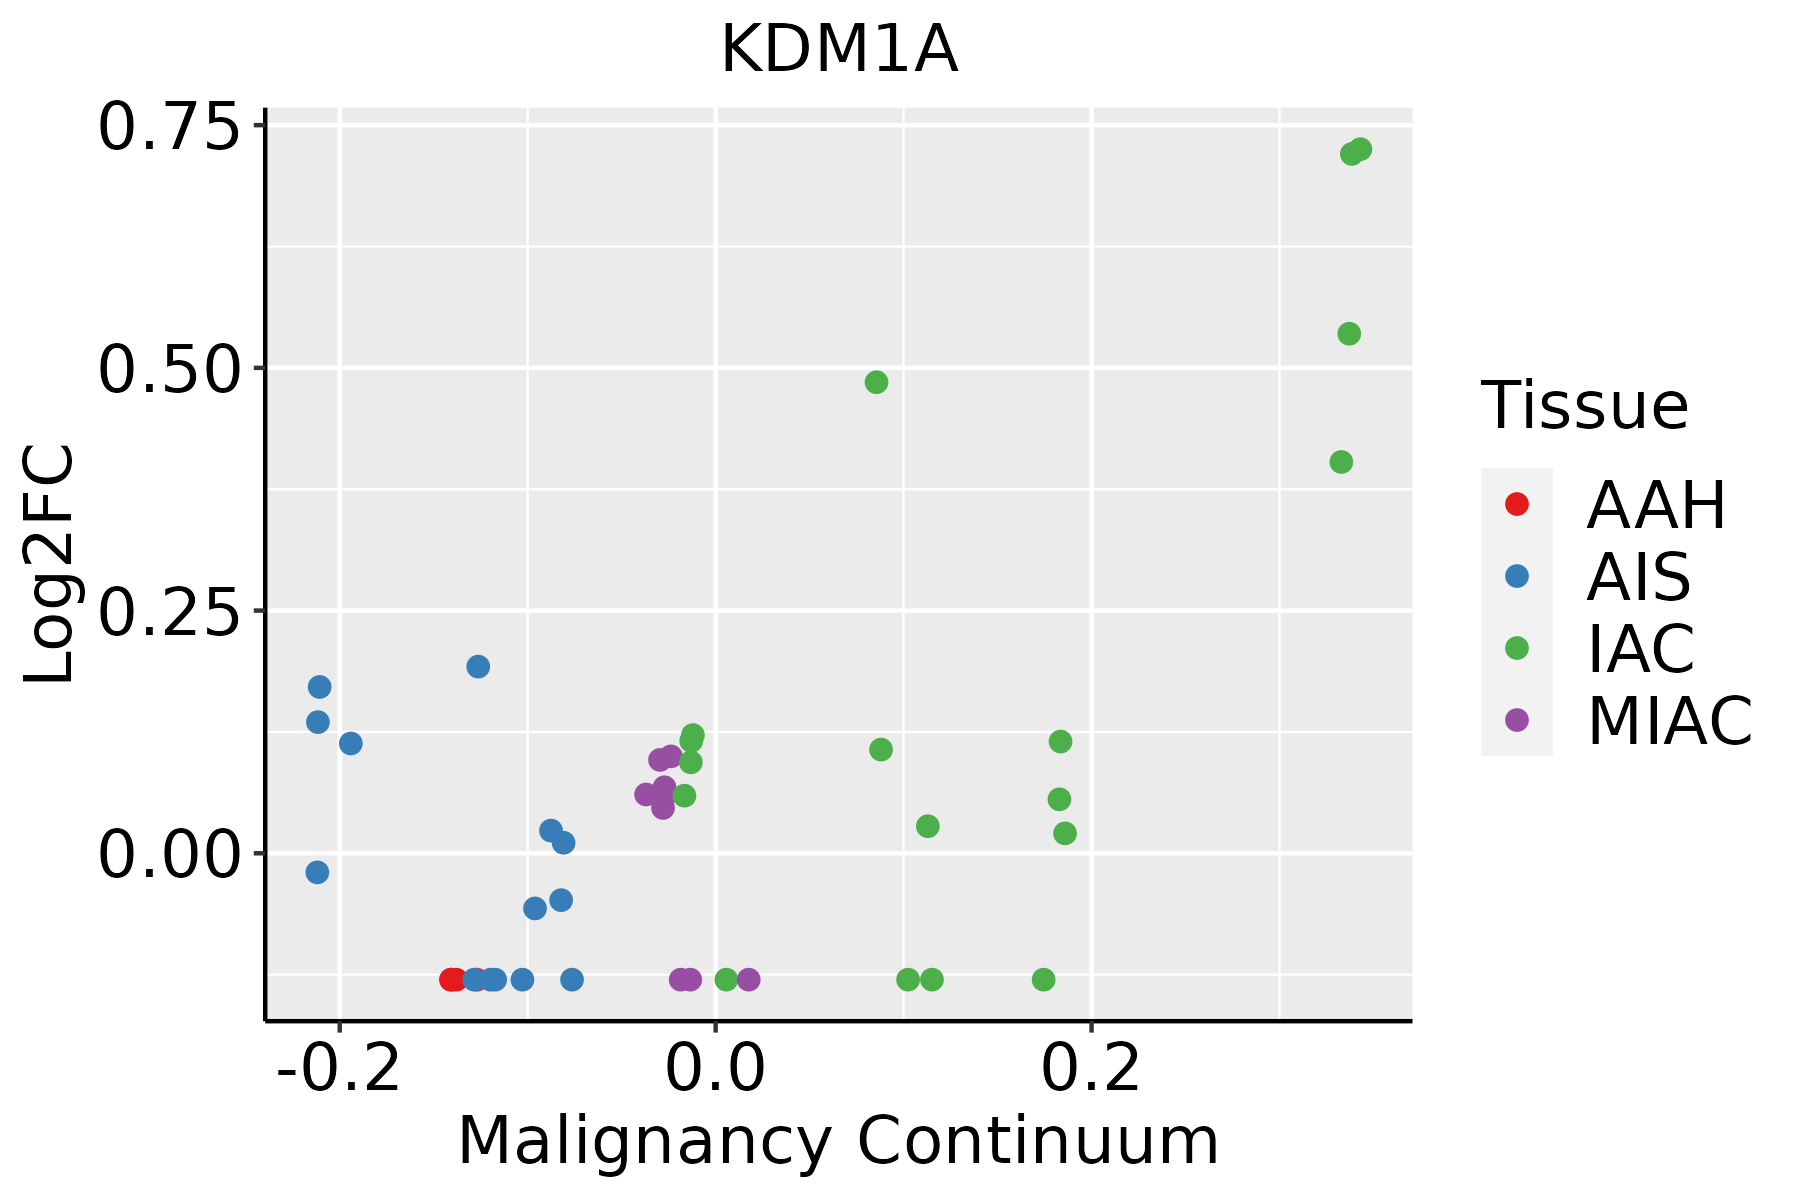
AAH: Atypical adenomatous hyperplasia
AIS: Adenocarcinoma in situ
IAC: Invasive lung adenocarcinoma
MIA: Minimally invasive adenocarcinoma
Oral CavityThe image shows the transcriptomic changes along malignancy continuum.log2FC in expression of this searched gene in stem-like cells from each diseased tissue sample relative to stem-like cells in normal samples in each tissue plotted against the malignancy continuum. Samples are colored based on if they are from different disease stage.EOLP: Erosive Oral lichen planus
LP: leukoplakia
NEOLP: Non-erosive oral lichen planus
OSCC: Oral squamous cell carcinoma
ProstateThe image shows the transcriptomic changes along malignancy continuum.log2FC in expression of this searched gene in stem-like cells from each diseased tissue sample relative to stem-like cells in normal samples in each tissue plotted against the malignancy continuum. Samples are colored based on if they are from different disease stage.
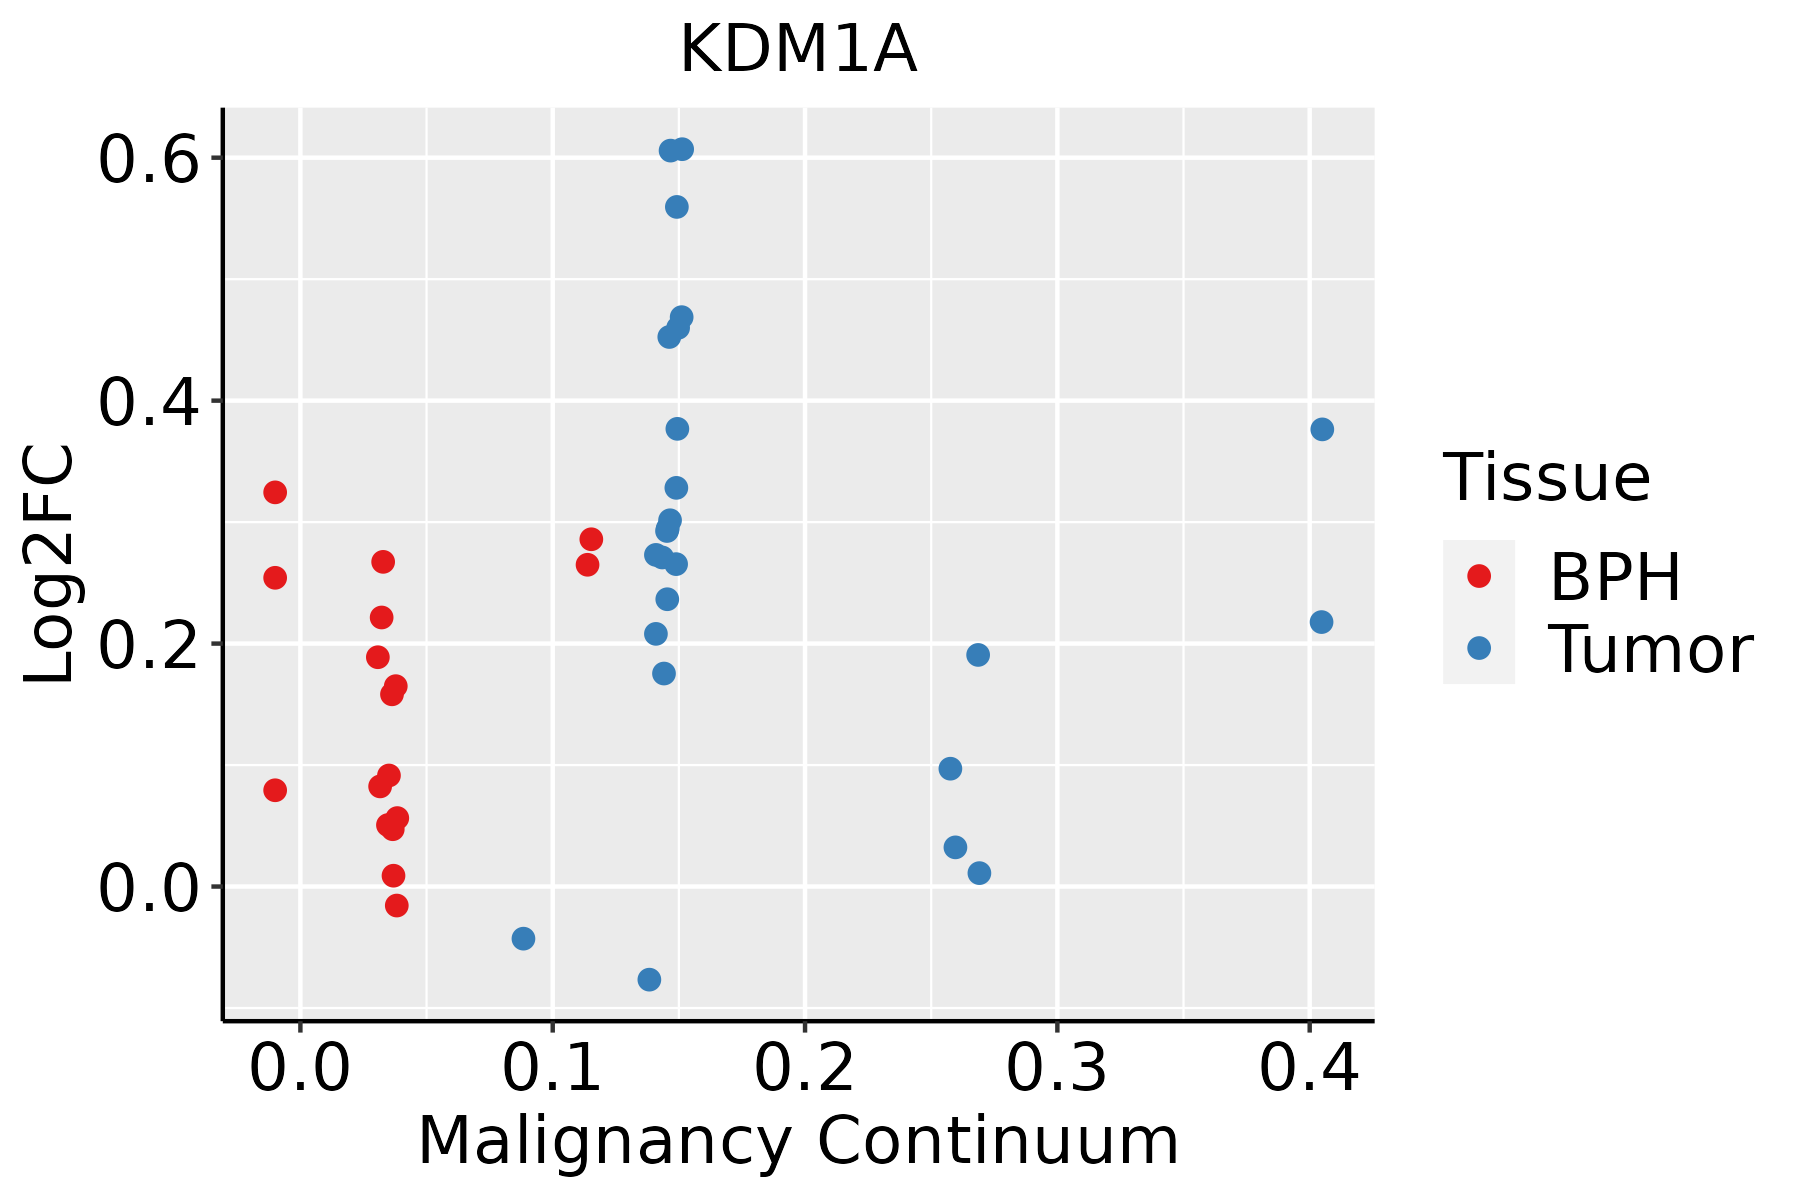
BPH: Benign Prostatic Hyperplasia
SkinThe image shows the transcriptomic changes along malignancy continuum.log2FC in expression of this searched gene in stem-like cells from each diseased tissue sample relative to stem-like cells in normal samples in each tissue plotted against the malignancy continuum. Samples are colored based on if they are from different disease stage.
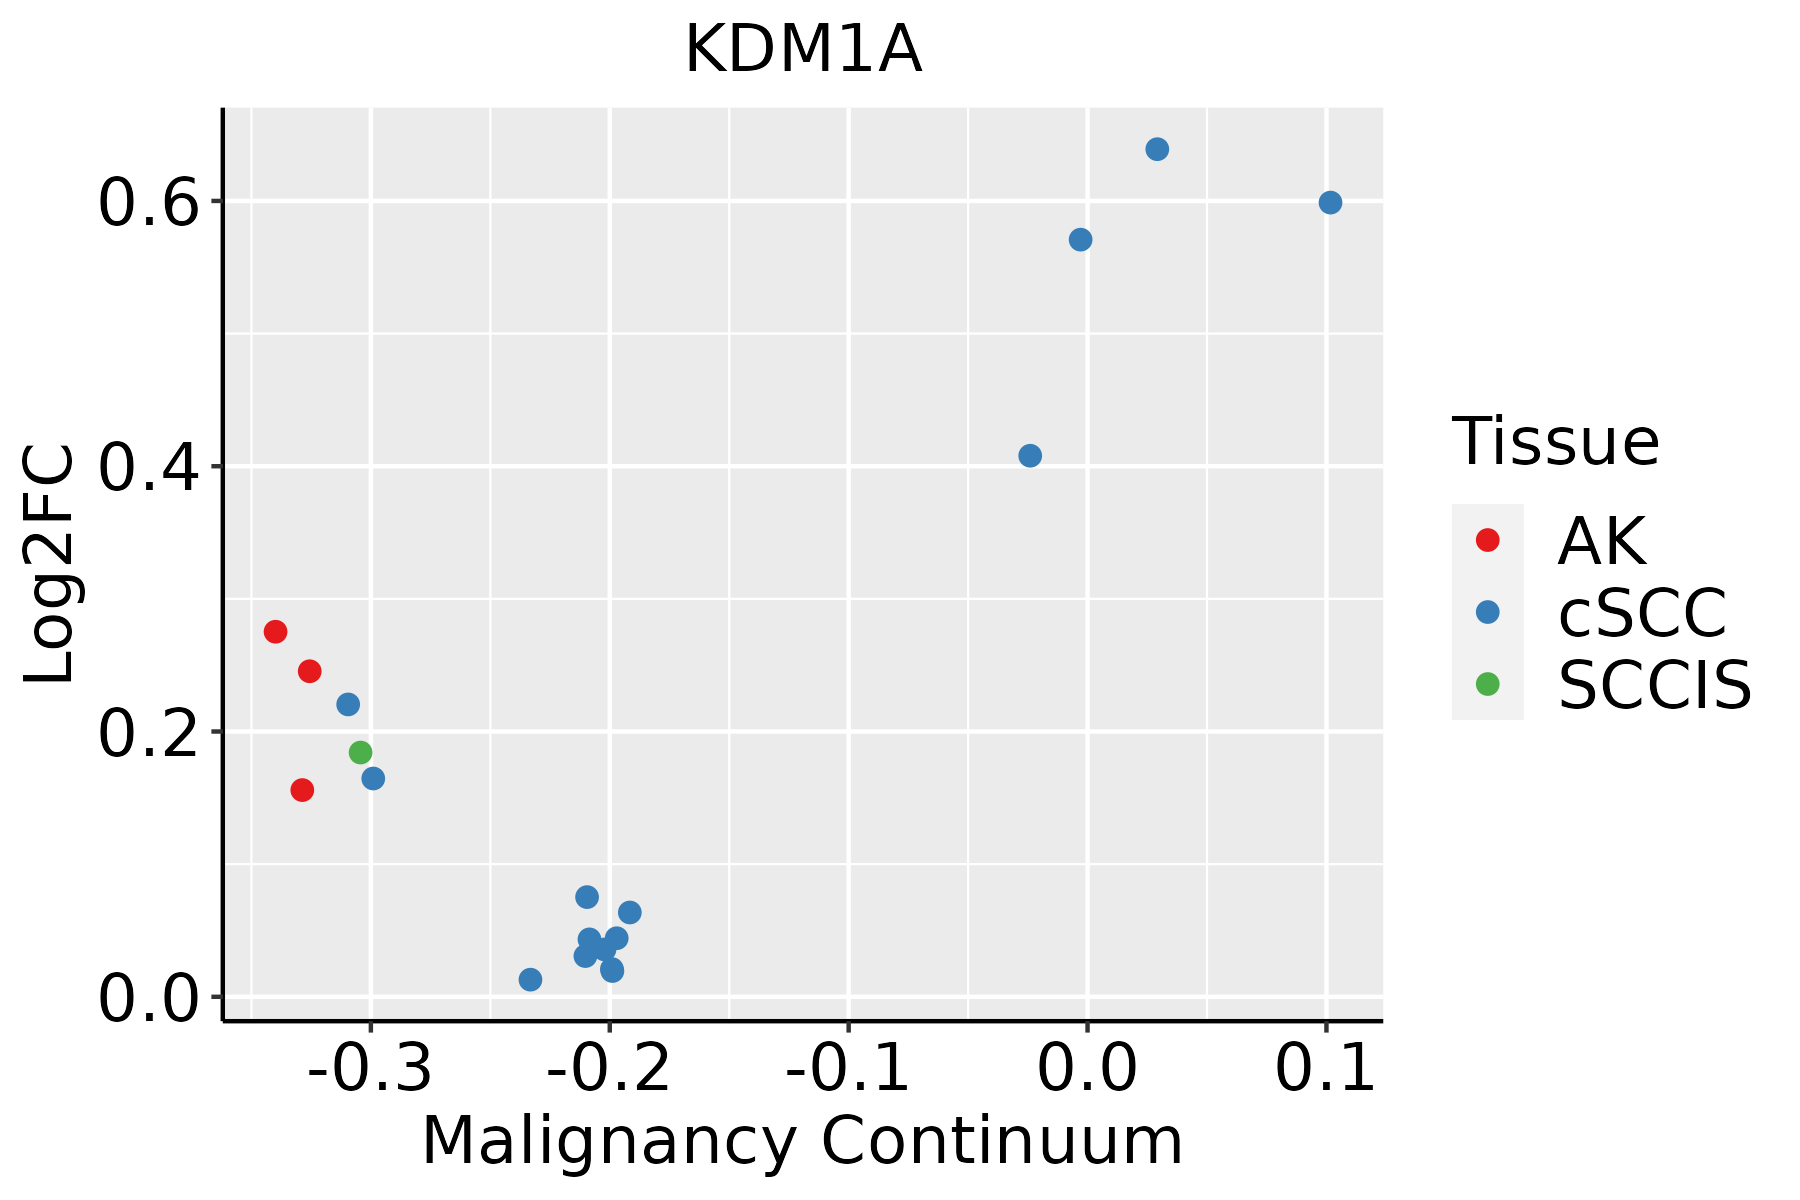
AK: Actinic keratosis
cSCC: Cutaneous squamous cell carcinoma
SCCIS:squamous cell carcinoma in situ
ThyroidThe image shows the transcriptomic changes along malignancy continuum.log2FC in expression of this searched gene in stem-like cells from each diseased tissue sample relative to stem-like cells in normal samples in each tissue plotted against the malignancy continuum. Samples are colored based on if they are from different disease stage.
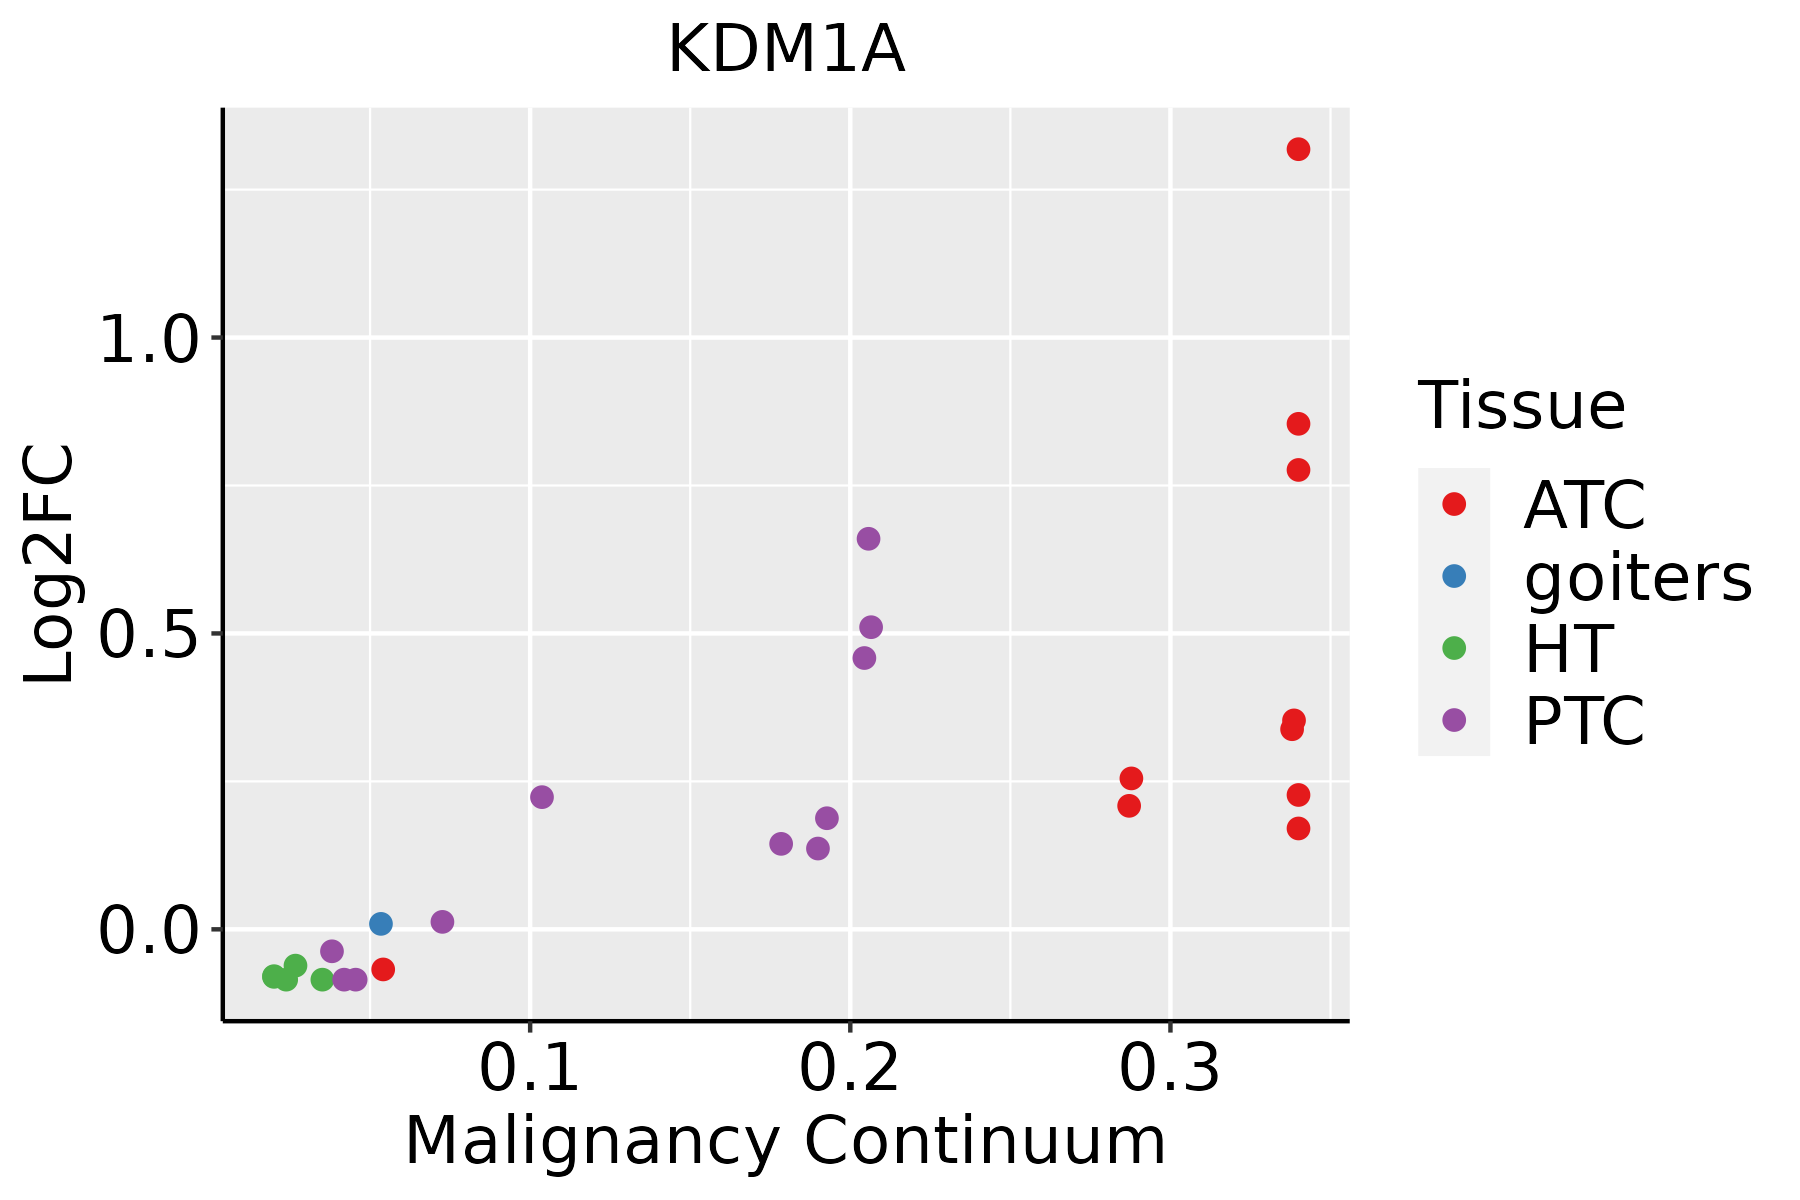
ATC: Anaplastic thyroid cancer
HT: Hashimoto's thyroiditis
PTC: Papillary thyroid cancer
∗log2FC in expression of this searched gene in stem-like cells from each diseased tissue sample relative to stem-like cells in normal samples in each tissue plotted against the malignancy continuum. Samples are colored based on if they are from different disease stage.

Top

Malignant transformation related pathway analysis

check buttonFind out the enriched GO biological processes and KEGG pathways involved in transition from healthy to precancer to cancer
check button Figure of enriched GO biological processes.
TissueDisease StageEnriched GO biological Processes
ColorectumADGO analysis - Figure of enriched GO biological processes: Top 15 enriched GO BP terms are showed in the bar plot of each disease state in each tissue. Each row represents a significant GO biological process which is colored according to the -log10(p.adjust).
ColorectumSERGO analysis - Figure of enriched GO biological processes: Top 15 enriched GO BP terms are showed in the bar plot of each disease state in each tissue. Each row represents a significant GO biological process which is colored according to the -log10(p.adjust).
ColorectumMSSGO analysis - Figure of enriched GO biological processes: Top 15 enriched GO BP terms are showed in the bar plot of each disease state in each tissue. Each row represents a significant GO biological process which is colored according to the -log10(p.adjust).
ColorectumMSI-HGO analysis - Figure of enriched GO biological processes: Top 15 enriched GO BP terms are showed in the bar plot of each disease state in each tissue. Each row represents a significant GO biological process which is colored according to the -log10(p.adjust).
ColorectumFAPGO analysis - Figure of enriched GO biological processes: Top 15 enriched GO BP terms are showed in the bar plot of each disease state in each tissue. Each row represents a significant GO biological process which is colored according to the -log10(p.adjust).
∗Top 15 enriched GO BP terms are showed in the bar plot of each disease state in each tissue. Each row represents a significant GO biological process which is colored according to the -log10(p.adjust).
Page: 1 2 3 4 5 6 7 8 9 

check button Enriched GO biological processes.
GO IDTissueDisease StageDescriptionGene RatioBg Ratiopvaluep.adjustCount
GO:007233128SkinAKsignal transduction by p53 class mediator41/1910163/187233.41e-081.80e-0641
GO:005109926SkinAKpositive regulation of binding42/1910173/187236.92e-083.38e-0642
GO:00165709SkinAKhistone modification84/1910463/187231.10e-074.95e-0684
GO:007138326SkinAKcellular response to steroid hormone stimulus46/1910204/187231.79e-077.37e-0646
GO:003052226SkinAKintracellular receptor signaling pathway55/1910265/187232.26e-079.03e-0655
GO:001072015SkinAKpositive regulation of cell development59/1910298/187234.52e-071.67e-0559
GO:001097517SkinAKregulation of neuron projection development79/1910445/187236.49e-072.23e-0579
GO:007233227SkinAKintrinsic apoptotic signaling pathway by p53 class mediator23/191076/187231.12e-063.54e-0523
GO:000863024SkinAKintrinsic apoptotic signaling pathway in response to DNA damage27/191099/187231.34e-064.15e-0527
GO:007147810SkinAKcellular response to radiation41/1910186/187231.53e-064.61e-0541
GO:00507698SkinAKpositive regulation of neurogenesis46/1910225/187233.30e-068.56e-0546
GO:000931420SkinAKresponse to radiation78/1910456/187233.32e-068.59e-0578
GO:005159120SkinAKresponse to cAMP25/191093/187234.33e-061.05e-0425
GO:190179628SkinAKregulation of signal transduction by p53 class mediator25/191093/187234.33e-061.05e-0425
GO:005076713SkinAKregulation of neurogenesis65/1910364/187235.10e-061.19e-0465
GO:19022299SkinAKregulation of intrinsic apoptotic signaling pathway in response to DNA damage14/191036/187235.46e-061.26e-0414
GO:00182058SkinAKpeptidyl-lysine modification66/1910376/187237.80e-061.72e-0466
GO:00309006SkinAKforebrain development66/1910379/187231.02e-052.17e-0466
GO:00064799SkinAKprotein methylation38/1910181/187231.21e-052.46e-0438
GO:00082139SkinAKprotein alkylation38/1910181/187231.21e-052.46e-0438
Page: 1 2 3 4 5 6 7 8 9 10 11 12 13 14 15 16 17 18 19 20 21 22 23 24 25 26 27 28 29 30 31 32 33 34 35 36 37 38 39 40 41 42 43 44 45 46 47 48 49 

check button Enriched KEGG pathways.
Pathway IDTissueDisease StageDescriptionGene RatioBg Ratiopvaluep.adjustqvalueCount
hsa04714211EsophagusESCCThermogenesis163/4205232/84659.22e-111.14e-095.86e-10163
hsa04714310EsophagusESCCThermogenesis163/4205232/84659.22e-111.14e-095.86e-10163
hsa0471422LiverHCCThermogenesis170/4020232/84655.36e-162.25e-141.25e-14170
hsa0471432LiverHCCThermogenesis170/4020232/84655.36e-162.25e-141.25e-14170
hsa0471416LungIACThermogenesis46/1053232/84657.85e-046.38e-034.23e-0346
hsa0471417LungIACThermogenesis46/1053232/84657.85e-046.38e-034.23e-0346
hsa0471430Oral cavityOSCCThermogenesis138/3704232/84657.67e-074.35e-062.22e-06138
hsa04714113Oral cavityOSCCThermogenesis138/3704232/84657.67e-074.35e-062.22e-06138
hsa0471428ProstateBPHThermogenesis110/1718232/84655.16e-211.42e-198.78e-20110
hsa04714112ProstateBPHThermogenesis110/1718232/84655.16e-211.42e-198.78e-20110
hsa0471429ProstateTumorThermogenesis110/1791232/84651.56e-193.96e-182.46e-18110
hsa0471437ProstateTumorThermogenesis110/1791232/84651.56e-193.96e-182.46e-18110
Page: 1 

Top

Cell-cell communication analysis

check buttonIdentification of potential cell-cell interactions between two cell types and their ligand-receptor pairs for different disease states
LigandReceptorLRpairPathwayTissueDisease Stage
Page: 1 

Top

Single-cell gene regulatory network inference analysis

check buttonFind out the significant the regulons (TFs) and the target genes of each regulon across cell types for different disease states
TFCell TypeTissueDisease StageTarget GeneRSSRegulon Activity
∗The dot plots of a searched regulon are shown for all cell subpopulations in each disease state of each tissue based on the regulon specific score inferred using pySCENIC and by calculating the average expression.
Page: 1 

Top

Somatic mutation of malignant transformation related genes

check buttonAnnotation of somatic variants for genes involved in malignant transformation
Hugo SymbolVariant ClassVariant ClassificationdbSNP RSHGVScHGVSpHGVSp ShortSWISSPROTBIOTYPESIFTPolyPhenTumor Sample BarcodeTissueHistologySexAgeStageTherapy TypesDrugsOutcome
KDM1ASNVMissense_Mutationc.1189G>Cp.Glu397Glnp.E397QO60341protein_codingtolerated(0.07)possibly_damaging(0.552)TCGA-AC-A23H-01Breastbreast invasive carcinomaFemale>=65I/IIUnknownUnknownPD
KDM1ASNVMissense_Mutationc.812G>Ap.Arg271Glnp.R271QO60341protein_codingdeleterious(0.04)probably_damaging(0.941)TCGA-AN-A046-01Breastbreast invasive carcinomaFemale>=65I/IIUnknownUnknownSD
KDM1ASNVMissense_Mutationc.2426N>Gp.Ser809Trpp.S809WO60341protein_codingdeleterious(0)possibly_damaging(0.803)TCGA-GM-A2D9-01Breastbreast invasive carcinomaFemale>=65I/IIHormone TherapyarimidexSD
KDM1ASNVMissense_Mutationc.1189N>Ap.Glu397Lysp.E397KO60341protein_codingdeleterious(0.01)benign(0.413)TCGA-W8-A86G-01Breastbreast invasive carcinomaFemale>=65I/IIHormone TherapyarimidexSD
KDM1AinsertionNonsense_Mutationnovelc.677_678insATAGAGATGGAGAAGAATATTATTCCAAGCATACATTAATGTp.Thr226_Gln227insTerp.T226_Q227ins*O60341protein_codingTCGA-A2-A0CQ-01Breastbreast invasive carcinomaFemale<65I/IIChemotherapyadriamycinSD
KDM1AinsertionNonsense_Mutationnovelc.1919_1920insGATGACAGTTGAGGATTCTGAAGTTGACp.Tyr640Terp.Y640*O60341protein_codingTCGA-A8-A0A4-01Breastbreast invasive carcinomaFemale>=65I/IIHormone TherapytamoxiphenCR
KDM1AinsertionFrame_Shift_Insnovelc.1816_1817insGAGCGTGGTGGCTCATGCCTGTAATACCAGCACTTp.Leu606ArgfsTer13p.L606Rfs*13O60341protein_codingTCGA-B6-A0IK-01Breastbreast invasive carcinomaFemale<65III/IVUnknownUnknownPD
KDM1ASNVMissense_Mutationc.817C>Ap.His273Asnp.H273NO60341protein_codingdeleterious(0)probably_damaging(0.996)TCGA-EA-A1QS-01Cervixcervical & endocervical cancerFemale<65I/IIUnknownUnknownSD
KDM1ASNVMissense_Mutationnovelc.358T>Cp.Tyr120Hisp.Y120HO60341protein_codingdeleterious_low_confidence(0.03)probably_damaging(0.991)TCGA-EA-A3HU-01Cervixcervical & endocervical cancerFemale<65I/IIUnknownUnknownSD
KDM1ASNVMissense_Mutationnovelc.1844G>Tp.Arg615Leup.R615LO60341protein_codingdeleterious(0.02)possibly_damaging(0.69)TCGA-EK-A2IP-01Cervixcervical & endocervical cancerFemale<65I/IIUnknownUnknownSD
Page: 1 2 3 4 5 6 7 

Top

Related drugs of malignant transformation related genes

check buttonIdentification of chemicals and drugs interact with genes involved in malignant transfromation
(DGIdb 4.0)
Entrez IDSymbolCategoryInteraction TypesDrug Claim NameDrug NamePMIDs
23028KDM1ADRUGGABLE GENOME, ENZYME, CELL SURFACE, TRANSCRIPTION FACTOR COMPLEX, TRANSCRIPTION FACTOR BINDINGinhibitor178103603
23028KDM1ADRUGGABLE GENOME, ENZYME, CELL SURFACE, TRANSCRIPTION FACTOR COMPLEX, TRANSCRIPTION FACTOR BINDINGinhibitor310264760
23028KDM1ADRUGGABLE GENOME, ENZYME, CELL SURFACE, TRANSCRIPTION FACTOR COMPLEX, TRANSCRIPTION FACTOR BINDINGTRANYLCYPROMINE HYDROCHLORIDETRANYLCYPROMINE HYDROCHLORIDE
23028KDM1ADRUGGABLE GENOME, ENZYME, CELL SURFACE, TRANSCRIPTION FACTOR COMPLEX, TRANSCRIPTION FACTOR BINDING2-[N-(PHTHALIMIDO)]ETHYL CARBAMIMIDOTHIOATE HCLCHEMBL218200922876979
23028KDM1ADRUGGABLE GENOME, ENZYME, CELL SURFACE, TRANSCRIPTION FACTOR COMPLEX, TRANSCRIPTION FACTOR BINDINGinhibitor249565921
23028KDM1ADRUGGABLE GENOME, ENZYME, CELL SURFACE, TRANSCRIPTION FACTOR COMPLEX, TRANSCRIPTION FACTOR BINDINGactivator252166601
23028KDM1ADRUGGABLE GENOME, ENZYME, CELL SURFACE, TRANSCRIPTION FACTOR COMPLEX, TRANSCRIPTION FACTOR BINDINGinhibitor178103602
23028KDM1ADRUGGABLE GENOME, ENZYME, CELL SURFACE, TRANSCRIPTION FACTOR COMPLEX, TRANSCRIPTION FACTOR BINDINGinhibitor178101964TRANYLCYPROMINE
23028KDM1ADRUGGABLE GENOME, ENZYME, CELL SURFACE, TRANSCRIPTION FACTOR COMPLEX, TRANSCRIPTION FACTOR BINDINGPARNATEPARNATE21382717
23028KDM1ADRUGGABLE GENOME, ENZYME, CELL SURFACE, TRANSCRIPTION FACTOR COMPLEX, TRANSCRIPTION FACTOR BINDINGNAMOLINENAMOLINE24007511
Page: 1 2