| Tissue | Expression Dynamics | Abbreviation |
| Breast |  | IDC: Invasive ductal carcinoma |
| DCIS: Ductal carcinoma in situ |
| Precancer(BRCA1-mut): Precancerous lesion from BRCA1 mutation carriers |
| Colorectum (GSE201348) |  | FAP: Familial adenomatous polyposis |
| CRC: Colorectal cancer |
| Colorectum (HTA11) |  | AD: Adenomas |
| SER: Sessile serrated lesions |
| MSI-H: Microsatellite-high colorectal cancer |
| MSS: Microsatellite stable colorectal cancer |
| Endometrium | 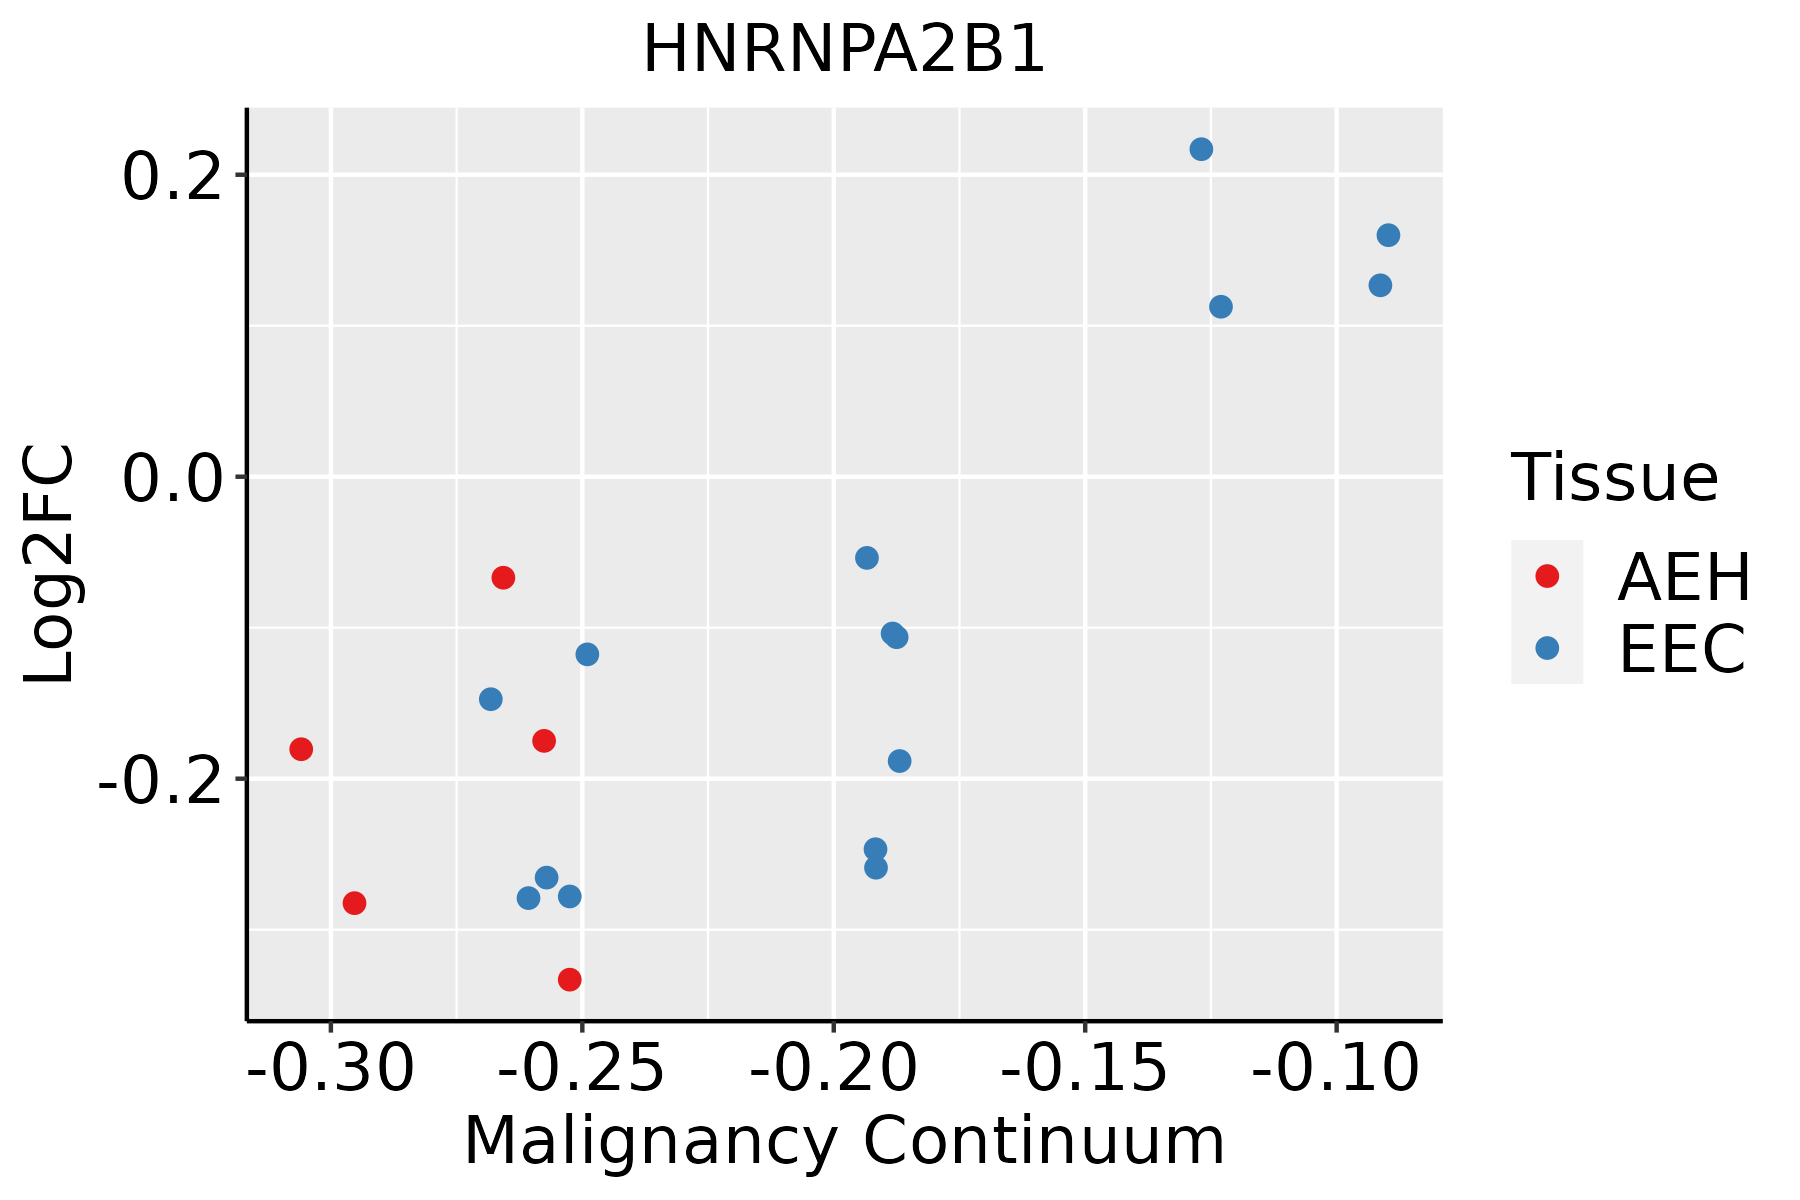 | AEH: Atypical endometrial hyperplasia |
| EEC: Endometrioid Cancer |
| Esophagus |  | ESCC: Esophageal squamous cell carcinoma |
| HGIN: High-grade intraepithelial neoplasias |
| LGIN: Low-grade intraepithelial neoplasias |
| GC | 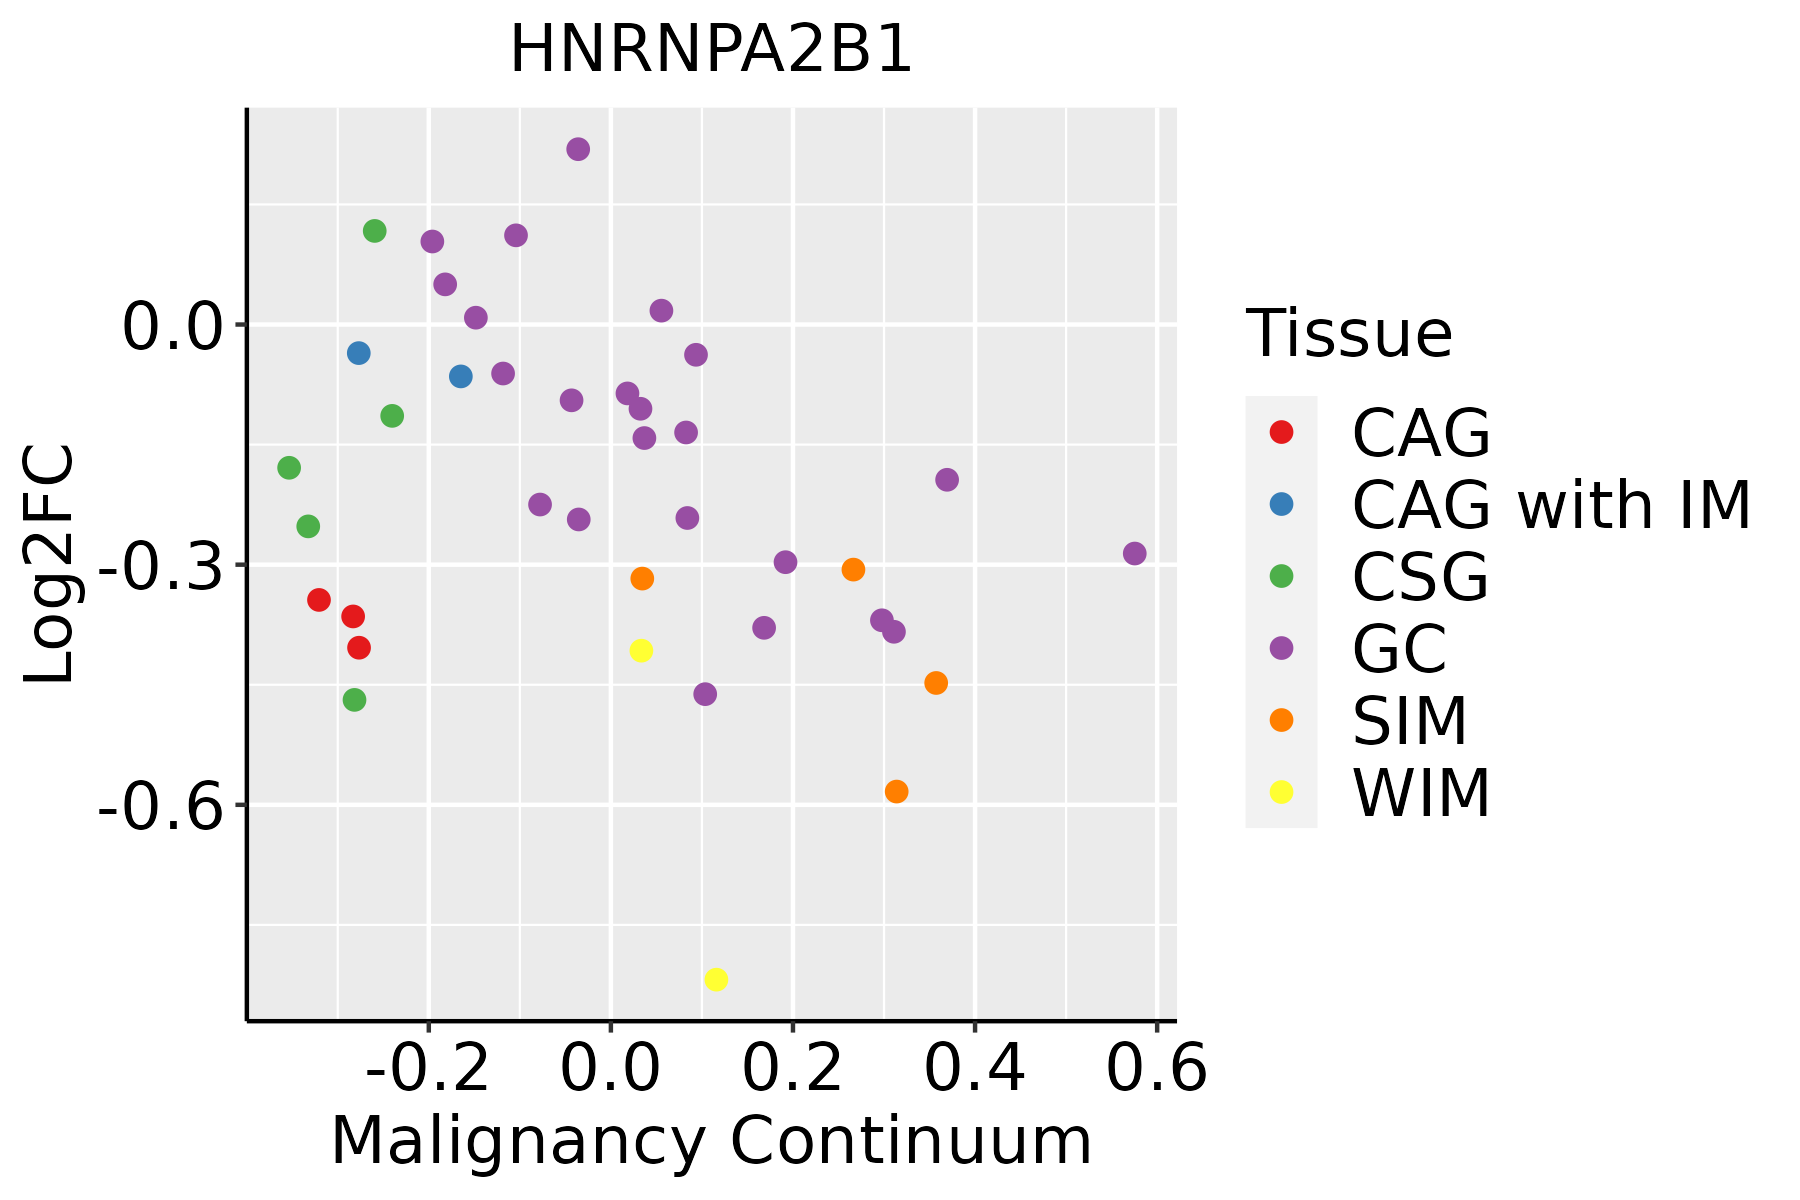 | CAG: Chronic atrophic gastritis |
| CAG with IM: Chronic atrophic gastritis with intestinal metaplasia |
| CSG: Chronic superficial gastritis |
| GC: Gastric cancer |
| SIM: Severe intestinal metaplasia |
| WIM: Wild intestinal metaplasia |
| Liver |  | HCC: Hepatocellular carcinoma |
| NAFLD: Non-alcoholic fatty liver disease |
| Oral Cavity | 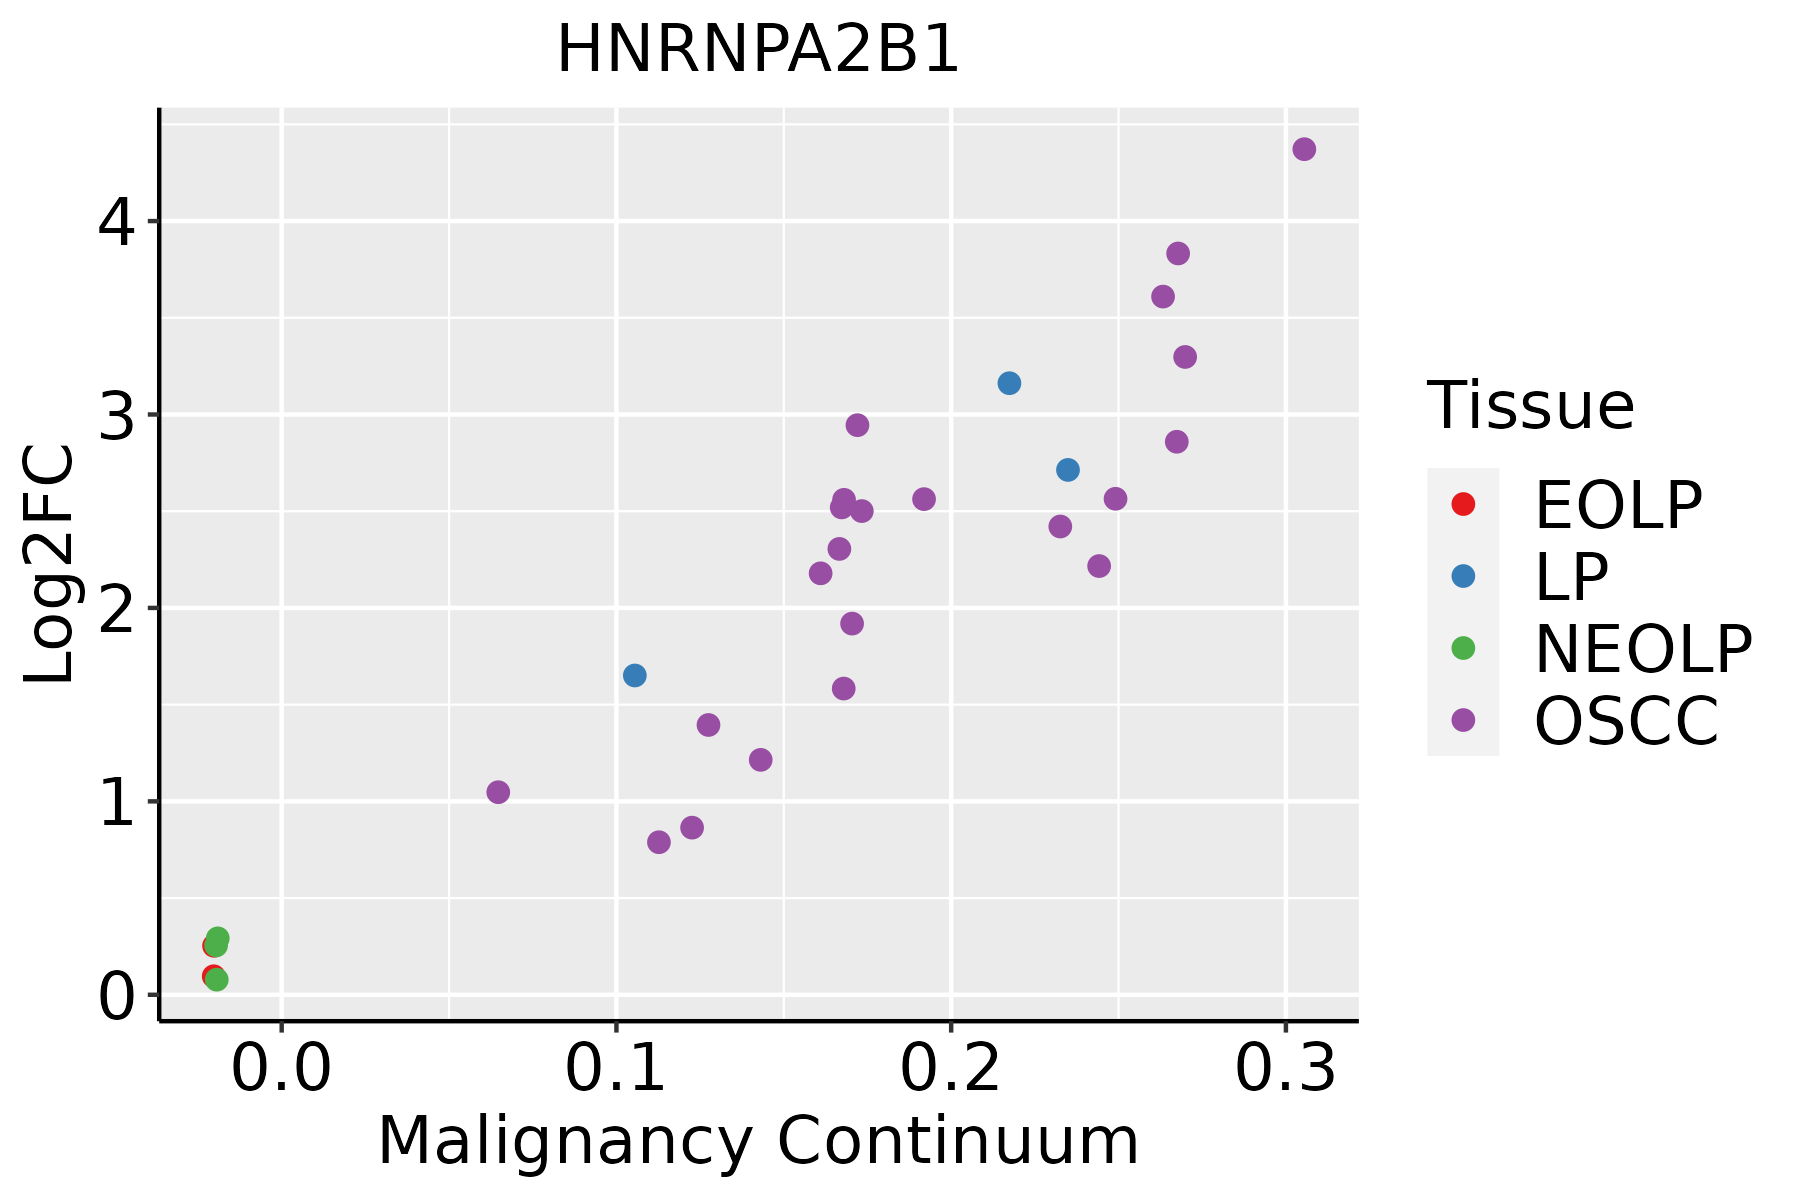 | EOLP: Erosive Oral lichen planus |
| LP: leukoplakia |
| NEOLP: Non-erosive oral lichen planus |
| OSCC: Oral squamous cell carcinoma |
| Prostate |  | BPH: Benign Prostatic Hyperplasia |
| Skin | 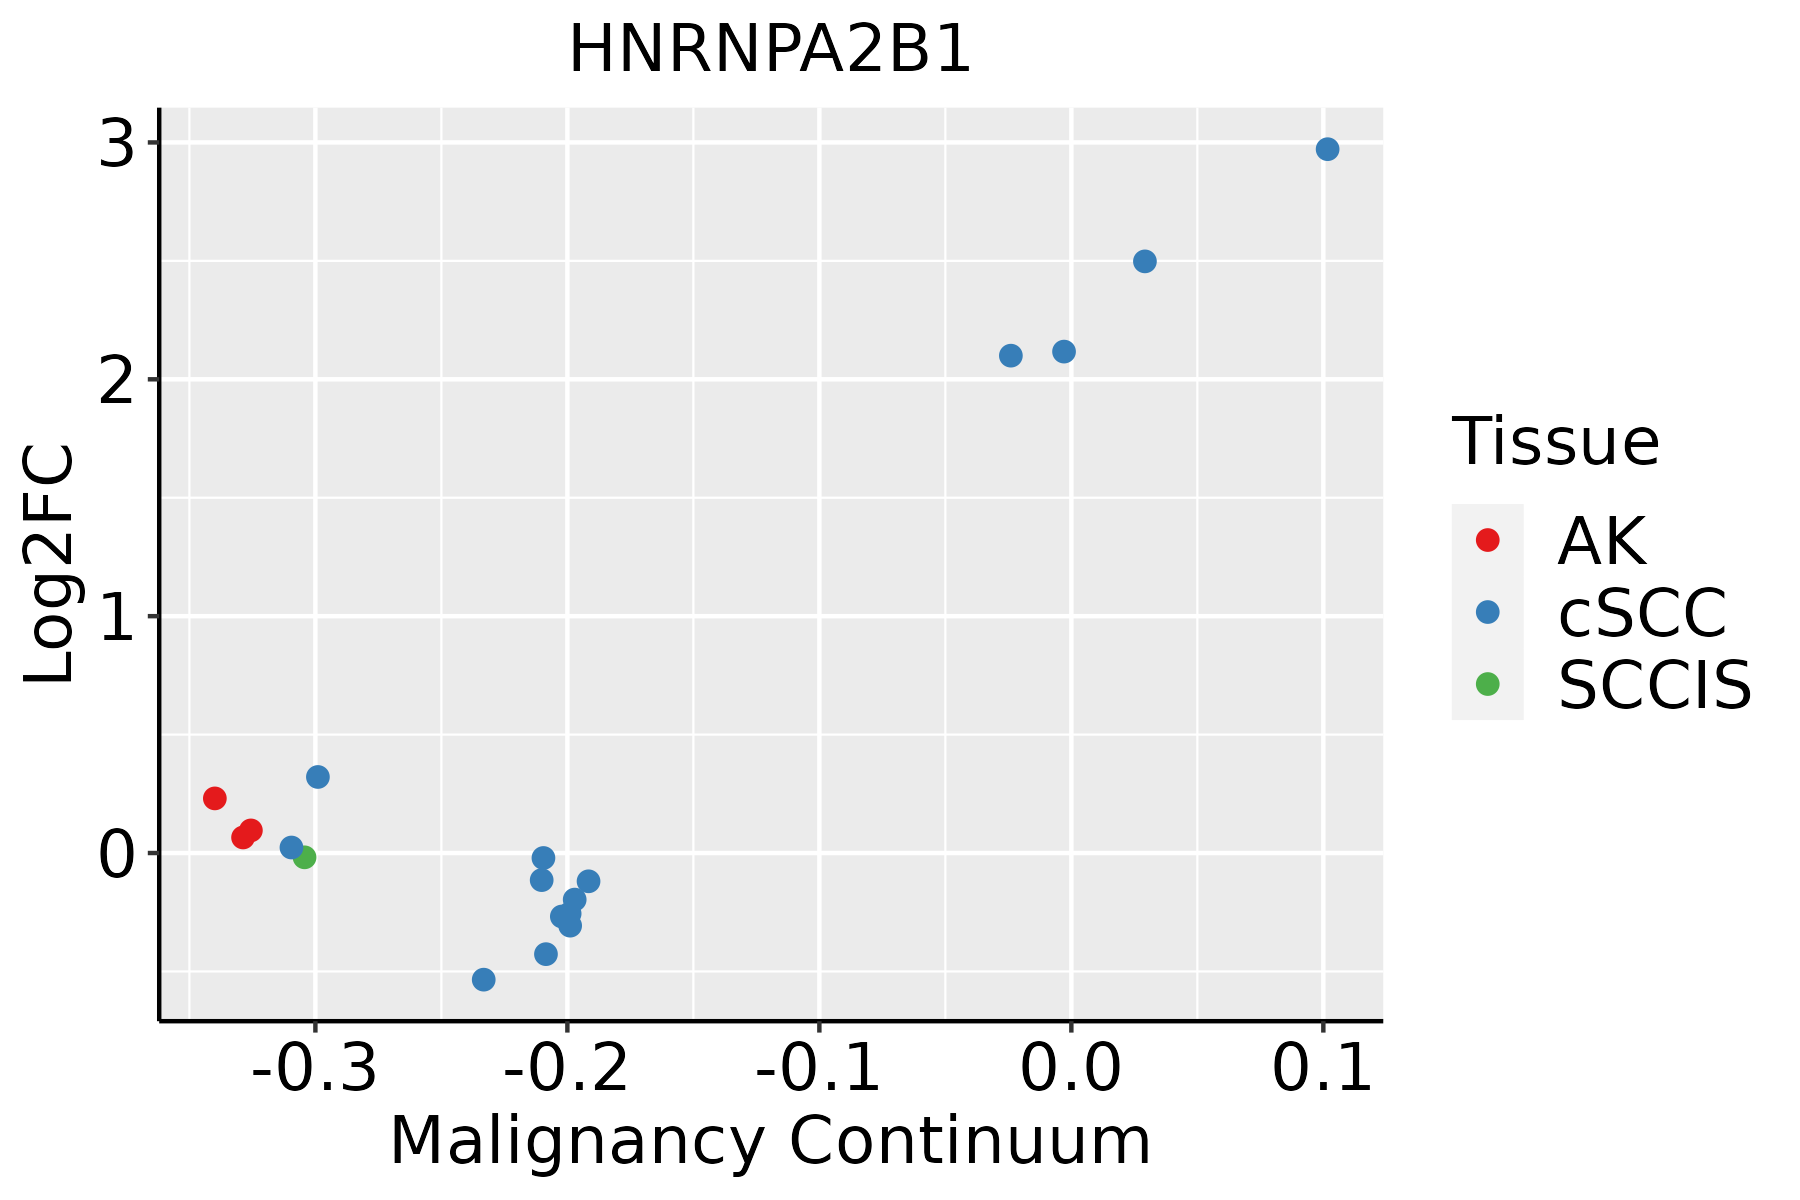 | AK: Actinic keratosis |
| cSCC: Cutaneous squamous cell carcinoma |
| SCCIS:squamous cell carcinoma in situ |
| Thyroid |  | ATC: Anaplastic thyroid cancer |
| HT: Hashimoto's thyroiditis |
| PTC: Papillary thyroid cancer |
| GO ID | Tissue | Disease Stage | Description | Gene Ratio | Bg Ratio | pvalue | p.adjust | Count |
| GO:005123610 | Prostate | BPH | establishment of RNA localization | 49/3107 | 166/18723 | 2.26e-05 | 2.71e-04 | 49 |
| GO:005116815 | Prostate | BPH | nuclear export | 46/3107 | 154/18723 | 2.86e-05 | 3.32e-04 | 46 |
| GO:005065710 | Prostate | BPH | nucleic acid transport | 48/3107 | 163/18723 | 2.92e-05 | 3.34e-04 | 48 |
| GO:005065810 | Prostate | BPH | RNA transport | 48/3107 | 163/18723 | 2.92e-05 | 3.34e-04 | 48 |
| GO:00510529 | Prostate | BPH | regulation of DNA metabolic process | 89/3107 | 359/18723 | 4.07e-05 | 4.36e-04 | 89 |
| GO:19043569 | Prostate | BPH | regulation of telomere maintenance via telomere lengthening | 23/3107 | 61/18723 | 6.09e-05 | 6.13e-04 | 23 |
| GO:00315033 | Prostate | BPH | protein-containing complex localization | 59/3107 | 220/18723 | 8.01e-05 | 7.66e-04 | 59 |
| GO:00718978 | Prostate | BPH | DNA biosynthetic process | 50/3107 | 180/18723 | 1.06e-04 | 9.73e-04 | 50 |
| GO:005197210 | Prostate | BPH | regulation of telomerase activity | 18/3107 | 47/18723 | 3.00e-04 | 2.32e-03 | 18 |
| GO:001593110 | Prostate | BPH | nucleobase-containing compound transport | 55/3107 | 222/18723 | 1.12e-03 | 6.97e-03 | 55 |
| GO:00510286 | Prostate | BPH | mRNA transport | 35/3107 | 130/18723 | 1.93e-03 | 1.10e-02 | 35 |
| GO:00323924 | Prostate | BPH | DNA geometric change | 26/3107 | 90/18723 | 2.46e-03 | 1.33e-02 | 26 |
| GO:00351967 | Prostate | BPH | production of miRNAs involved in gene silencing by miRNA | 17/3107 | 52/18723 | 3.30e-03 | 1.71e-02 | 17 |
| GO:00310506 | Prostate | BPH | dsRNA processing | 17/3107 | 54/18723 | 5.09e-03 | 2.40e-02 | 17 |
| GO:00709186 | Prostate | BPH | production of small RNA involved in gene silencing by RNA | 17/3107 | 54/18723 | 5.09e-03 | 2.40e-02 | 17 |
| GO:00344708 | Prostate | BPH | ncRNA processing | 84/3107 | 395/18723 | 8.44e-03 | 3.64e-02 | 84 |
| GO:000838019 | Prostate | Tumor | RNA splicing | 153/3246 | 434/18723 | 9.15e-20 | 5.79e-17 | 153 |
| GO:000037518 | Prostate | Tumor | RNA splicing, via transesterification reactions | 119/3246 | 324/18723 | 3.40e-17 | 1.06e-14 | 119 |
| GO:000037718 | Prostate | Tumor | RNA splicing, via transesterification reactions with bulged adenosine as nucleophile | 117/3246 | 320/18723 | 9.31e-17 | 2.22e-14 | 117 |
| GO:000039818 | Prostate | Tumor | mRNA splicing, via spliceosome | 117/3246 | 320/18723 | 9.31e-17 | 2.22e-14 | 117 |
| Pathway ID | Tissue | Disease Stage | Description | Gene Ratio | Bg Ratio | pvalue | p.adjust | qvalue | Count |
| hsa0501416 | Breast | Precancer | Amyotrophic lateral sclerosis | 98/684 | 364/8465 | 2.13e-28 | 8.41e-27 | 6.44e-27 | 98 |
| hsa0501417 | Breast | Precancer | Amyotrophic lateral sclerosis | 98/684 | 364/8465 | 2.13e-28 | 8.41e-27 | 6.44e-27 | 98 |
| hsa0501423 | Breast | IDC | Amyotrophic lateral sclerosis | 102/867 | 364/8465 | 1.29e-22 | 5.22e-21 | 3.91e-21 | 102 |
| hsa0501433 | Breast | IDC | Amyotrophic lateral sclerosis | 102/867 | 364/8465 | 1.29e-22 | 5.22e-21 | 3.91e-21 | 102 |
| hsa0501443 | Breast | DCIS | Amyotrophic lateral sclerosis | 101/846 | 364/8465 | 7.14e-23 | 2.88e-21 | 2.12e-21 | 101 |
| hsa0501453 | Breast | DCIS | Amyotrophic lateral sclerosis | 101/846 | 364/8465 | 7.14e-23 | 2.88e-21 | 2.12e-21 | 101 |
| hsa05014 | Colorectum | AD | Amyotrophic lateral sclerosis | 164/2092 | 364/8465 | 4.28e-18 | 1.27e-16 | 8.09e-17 | 164 |
| hsa050141 | Colorectum | AD | Amyotrophic lateral sclerosis | 164/2092 | 364/8465 | 4.28e-18 | 1.27e-16 | 8.09e-17 | 164 |
| hsa050142 | Colorectum | SER | Amyotrophic lateral sclerosis | 138/1580 | 364/8465 | 9.89e-19 | 2.99e-17 | 2.17e-17 | 138 |
| hsa050143 | Colorectum | SER | Amyotrophic lateral sclerosis | 138/1580 | 364/8465 | 9.89e-19 | 2.99e-17 | 2.17e-17 | 138 |
| hsa050144 | Colorectum | MSS | Amyotrophic lateral sclerosis | 156/1875 | 364/8465 | 1.43e-19 | 4.62e-18 | 2.83e-18 | 156 |
| hsa050145 | Colorectum | MSS | Amyotrophic lateral sclerosis | 156/1875 | 364/8465 | 1.43e-19 | 4.62e-18 | 2.83e-18 | 156 |
| hsa050146 | Colorectum | MSI-H | Amyotrophic lateral sclerosis | 95/797 | 364/8465 | 2.31e-21 | 1.50e-19 | 1.26e-19 | 95 |
| hsa050147 | Colorectum | MSI-H | Amyotrophic lateral sclerosis | 95/797 | 364/8465 | 2.31e-21 | 1.50e-19 | 1.26e-19 | 95 |
| hsa050148 | Colorectum | FAP | Amyotrophic lateral sclerosis | 91/1404 | 364/8465 | 1.84e-05 | 2.36e-04 | 1.44e-04 | 91 |
| hsa050149 | Colorectum | FAP | Amyotrophic lateral sclerosis | 91/1404 | 364/8465 | 1.84e-05 | 2.36e-04 | 1.44e-04 | 91 |
| hsa0501420 | Endometrium | AEH | Amyotrophic lateral sclerosis | 123/1197 | 364/8465 | 2.17e-22 | 7.82e-21 | 5.72e-21 | 123 |
| hsa05014110 | Endometrium | AEH | Amyotrophic lateral sclerosis | 123/1197 | 364/8465 | 2.17e-22 | 7.82e-21 | 5.72e-21 | 123 |
| hsa0501425 | Endometrium | EEC | Amyotrophic lateral sclerosis | 128/1237 | 364/8465 | 9.83e-24 | 4.04e-22 | 3.01e-22 | 128 |
| hsa0501435 | Endometrium | EEC | Amyotrophic lateral sclerosis | 128/1237 | 364/8465 | 9.83e-24 | 4.04e-22 | 3.01e-22 | 128 |
| Hugo Symbol | Variant Class | Variant Classification | dbSNP RS | HGVSc | HGVSp | HGVSp Short | SWISSPROT | BIOTYPE | SIFT | PolyPhen | Tumor Sample Barcode | Tissue | Histology | Sex | Age | Stage | Therapy Types | Drugs | Outcome |
| HNRNPA2B1 | SNV | Missense_Mutation | | c.951N>C | p.Lys317Asn | p.K317N | P22626 | protein_coding | deleterious(0.03) | benign(0.264) | TCGA-AC-A23H-01 | Breast | breast invasive carcinoma | Female | >=65 | I/II | Unknown | Unknown | PD |
| HNRNPA2B1 | SNV | Missense_Mutation | | c.209N>T | p.Ser70Leu | p.S70L | P22626 | protein_coding | deleterious(0.03) | probably_damaging(0.975) | TCGA-AC-A23H-01 | Breast | breast invasive carcinoma | Female | >=65 | I/II | Unknown | Unknown | PD |
| HNRNPA2B1 | SNV | Missense_Mutation | | c.124G>C | p.Glu42Gln | p.E42Q | P22626 | protein_coding | tolerated(0.13) | benign(0.192) | TCGA-BH-A0HP-01 | Breast | breast invasive carcinoma | Female | >=65 | III/IV | Chemotherapy | doxorubicin | SD |
| HNRNPA2B1 | SNV | Missense_Mutation | | c.46N>A | p.Glu16Lys | p.E16K | P22626 | protein_coding | deleterious(0.01) | probably_damaging(0.932) | TCGA-GM-A2D9-01 | Breast | breast invasive carcinoma | Female | >=65 | I/II | Hormone Therapy | arimidex | SD |
| HNRNPA2B1 | SNV | Missense_Mutation | novel | c.869A>G | p.Tyr290Cys | p.Y290C | P22626 | protein_coding | tolerated(0.17) | benign(0.339) | TCGA-OL-A5RW-01 | Breast | breast invasive carcinoma | Female | <65 | I/II | Chemotherapy | adriamycin | CR |
| HNRNPA2B1 | SNV | Missense_Mutation | novel | c.353G>A | p.Gly118Glu | p.G118E | P22626 | protein_coding | deleterious(0.01) | probably_damaging(0.954) | TCGA-HM-A4S6-01 | Cervix | cervical & endocervical cancer | Female | <65 | III/IV | Chemotherapy | cisplatin | CR |
| HNRNPA2B1 | insertion | In_Frame_Ins | novel | c.356_357insGAACAAAAA | p.Ile119delinsMetAsnLysAsn | p.I119delinsMNKN | P22626 | protein_coding | | | TCGA-DS-A1OC-01 | Cervix | cervical & endocervical cancer | Female | <65 | I/II | Chemotherapy | gemcitabine | SD |
| HNRNPA2B1 | SNV | Missense_Mutation | | c.185N>T | p.Arg62Ile | p.R62I | P22626 | protein_coding | deleterious(0.01) | probably_damaging(0.975) | TCGA-AA-A010-01 | Colorectum | colon adenocarcinoma | Female | <65 | I/II | Chemotherapy | folinic | CR |
| HNRNPA2B1 | SNV | Missense_Mutation | | c.565N>C | p.Ser189Pro | p.S189P | P22626 | protein_coding | tolerated(0.08) | probably_damaging(0.927) | TCGA-G4-6628-01 | Colorectum | colon adenocarcinoma | Male | >=65 | I/II | Unknown | Unknown | SD |
| HNRNPA2B1 | SNV | Missense_Mutation | novel | c.389A>C | p.Asp130Ala | p.D130A | P22626 | protein_coding | deleterious(0) | possibly_damaging(0.467) | TCGA-A5-A0G1-01 | Endometrium | uterine corpus endometrioid carcinoma | Female | >=65 | I/II | Unknown | Unknown | SD |


