| Tissue | Expression Dynamics | Abbreviation |
| Esophagus |  | ESCC: Esophageal squamous cell carcinoma |
| HGIN: High-grade intraepithelial neoplasias |
| LGIN: Low-grade intraepithelial neoplasias |
| GC |  | CAG: Chronic atrophic gastritis |
| CAG with IM: Chronic atrophic gastritis with intestinal metaplasia |
| CSG: Chronic superficial gastritis |
| GC: Gastric cancer |
| SIM: Severe intestinal metaplasia |
| WIM: Wild intestinal metaplasia |
| Oral Cavity | 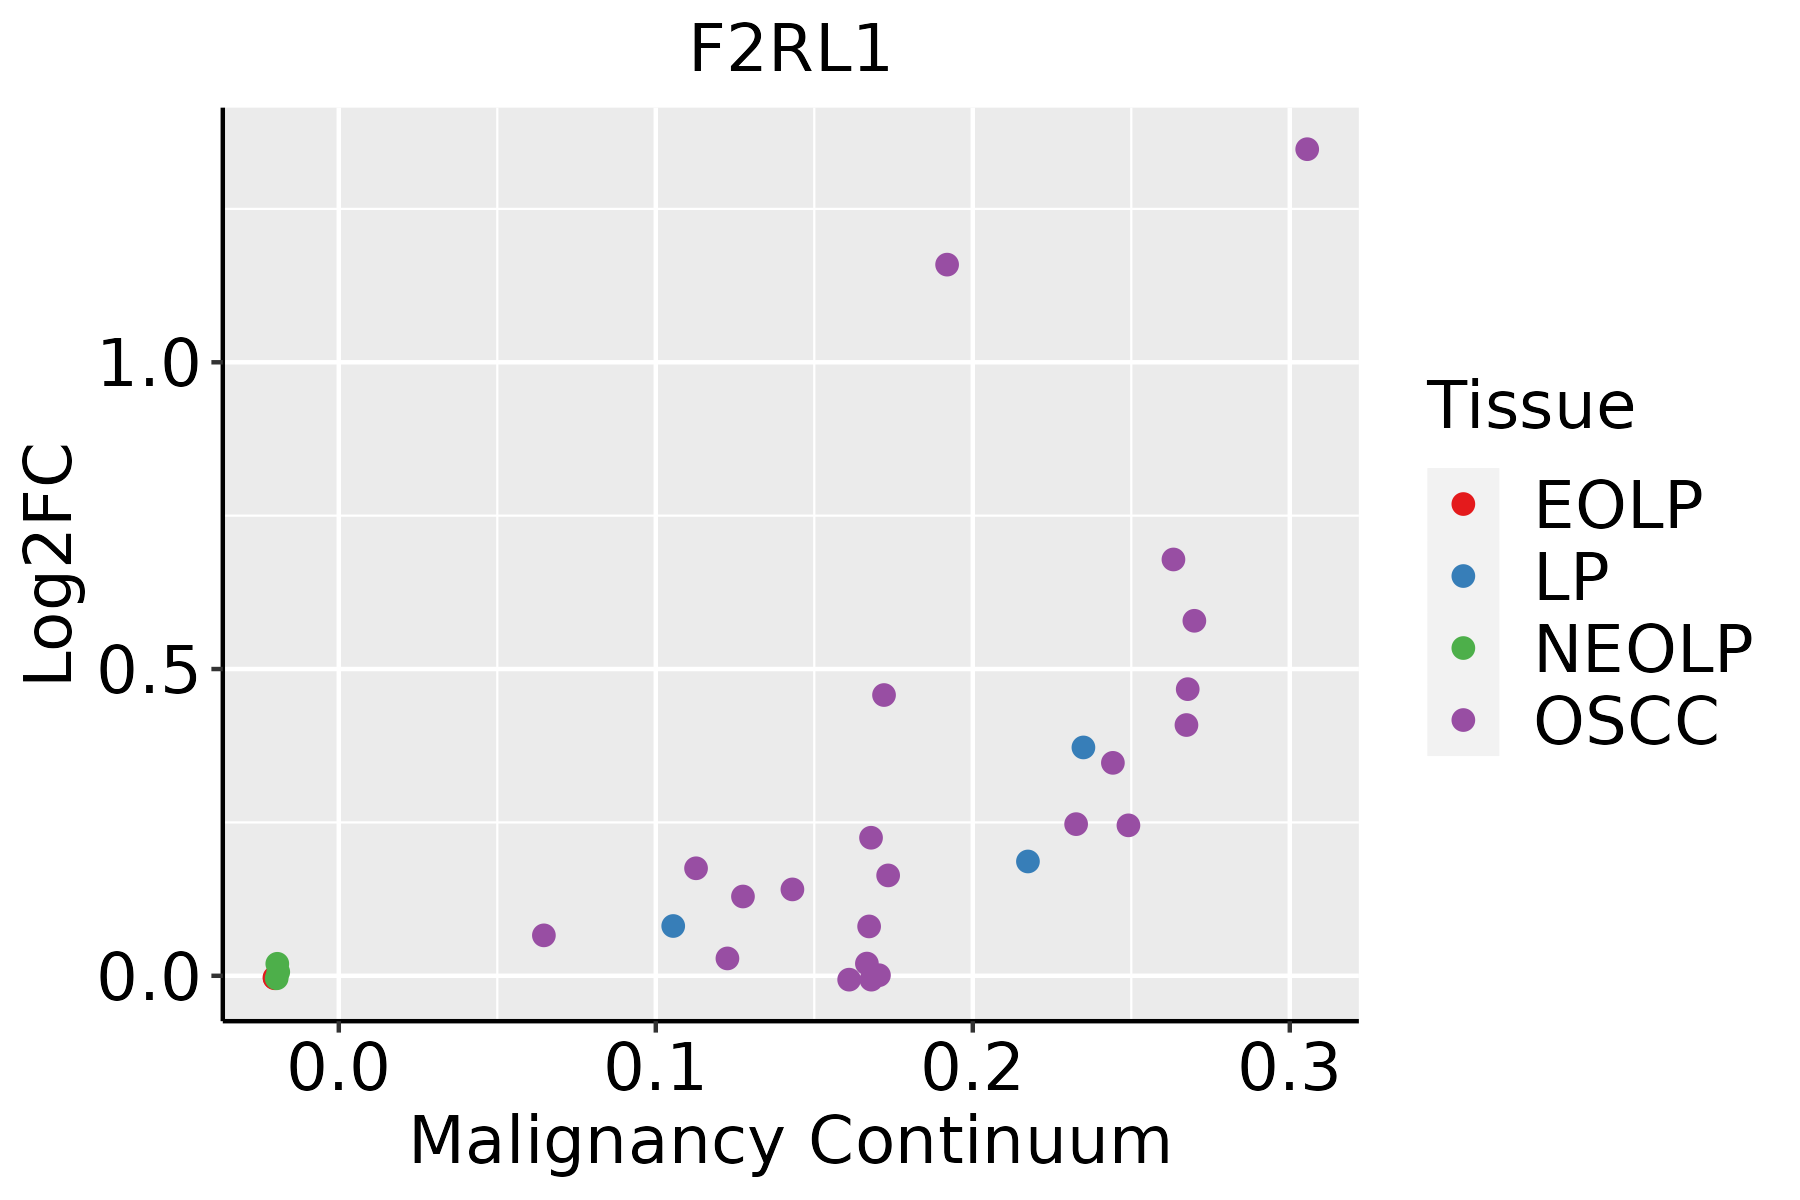 | EOLP: Erosive Oral lichen planus |
| LP: leukoplakia |
| NEOLP: Non-erosive oral lichen planus |
| OSCC: Oral squamous cell carcinoma |
| Skin |  | AK: Actinic keratosis |
| cSCC: Cutaneous squamous cell carcinoma |
| SCCIS:squamous cell carcinoma in situ |
| GO ID | Tissue | Disease Stage | Description | Gene Ratio | Bg Ratio | pvalue | p.adjust | Count |
| GO:20003774 | Stomach | WIM | regulation of reactive oxygen species metabolic process | 11/426 | 157/18723 | 9.53e-04 | 1.46e-02 | 11 |
| GO:00610414 | Stomach | WIM | regulation of wound healing | 10/426 | 134/18723 | 9.94e-04 | 1.50e-02 | 10 |
| GO:190290541 | Stomach | WIM | positive regulation of supramolecular fiber organization | 13/426 | 209/18723 | 1.04e-03 | 1.55e-02 | 13 |
| GO:000315841 | Stomach | WIM | endothelium development | 10/426 | 136/18723 | 1.11e-03 | 1.63e-02 | 10 |
| GO:00507144 | Stomach | WIM | positive regulation of protein secretion | 10/426 | 137/18723 | 1.18e-03 | 1.68e-02 | 10 |
| GO:00439034 | Stomach | WIM | regulation of biological process involved in symbiotic interaction | 7/426 | 72/18723 | 1.24e-03 | 1.74e-02 | 7 |
| GO:00026903 | Stomach | WIM | positive regulation of leukocyte chemotaxis | 8/426 | 94/18723 | 1.36e-03 | 1.86e-02 | 8 |
| GO:00075961 | Stomach | WIM | blood coagulation | 13/426 | 217/18723 | 1.46e-03 | 1.97e-02 | 13 |
| GO:00509211 | Stomach | WIM | positive regulation of chemotaxis | 10/426 | 141/18723 | 1.46e-03 | 1.97e-02 | 10 |
| GO:19030344 | Stomach | WIM | regulation of response to wounding | 11/426 | 167/18723 | 1.57e-03 | 2.08e-02 | 11 |
| GO:00019121 | Stomach | WIM | positive regulation of leukocyte mediated cytotoxicity | 6/426 | 56/18723 | 1.66e-03 | 2.15e-02 | 6 |
| GO:19004264 | Stomach | WIM | positive regulation of defense response to bacterium | 3/426 | 11/18723 | 1.68e-03 | 2.15e-02 | 3 |
| GO:00075991 | Stomach | WIM | hemostasis | 13/426 | 222/18723 | 1.79e-03 | 2.26e-02 | 13 |
| GO:00508171 | Stomach | WIM | coagulation | 13/426 | 222/18723 | 1.79e-03 | 2.26e-02 | 13 |
| GO:00022741 | Stomach | WIM | myeloid leukocyte activation | 13/426 | 223/18723 | 1.86e-03 | 2.33e-02 | 13 |
| GO:00321031 | Stomach | WIM | positive regulation of response to external stimulus | 20/426 | 427/18723 | 1.96e-03 | 2.41e-02 | 20 |
| GO:00019101 | Stomach | WIM | regulation of leukocyte mediated cytotoxicity | 7/426 | 82/18723 | 2.64e-03 | 3.02e-02 | 7 |
| GO:00326124 | Stomach | WIM | interleukin-1 production | 9/426 | 128/18723 | 2.64e-03 | 3.02e-02 | 9 |
| GO:00326524 | Stomach | WIM | regulation of interleukin-1 production | 9/426 | 128/18723 | 2.64e-03 | 3.02e-02 | 9 |
| GO:00026964 | Stomach | WIM | positive regulation of leukocyte activation | 19/426 | 409/18723 | 2.76e-03 | 3.11e-02 | 19 |
| Hugo Symbol | Variant Class | Variant Classification | dbSNP RS | HGVSc | HGVSp | HGVSp Short | SWISSPROT | BIOTYPE | SIFT | PolyPhen | Tumor Sample Barcode | Tissue | Histology | Sex | Age | Stage | Therapy Types | Drugs | Outcome |
| F2RL1 | SNV | Missense_Mutation | rs185549069 | c.308N>A | p.Arg103Gln | p.R103Q | P55085 | protein_coding | deleterious(0.04) | benign(0.103) | TCGA-AN-A046-01 | Breast | breast invasive carcinoma | Female | >=65 | I/II | Unknown | Unknown | SD |
| F2RL1 | SNV | Missense_Mutation | novel | c.946A>T | p.Ser316Cys | p.S316C | P55085 | protein_coding | tolerated(0.05) | possibly_damaging(0.882) | TCGA-BH-A0AY-01 | Breast | breast invasive carcinoma | Female | <65 | I/II | Chemotherapy | | SD |
| F2RL1 | insertion | Nonsense_Mutation | novel | c.703_704insCACATAAGTTAGCATAACATGCTAA | p.Leu235SerfsTer6 | p.L235Sfs*6 | P55085 | protein_coding | | | TCGA-AN-A0FF-01 | Breast | breast invasive carcinoma | Female | <65 | I/II | Unknown | Unknown | SD |
| F2RL1 | insertion | Frame_Shift_Ins | novel | c.947_948insAAATATTGATCTCTACATCCCCCAACACTCCA | p.Ser316ArgfsTer24 | p.S316Rfs*24 | P55085 | protein_coding | | | TCGA-BH-A0AY-01 | Breast | breast invasive carcinoma | Female | <65 | I/II | Chemotherapy | | SD |
| F2RL1 | SNV | Missense_Mutation | novel | c.1076T>C | p.Leu359Pro | p.L359P | P55085 | protein_coding | deleterious(0) | probably_damaging(0.956) | TCGA-2W-A8YY-01 | Cervix | cervical & endocervical cancer | Female | <65 | I/II | Chemotherapy | cisplatin | CR |
| F2RL1 | SNV | Missense_Mutation | novel | c.998N>G | p.Ser333Cys | p.S333C | P55085 | protein_coding | deleterious(0.03) | probably_damaging(0.967) | TCGA-C5-A8YQ-01 | Cervix | cervical & endocervical cancer | Female | >=65 | I/II | Chemotherapy | cisplatin | PD |
| F2RL1 | SNV | Missense_Mutation | novel | c.945N>C | p.Lys315Asn | p.K315N | P55085 | protein_coding | tolerated(0.26) | probably_damaging(0.913) | TCGA-EA-A97N-01 | Cervix | cervical & endocervical cancer | Female | <65 | I/II | Unknown | Unknown | SD |
| F2RL1 | SNV | Missense_Mutation | novel | c.1018N>A | p.Asp340Asn | p.D340N | P55085 | protein_coding | deleterious(0) | probably_damaging(0.999) | TCGA-EI-6917-01 | Colorectum | rectum adenocarcinoma | Male | <65 | III/IV | Chemotherapy | 5fluorouracil+oxaciplatina+l-folinian | SD |
| F2RL1 | SNV | Missense_Mutation | novel | c.1019N>G | p.Asp340Gly | p.D340G | P55085 | protein_coding | deleterious(0) | probably_damaging(0.999) | TCGA-AJ-A23O-01 | Endometrium | uterine corpus endometrioid carcinoma | Female | >=65 | I/II | Unknown | Unknown | SD |
| F2RL1 | SNV | Missense_Mutation | | c.376N>G | p.Ile126Val | p.I126V | P55085 | protein_coding | tolerated(0.34) | benign(0.012) | TCGA-AP-A054-01 | Endometrium | uterine corpus endometrioid carcinoma | Female | <65 | III/IV | Chemotherapy | carboplatin | PD |
| Entrez ID | Symbol | Category | Interaction Types | Drug Claim Name | Drug Name | PMIDs |
| 2150 | F2RL1 | DRUGGABLE GENOME, G PROTEIN COUPLED RECEPTOR, KINASE, ENZYME | | ERYTHROMYCIN | ERYTHROMYCIN | 18212111 |
| 2150 | F2RL1 | DRUGGABLE GENOME, G PROTEIN COUPLED RECEPTOR, KINASE, ENZYME | | AC-55541 | CHEMBL493076 | 18720984 |
| 2150 | F2RL1 | DRUGGABLE GENOME, G PROTEIN COUPLED RECEPTOR, KINASE, ENZYME | agonist | 178100874 | | |
| 2150 | F2RL1 | DRUGGABLE GENOME, G PROTEIN COUPLED RECEPTOR, KINASE, ENZYME | | ROXITHROMYCIN | ROXITHROMYCIN | 18212111 |
| 2150 | F2RL1 | DRUGGABLE GENOME, G PROTEIN COUPLED RECEPTOR, KINASE, ENZYME | antagonist | 381744949 | | |
| 2150 | F2RL1 | DRUGGABLE GENOME, G PROTEIN COUPLED RECEPTOR, KINASE, ENZYME | agonist | 178103272 | | |
| 2150 | F2RL1 | DRUGGABLE GENOME, G PROTEIN COUPLED RECEPTOR, KINASE, ENZYME | antagonist | 178103271 | | |
| 2150 | F2RL1 | DRUGGABLE GENOME, G PROTEIN COUPLED RECEPTOR, KINASE, ENZYME | agonist | 178100746 | | |
| 2150 | F2RL1 | DRUGGABLE GENOME, G PROTEIN COUPLED RECEPTOR, KINASE, ENZYME | agonist | 178103269 | | |
| 2150 | F2RL1 | DRUGGABLE GENOME, G PROTEIN COUPLED RECEPTOR, KINASE, ENZYME | antagonist | 178103270 | | |


