| Tissue | Expression Dynamics | Abbreviation |
| Breast |  | IDC: Invasive ductal carcinoma |
| DCIS: Ductal carcinoma in situ |
| Precancer(BRCA1-mut): Precancerous lesion from BRCA1 mutation carriers |
| Cervix | 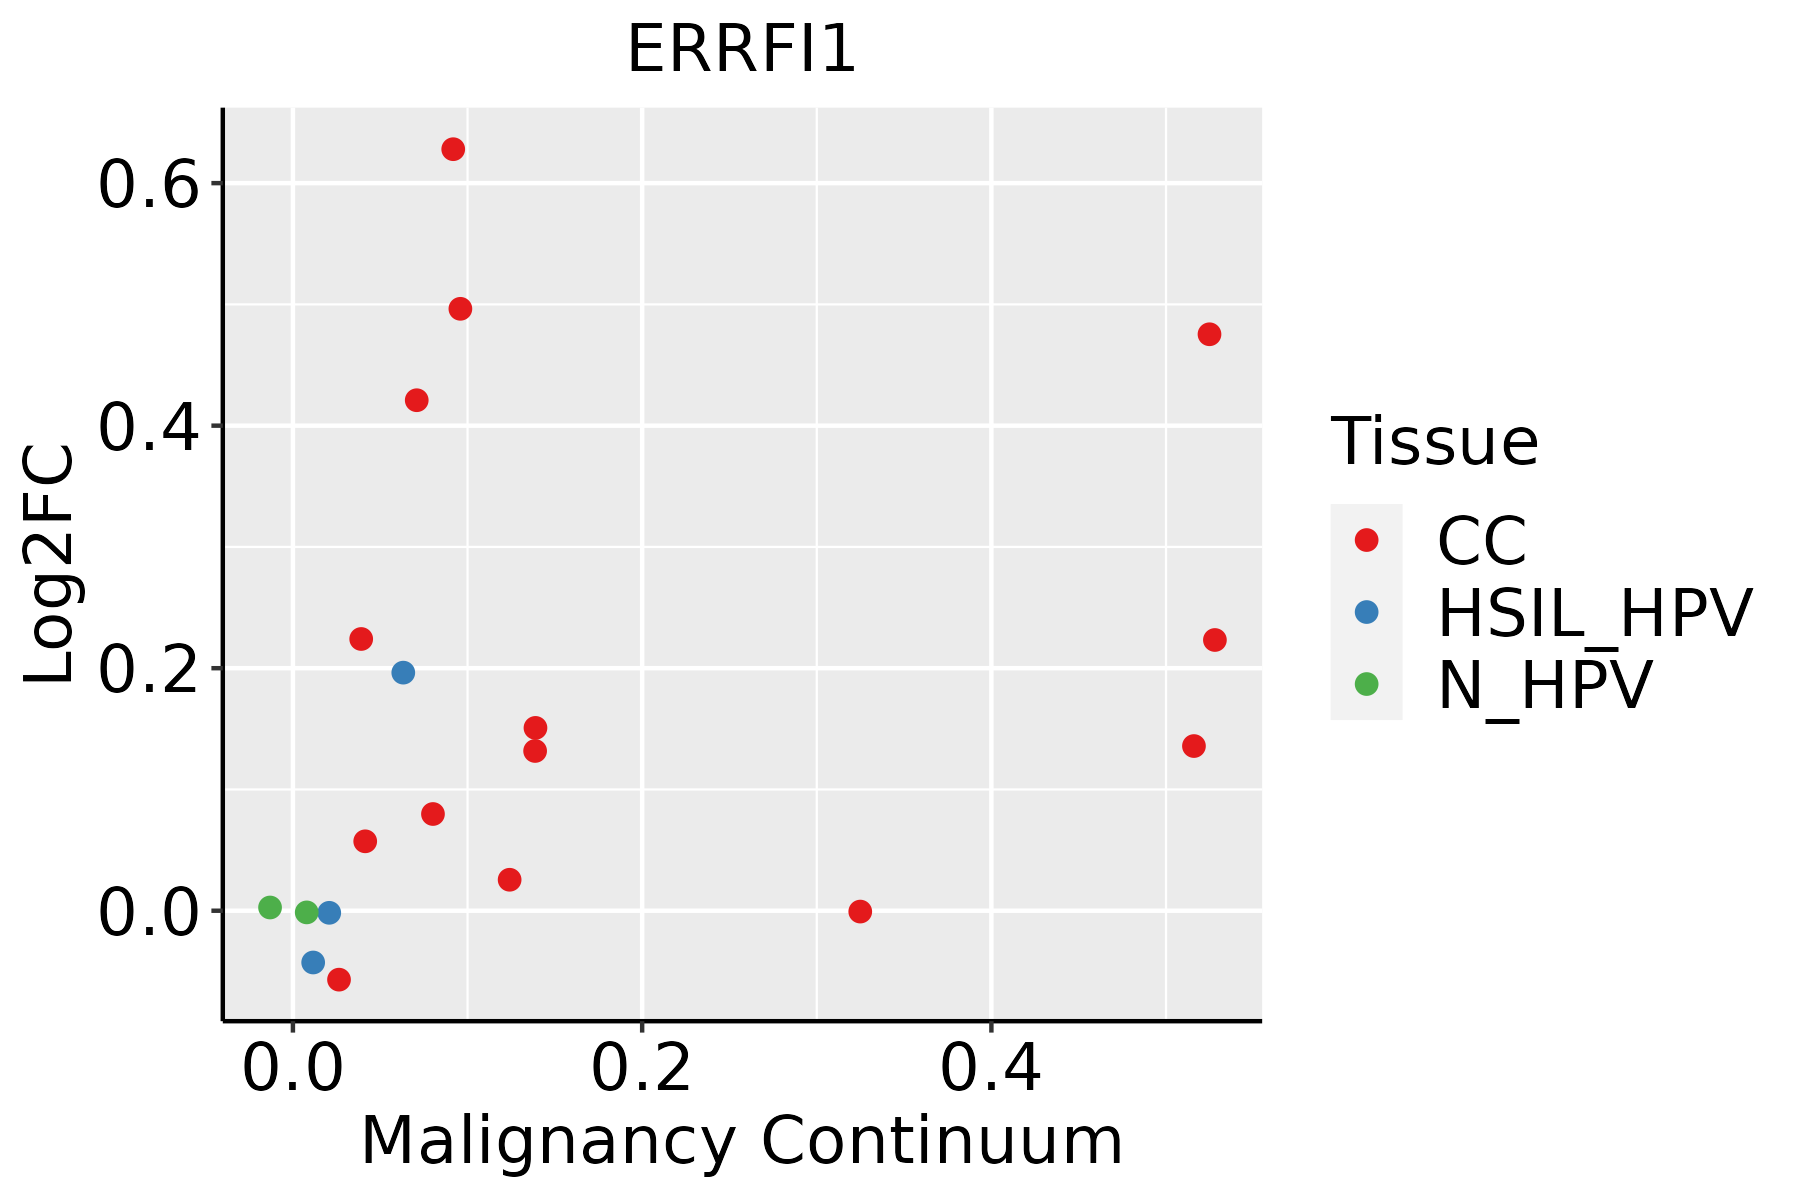 | CC: Cervix cancer |
| HSIL_HPV: HPV-infected high-grade squamous intraepithelial lesions |
| N_HPV: HPV-infected normal cervix |
| Endometrium | 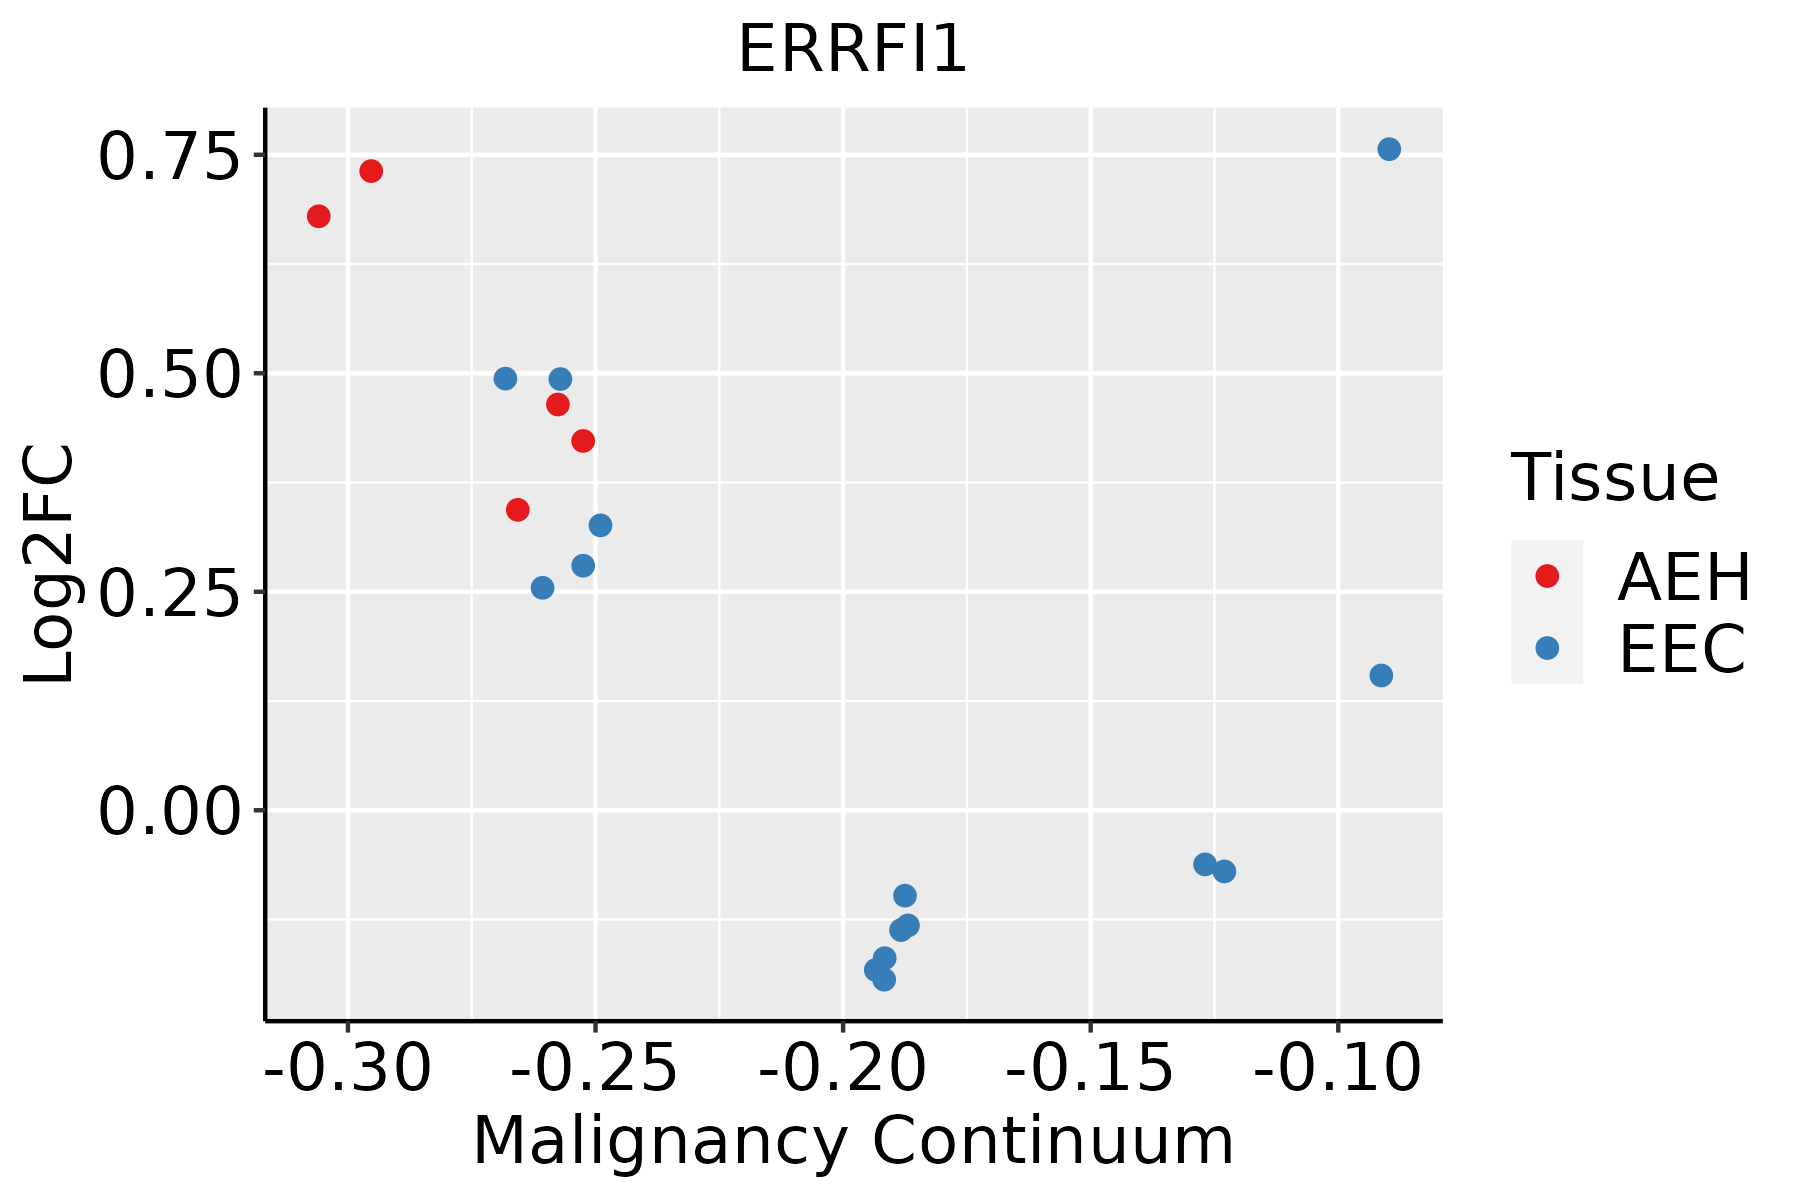 | AEH: Atypical endometrial hyperplasia |
| EEC: Endometrioid Cancer |
| Esophagus | 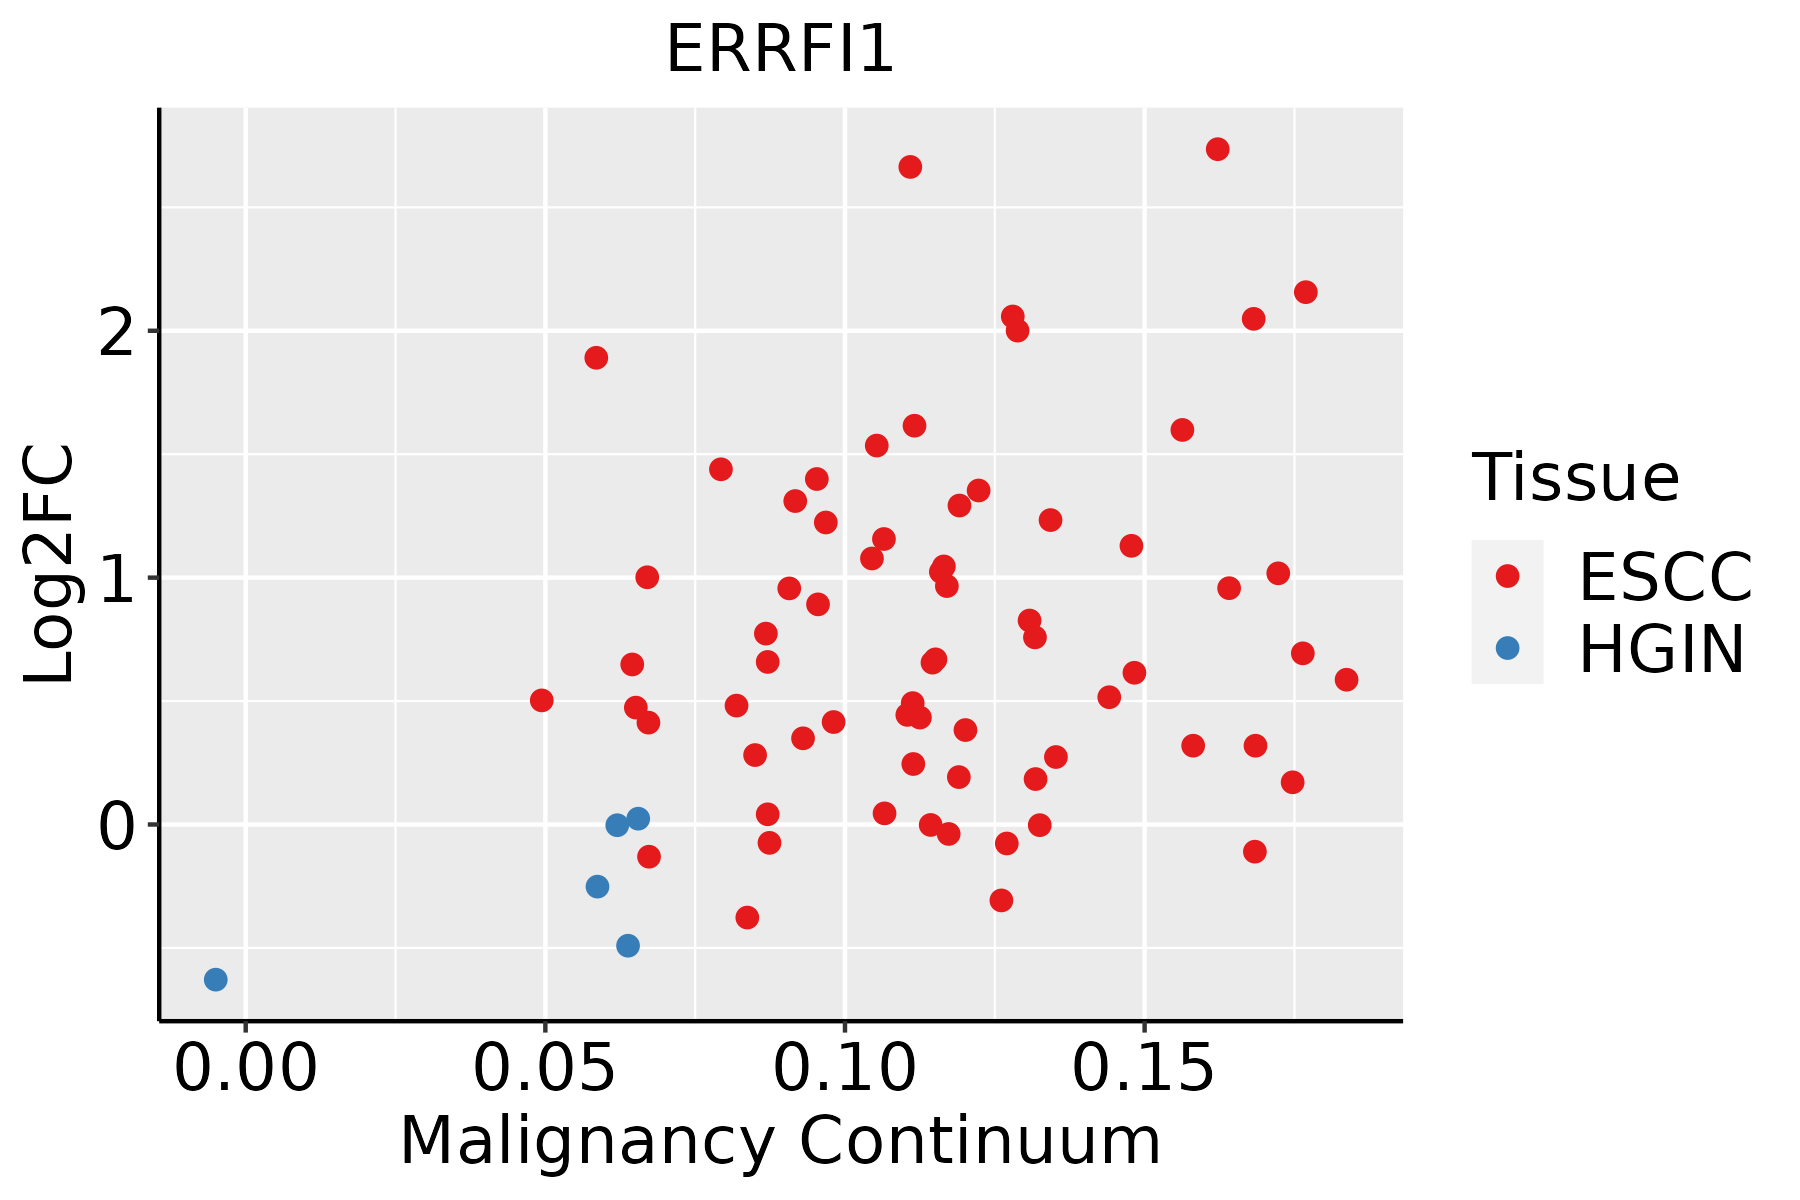 | ESCC: Esophageal squamous cell carcinoma |
| HGIN: High-grade intraepithelial neoplasias |
| LGIN: Low-grade intraepithelial neoplasias |
| GC | 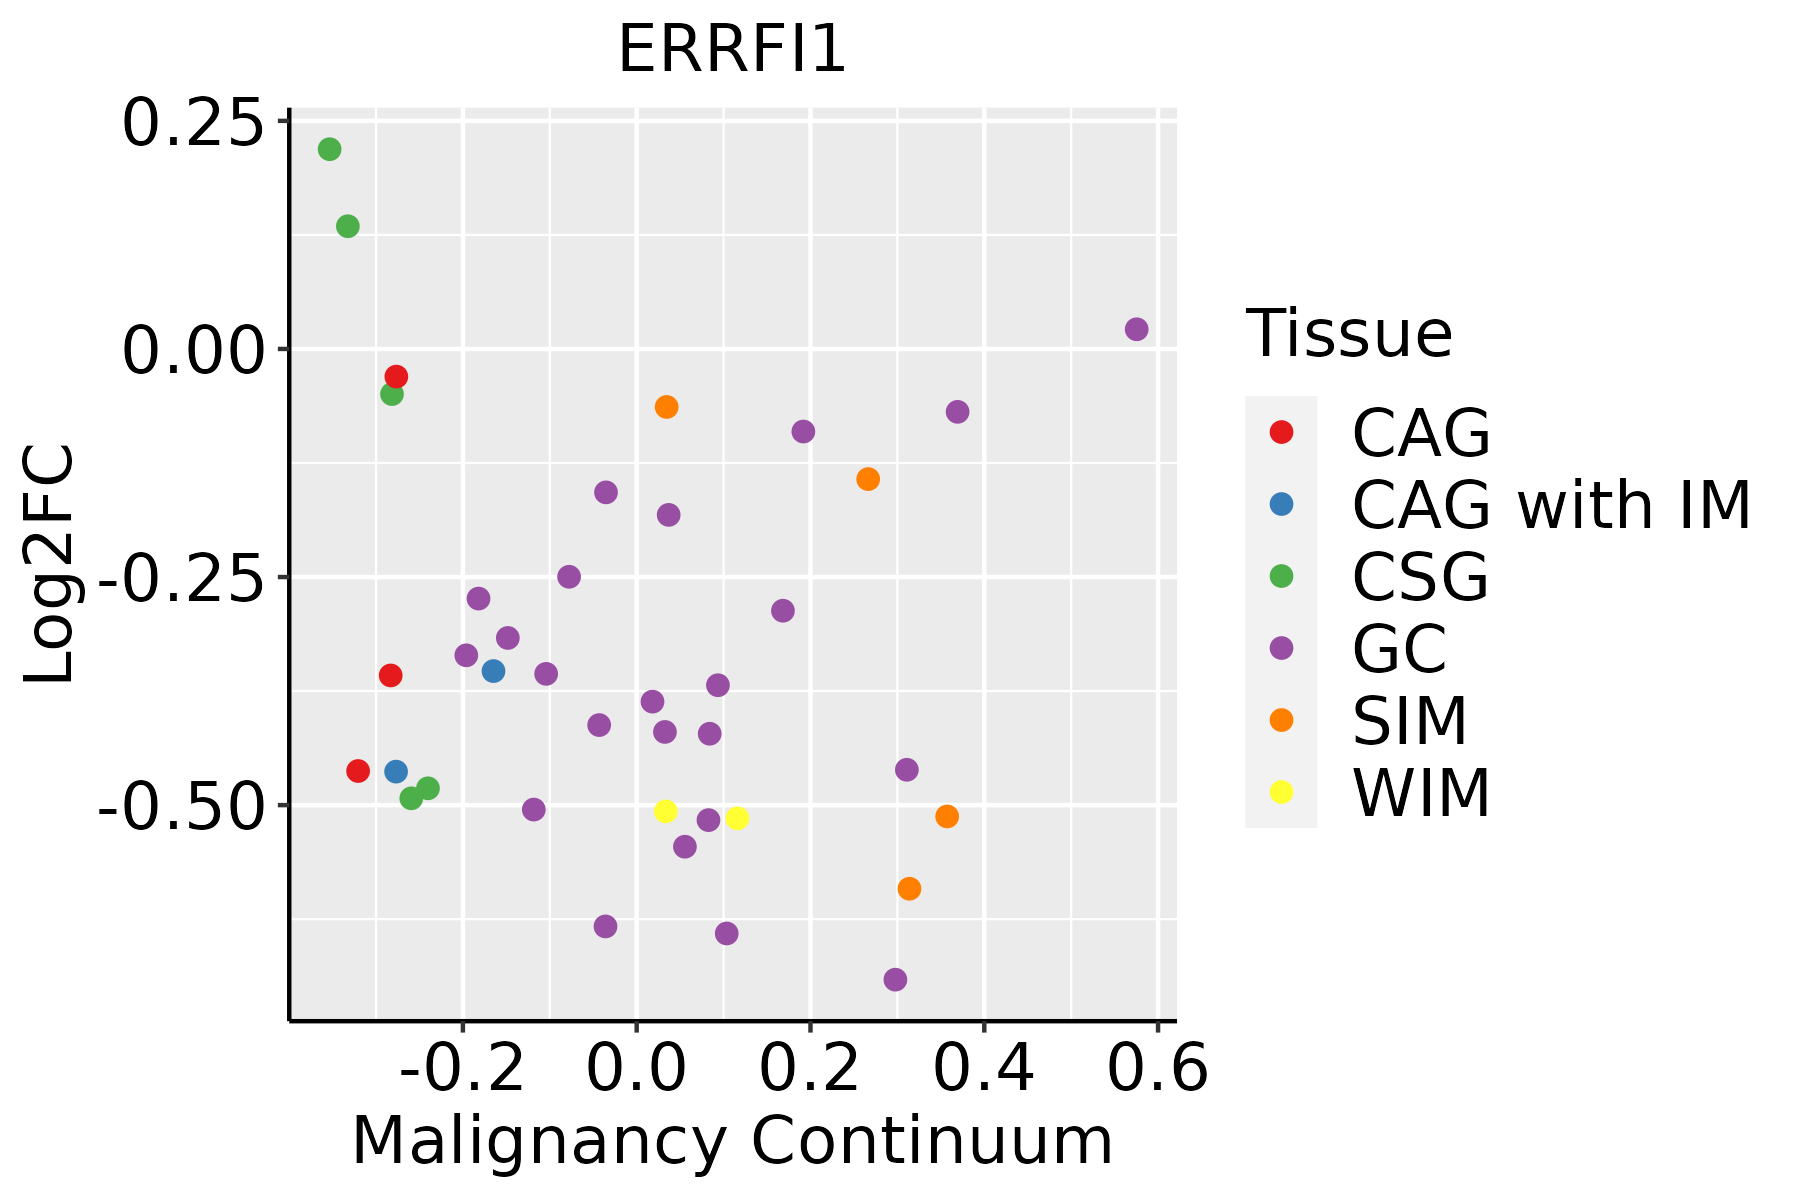 | CAG: Chronic atrophic gastritis |
| CAG with IM: Chronic atrophic gastritis with intestinal metaplasia |
| CSG: Chronic superficial gastritis |
| GC: Gastric cancer |
| SIM: Severe intestinal metaplasia |
| WIM: Wild intestinal metaplasia |
| Liver |  | HCC: Hepatocellular carcinoma |
| NAFLD: Non-alcoholic fatty liver disease |
| Lung |  | AAH: Atypical adenomatous hyperplasia |
| AIS: Adenocarcinoma in situ |
| IAC: Invasive lung adenocarcinoma |
| MIA: Minimally invasive adenocarcinoma |
| Oral Cavity | 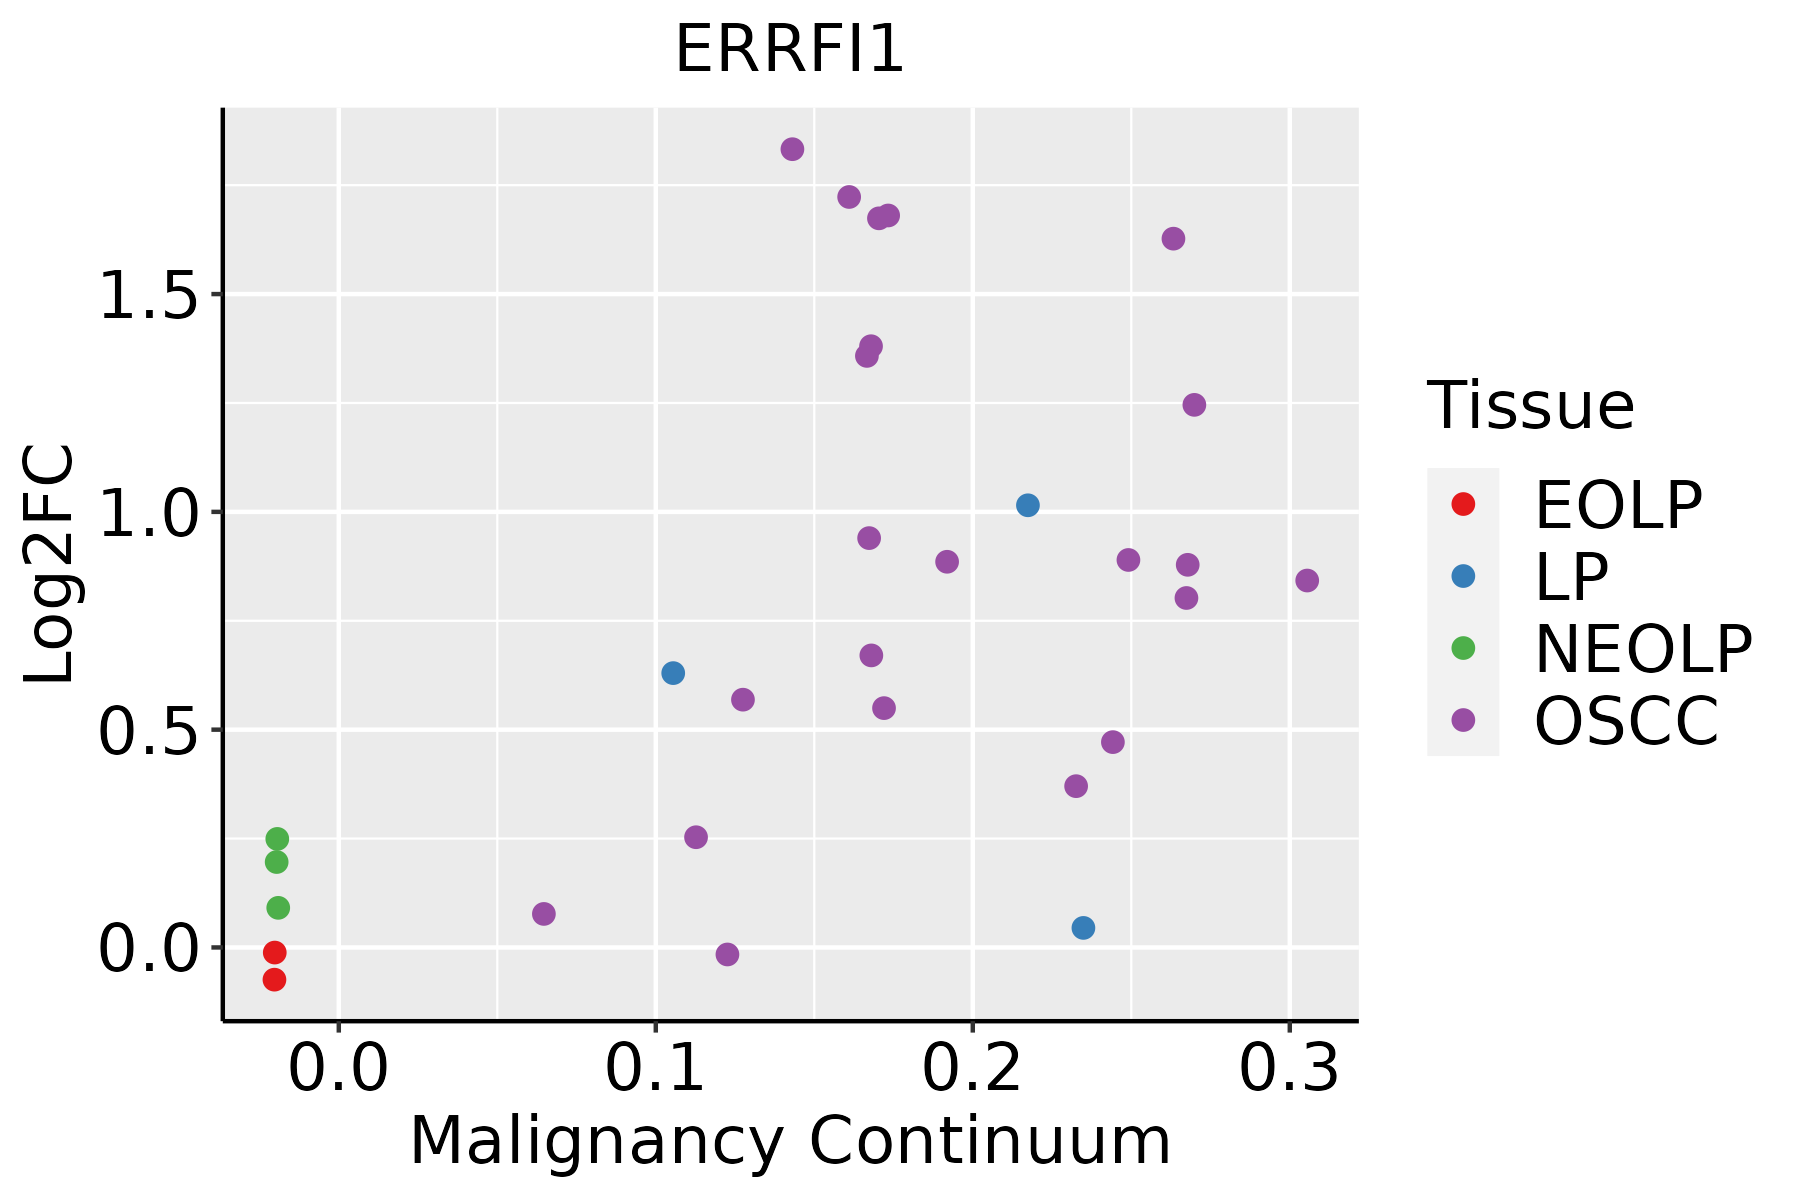 | EOLP: Erosive Oral lichen planus |
| LP: leukoplakia |
| NEOLP: Non-erosive oral lichen planus |
| OSCC: Oral squamous cell carcinoma |
| Prostate | 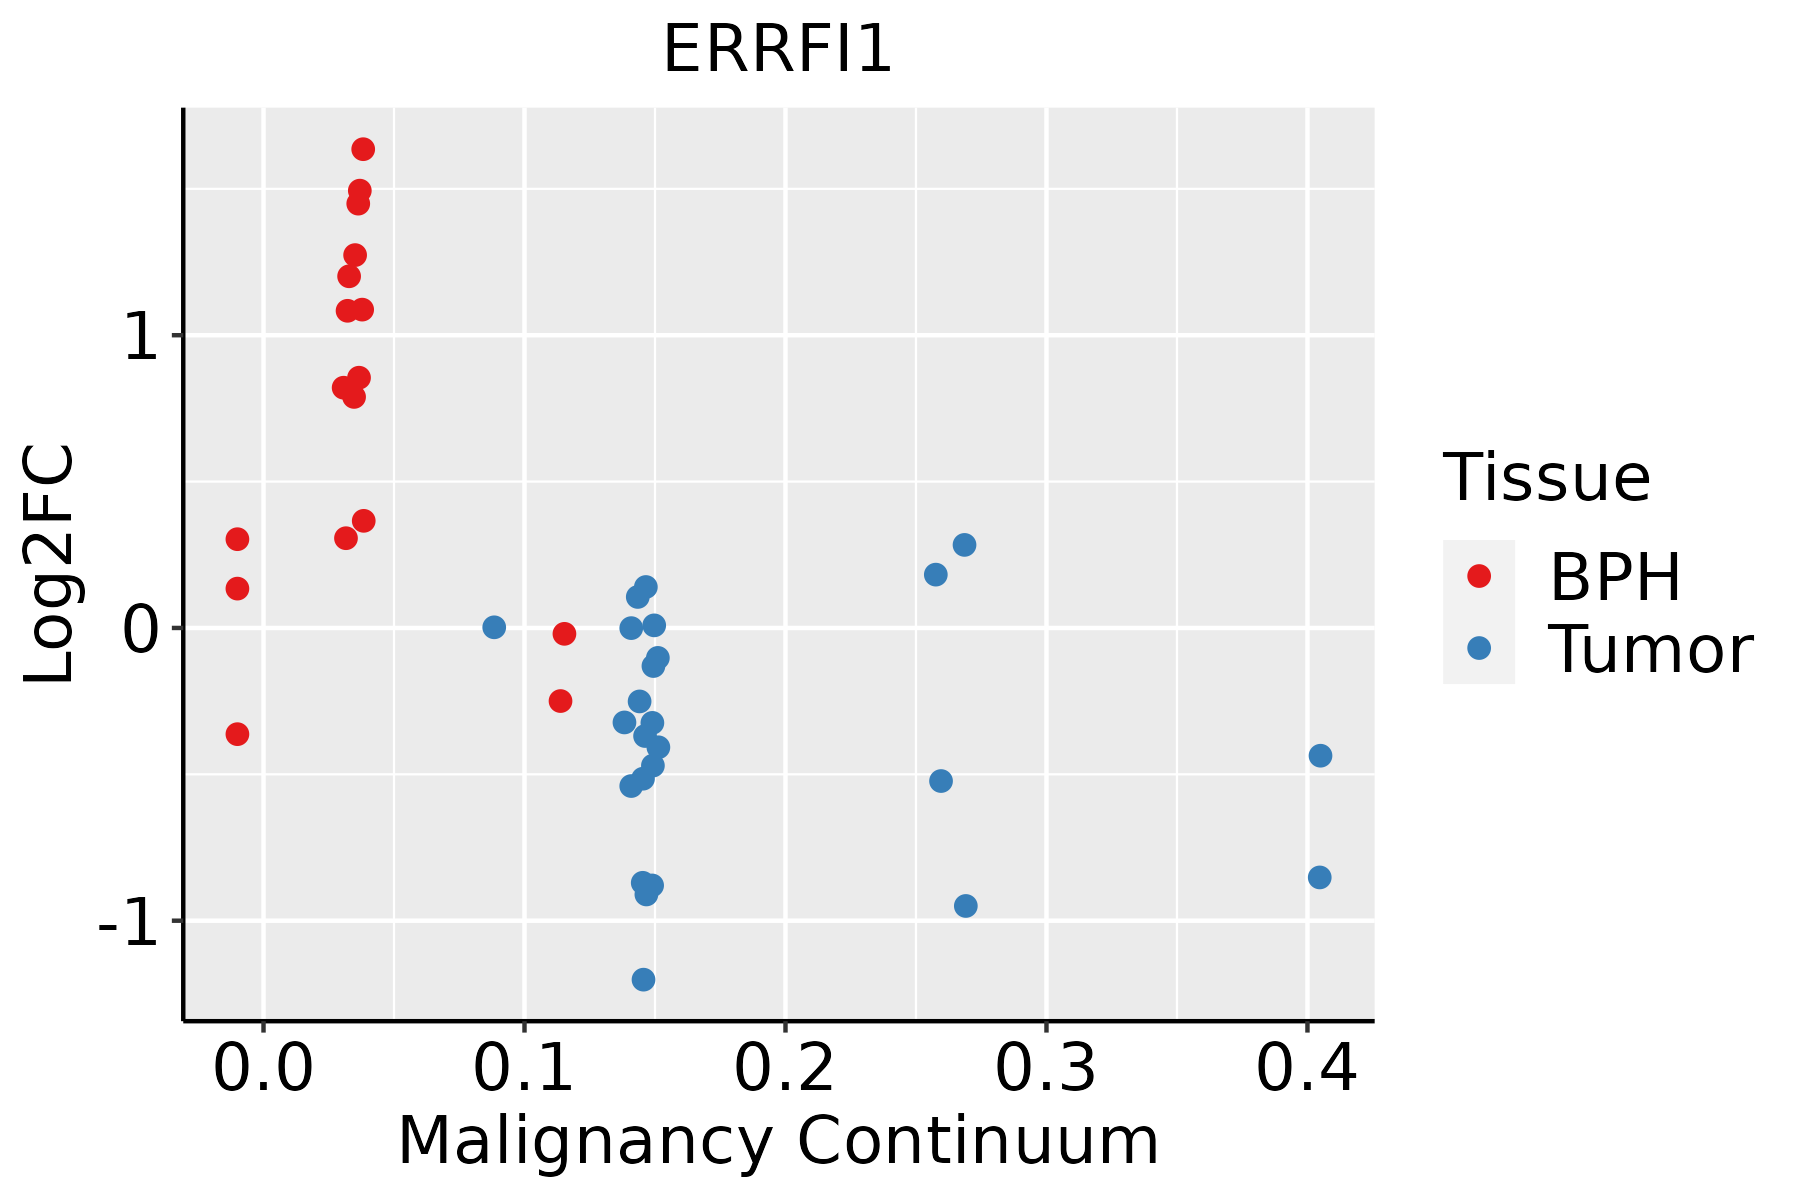 | BPH: Benign Prostatic Hyperplasia |
| Skin | 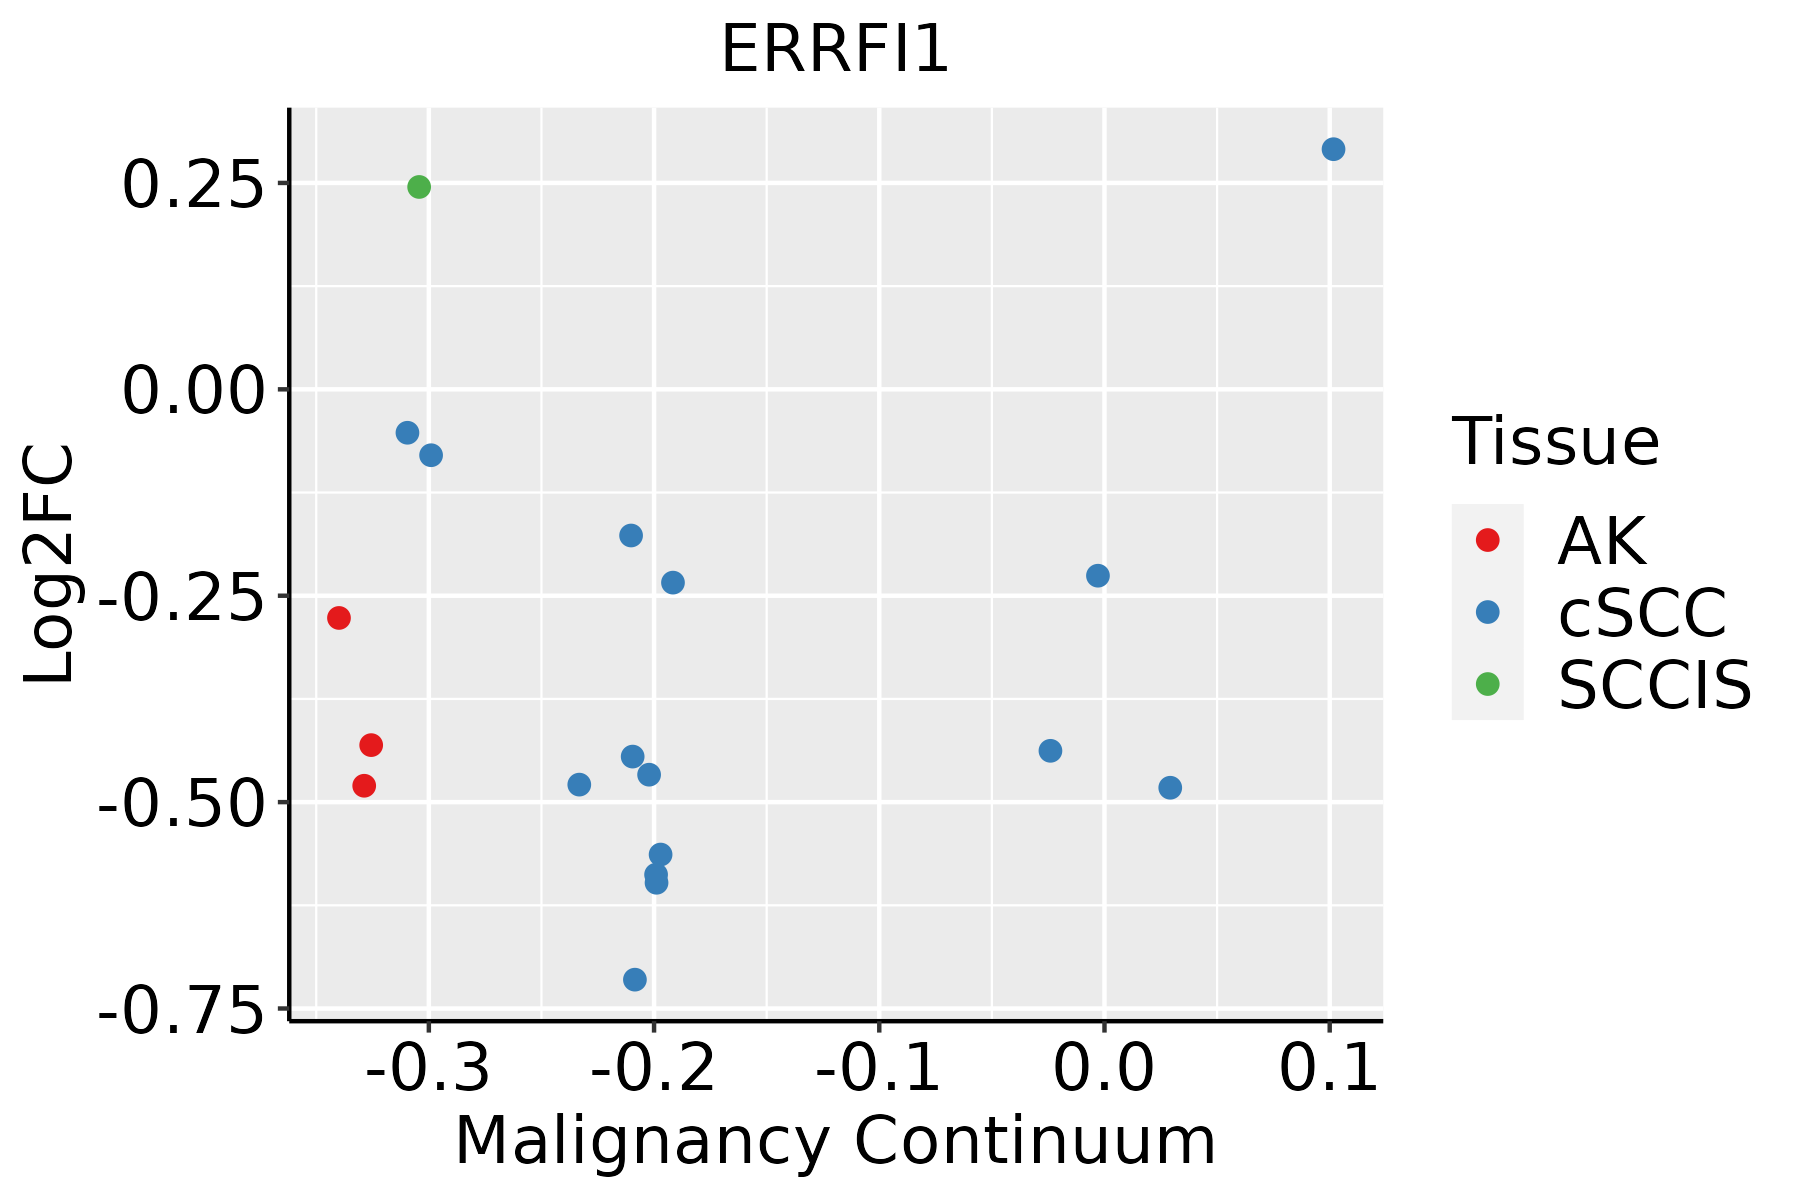 | AK: Actinic keratosis |
| cSCC: Cutaneous squamous cell carcinoma |
| SCCIS:squamous cell carcinoma in situ |
| Thyroid |  | ATC: Anaplastic thyroid cancer |
| HT: Hashimoto's thyroiditis |
| PTC: Papillary thyroid cancer |
| GO ID | Tissue | Disease Stage | Description | Gene Ratio | Bg Ratio | pvalue | p.adjust | Count |
| GO:000697014 | Oral cavity | LP | response to osmotic stress | 32/4623 | 84/18723 | 4.36e-03 | 2.79e-02 | 32 |
| GO:190118513 | Oral cavity | LP | negative regulation of ERBB signaling pathway | 15/4623 | 32/18723 | 5.23e-03 | 3.19e-02 | 15 |
| GO:190118412 | Oral cavity | LP | regulation of ERBB signaling pathway | 30/4623 | 79/18723 | 5.97e-03 | 3.54e-02 | 30 |
| GO:003812716 | Oral cavity | LP | ERBB signaling pathway | 42/4623 | 121/18723 | 8.53e-03 | 4.61e-02 | 42 |
| GO:006219718 | Prostate | BPH | cellular response to chemical stress | 110/3107 | 337/18723 | 2.44e-13 | 2.40e-11 | 110 |
| GO:004854518 | Prostate | BPH | response to steroid hormone | 109/3107 | 339/18723 | 9.35e-13 | 8.15e-11 | 109 |
| GO:007138316 | Prostate | BPH | cellular response to steroid hormone stimulus | 71/3107 | 204/18723 | 1.72e-10 | 9.79e-09 | 71 |
| GO:004593618 | Prostate | BPH | negative regulation of phosphate metabolic process | 124/3107 | 441/18723 | 5.95e-10 | 2.90e-08 | 124 |
| GO:001056318 | Prostate | BPH | negative regulation of phosphorus metabolic process | 124/3107 | 442/18723 | 6.94e-10 | 3.25e-08 | 124 |
| GO:190165417 | Prostate | BPH | response to ketone | 67/3107 | 194/18723 | 8.10e-10 | 3.74e-08 | 67 |
| GO:004232617 | Prostate | BPH | negative regulation of phosphorylation | 110/3107 | 385/18723 | 2.08e-09 | 8.35e-08 | 110 |
| GO:190165310 | Prostate | BPH | cellular response to peptide | 104/3107 | 359/18723 | 2.51e-09 | 1.00e-07 | 104 |
| GO:000193317 | Prostate | BPH | negative regulation of protein phosphorylation | 97/3107 | 342/18723 | 2.74e-08 | 8.11e-07 | 97 |
| GO:00506739 | Prostate | BPH | epithelial cell proliferation | 116/3107 | 437/18723 | 7.12e-08 | 1.85e-06 | 116 |
| GO:00506789 | Prostate | BPH | regulation of epithelial cell proliferation | 104/3107 | 381/18723 | 7.52e-08 | 1.92e-06 | 104 |
| GO:005134818 | Prostate | BPH | negative regulation of transferase activity | 78/3107 | 268/18723 | 1.94e-07 | 4.29e-06 | 78 |
| GO:004343417 | Prostate | BPH | response to peptide hormone | 109/3107 | 414/18723 | 2.73e-07 | 5.91e-06 | 109 |
| GO:00713759 | Prostate | BPH | cellular response to peptide hormone stimulus | 82/3107 | 290/18723 | 3.65e-07 | 7.65e-06 | 82 |
| GO:005138416 | Prostate | BPH | response to glucocorticoid | 49/3107 | 148/18723 | 6.20e-07 | 1.21e-05 | 49 |
| GO:007084910 | Prostate | BPH | response to epidermal growth factor | 23/3107 | 49/18723 | 7.27e-07 | 1.38e-05 | 23 |
| Hugo Symbol | Variant Class | Variant Classification | dbSNP RS | HGVSc | HGVSp | HGVSp Short | SWISSPROT | BIOTYPE | SIFT | PolyPhen | Tumor Sample Barcode | Tissue | Histology | Sex | Age | Stage | Therapy Types | Drugs | Outcome |
| ERRFI1 | SNV | Missense_Mutation | rs750025751 | c.777N>C | p.Lys259Asn | p.K259N | Q9UJM3 | protein_coding | deleterious(0) | probably_damaging(0.997) | TCGA-D8-A1X6-01 | Breast | breast invasive carcinoma | Female | >=65 | III/IV | Hormone Therapy | tamoxiphen | SD |
| ERRFI1 | insertion | Frame_Shift_Ins | novel | c.86dupT | p.Met29IlefsTer11 | p.M29Ifs*11 | Q9UJM3 | protein_coding | | | TCGA-A8-A06O-01 | Breast | breast invasive carcinoma | Female | <65 | I/II | Hormone Therapy | letrozole | SD |
| ERRFI1 | insertion | Frame_Shift_Ins | novel | c.84_85insCCTCCTCCACCTCAGACCCACCGAAGATTAAGAAGGTCTC | p.Met29ProfsTer24 | p.M29Pfs*24 | Q9UJM3 | protein_coding | | | TCGA-A8-A06O-01 | Breast | breast invasive carcinoma | Female | <65 | I/II | Hormone Therapy | letrozole | SD |
| ERRFI1 | insertion | Frame_Shift_Ins | novel | c.147_148insTTCTA | p.Ile50PhefsTer2 | p.I50Ffs*2 | Q9UJM3 | protein_coding | | | TCGA-BH-A0E2-01 | Breast | breast invasive carcinoma | Female | <65 | III/IV | Chemotherapy | doxorubicin | SD |
| ERRFI1 | insertion | Nonsense_Mutation | novel | c.146_147insTTTTCCCCTGTGCCCCTCTTTGTGAACGGG | p.Pro49_Ile50insPheProLeuCysProSerLeuTerThrGly | p.P49_I50insFPLCPSL*TG | Q9UJM3 | protein_coding | | | TCGA-BH-A0E2-01 | Breast | breast invasive carcinoma | Female | <65 | III/IV | Chemotherapy | doxorubicin | SD |
| ERRFI1 | SNV | Missense_Mutation | novel | c.1291G>A | p.Gly431Ser | p.G431S | Q9UJM3 | protein_coding | tolerated_low_confidence(0.56) | benign(0) | TCGA-2W-A8YY-01 | Cervix | cervical & endocervical cancer | Female | <65 | I/II | Chemotherapy | cisplatin | CR |
| ERRFI1 | SNV | Missense_Mutation | rs781338553 | c.1358G>A | p.Arg453His | p.R453H | Q9UJM3 | protein_coding | deleterious_low_confidence(0) | benign(0.054) | TCGA-FU-A3HZ-01 | Cervix | cervical & endocervical cancer | Female | <65 | I/II | Chemotherapy | cisplatin | CR |
| ERRFI1 | SNV | Missense_Mutation | rs746056102 | c.731N>A | p.Arg244Gln | p.R244Q | Q9UJM3 | protein_coding | deleterious(0.01) | benign(0.081) | TCGA-AA-3947-01 | Colorectum | colon adenocarcinoma | Female | <65 | I/II | Unknown | Unknown | SD |
| ERRFI1 | SNV | Missense_Mutation | novel | c.763N>C | p.Gly255Arg | p.G255R | Q9UJM3 | protein_coding | deleterious(0) | probably_damaging(0.999) | TCGA-AA-A02W-01 | Colorectum | colon adenocarcinoma | Female | >=65 | I/II | Unknown | Unknown | PD |
| ERRFI1 | SNV | Missense_Mutation | rs779337445 | c.1227N>T | p.Lys409Asn | p.K409N | Q9UJM3 | protein_coding | deleterious(0) | possibly_damaging(0.796) | TCGA-AD-6895-01 | Colorectum | colon adenocarcinoma | Male | >=65 | III/IV | Unknown | Unknown | SD |


